HAL Id: hal-02981284
https://hal.archives-ouvertes.fr/hal-02981284
Submitted on 8 Nov 2020HAL is a multi-disciplinary open access archive for the deposit and dissemination of sci-entific research documents, whether they are pub-lished or not. The documents may come from teaching and research institutions in France or abroad, or from public or private research centers.
L’archive ouverte pluridisciplinaire HAL, est destinée au dépôt et à la diffusion de documents scientifiques de niveau recherche, publiés ou non, émanant des établissements d’enseignement et de recherche français ou étrangers, des laboratoires publics ou privés.
of follicular lymphoma in a context of
radioimmunotherapy
Julien Bordes, Sébastien Incerti, Erick Mora-ramirez, Jonathan Tranel, Cédric
Rossi, Christine Bezombes, Julie Bordenave, Manuel Bardiès, Richard Brown,
Marie-Claude Bordage
To cite this version:
Julien Bordes, Sébastien Incerti, Erick Mora-ramirez, Jonathan Tranel, Cédric Rossi, et al.. Monte Carlo dosimetry of a realistic multicellular model of follicular lymphoma in a context of radioim-munotherapy. Med.Phys., 2020, mp.14370. �10.1002/mp.14370�. �hal-02981284�
Monte Carlo dosimetry of a realistic multicellular model of follicular lymphoma in a
1context of radioimmunotherapy
2Julien Bordesa,b*, Sébastien Incertic,d, Erick Mora-Ramireza,b,e, Jonathan Tranela,b, Cédric Rossia,b,f,
Chris-3
tine Bezombesa,b, Julie Bordenave a,b, Manuel Bardièsa,b, Richard Browng, Marie-Claude Bordagea,b
4
a CRCT, UMR 1037 INSERM, Université Paul Sabatier F-31037 Toulouse, France
5
b UMR 1037, CRCT, Université Toulouse III-Paul Sabatier, F-31037, France
6
c Université de Bordeaux, CENBG, UMR 5797, F-33170 Gradignan, France
7
d CNRS, IN2P3, CENBG, UMR 5797, F-33170 Gradignan, France
8
e Universidad de Costa Rica, Escuela de Física, CICANUM, San José, Costa Rica
9
f CHU Dijon, Hématologie Clinique, Hôpital François Mitterand, 21000 Dijon, France
10
g Institute of Nuclear Medicine, University College London, UK
11
12
* Corresponding author at: 13
Centre de Recherches en Cancérologie de Toulouse 14
INSERM UMR 1037 / Université Toulouse III Paul Sabatier 15
2 avenue Hubert Curien CS 53717 16
31037 TOULOUSE CEDEX 1 FRANCE 17 18 E-mail addresses: 19 julien.j.bordes@gmail.com 20 incerti@cenbg.in2p3.fr 21 erick.mora@ucr.ac.cr 22 j.tranel@hotmail.fr 23
cedric.rossi@chu-dijon.fr 24 christine.bezombes@inserm.fr 25 julie.bordenave@inserm.fr 26 manuel.bardies@inserm.fr 27 richard.brown@ucl.ac.uk 28 marie-claude.bordage@inserm.fr 29 Keywords: 30
Small-scale dosimetry, realistic biological data, rituximab, Auger electrons, β- particles.
31
Abstract:
32
Purpose. Tumors geometry and radiopharmaceutical biodistribution impact the energy
deposi-33
tion in targeted radionuclide therapy. However, small-scale dosimetry studies generally consider an ar-34
tificial environment where the tumors are spherical and the radionuclides are homogeneously biodis-35
tributed. To bring realism, we developed a dosimetric methodology based on a three-dimensional in 36
vitro model of follicular lymphoma incubated with rituximab, an anti-CD20 monoclonal antibody used
37
in the treatment of non-Hodgkin lymphomas, which might be combined with a radionuclide. The effects 38
of the realistic geometry and biodistribution on the absorbed dose were highlighted by comparison with 39
literature data. Additionally, to illustrate the possibilities of this methodology, the effect of different ra-40
dionuclides on the absorbed dose distribution delivered to the in vitro tumor were compared. 41
Methods. The starting point was a model named Multicellular Aggregates of Lymphoma Cells
42
(MALC). Three MALCs of different dimensions and their rituximab biodistribution were considered. Ge-43
ometry, antibody location and concentration were extracted from selective plane illumination micros-44
copy. Assuming antibody radiolabeling with Auger electron (125I and 111In) and β- particle emitters
45
(177Lu, 131I and 90Y), we simulated energy deposition in MALCs using two Monte Carlo codes:
Geant4-46
DNA with “CPA100” physics models for Auger electrons emitters and Geant4 with “Livermore” physics 47
models for β- particles emitters.
Results. MALCs had ellipsoid-like shapes with major radii, r, of ~ 0.25, ~ 0.5 and ~ 1.3 mm.
Ritux-49
imab was concentrated in the periphery of the MALCs. The absorbed doses delivered by 177Lu, 131I and
50
90Y in MALCs were compared with literature data for spheres with two types of homogeneous
biodistri-51
butions (on the surface or throughout the volume). Compared to the MALCs, the mean absorbed doses 52
delivered in spheres with surface biodistributions were between 18% and 38% lower, while with vol-53
ume biodistribution they were between 15% and 29% higher. Regarding the radionuclides comparison, 54
the relationship between MALC dimensions, rituximab biodistribution and energy released per decay 55
impacted the absorbed doses. Despite releasing less energy, 125I delivered a greater absorbed dose per
56
decay than 111In in the r ~ 0.25 mm MALC (6.78 · 10-2 vs. 6.26 · 10-2 µGy · Bq-1 · s-1). Similarly, the absorbed
57
doses per decay in the r ~ 0.5 mm MALC for 177Lu (2.41 · 10-2 µGy · Bq-1 · s-1) and 131I (2.46 · 10-2 µGy ·
58
Bq-1 · s-1) are higher than for 90Y (1.98 · 10-2 µGy · Bq-1 · s-1). Furthermore, radionuclides releasing more
59
energy per decay delivered absorbed dose more uniformly thorough the MALCs. Finally, when consid-60
ering the radiopharmaceutical effective half-life, due to the biological half-life of rituximab being best 61
matched by the physical half-life of 131I and 177Lu compared to 90Y, the first two radionuclides delivered
62
higher absorbed dose. 63
Conclusion. In the MALCs considered, β- emitters delivered higher and more uniform absorbed
64
dose than Auger electron emitters. When considering radiopharmaceutical half-lives, 131I and 177Lu
de-65
livered absorbed doses higher than 90Y. In view of real irradiation of MALCs, such a work may be useful
66
to select suited radionuclides and to help explain the biological effects. 67
1 Introduction 68
In targeted radionuclide therapy (TRT), a tumor-seeking agent is combined with an emitter of 69
short-range radiation, such as Auger electrons (typically inferior to 1 µm in water), α particles (inferior 70
to 100 µm) and β- particles (in the order of millimeters). The objective of this combination is to deliver
71
in patients a lethal absorbed dose to tumor cells while minimizing the exposure of healthy tissues. Thus, 72
the development and the evaluation of TRT requires small-scale dosimetry studies1,2. However, previous
73
studies have been generally based on simplifying assumptions (e.g. 3–8) owing to the lack of data at the
74
submillimeter scale regarding the tumor geometry and the radionuclide biodistribution. 75
Firstly, tumors were generally supposed spherical, or, alternatively, ellipsoidal. Absorbed dose 76
in spheres was found to be higher than in the ellipsoids of the same volume9, emphasizing the influence
77
of the geometry. Secondly, small-scale dosimetry calculations have regularly assumed a homogeneous 78
radionuclide biodistribution, either at the surface or within the volume of the tumor. In practice, the 79
targeting of a tumor is not homogeneous, partly due to the heterogeneous distribution of the receptors 80
(i.e. the antigens). Thus, mathematical models of heterogeneous radionuclide biodistributions within 81
the tumors have been studied10–13. As could be expected, these models led to absorbed doses
signifi-82
cantly less uniform within the tumor compared to homogeneous biodistributions. Therefore, given the 83
impact of both tumor geometry and radionuclide biodistribution, there are clear calls for the develop-84
ment of small-scale dosimetry based on realistic biological data. 85
In the context of radioimmunotherapy (RIT), a single in vitro cultured carcinoma cell was con-86
sidered in order to reproduce the effect of its realistic geometry and monoclonal antibody biodistribu-87
tion on the dosimetry14. These biological data were extracted from microscope images. Assuming
anti-88
body radiolabeling with iodine-125, the energy deposition in the cell was calculated with Monte Carlo 89
simulations. However, the relevance of this work was limited since tumors targeted in RIT such as non-90
Hodgkin lymphoma (NHL) grow as multicellular three-dimensional structures. Thus, a single cell dosi-91
metric model neglects the absorbed dose delivered by the radiopharmaceutical bound to other cells of 92
the tumor (crossfire effect). Furthermore, studies regarding unlabeled monoclonal antibody treatments 93
highlighted that the biodistribution might be impacted by the tumor size and the extracellular matrix 94
(i.e. the assemblage of non-cellular molecules providing structural support for the surrounding cells), 95
limiting the effectiveness of the treatment. Increasing tumor size is regarded as possibly reducing the 96
monoclonal antibody concentration and decreasing survival of a mouse model15 and patients16.
Further-97
more, the extracellular matrix might hamper the monoclonal antibody penetration17. To address these
98
questions, a three-dimensional in vitro culture system of follicular lymphoma (a NHL subtype) express-99
ing extracellular matrix was designed in a separate project at the Cancer Research Center of Toulouse18–
100
21. The model was termed multicellular aggregate of lymphoma cells (MALC). The MALCs were
incu-101
bated with rituximab. This chimeric monoclonal antibody targeting the membrane-associated CD20 an-102
tigen has been combined with radionuclides for RIT treatments (see clinical review of Read et al.22).
103
To improve the realism and the relevance of the single cell dosimetry, this paper presents a do-104
simetric model based on selective plane illumination microscopy (SPIM) images of three MALCs, of dif-105
ferent size, treated by rituximab. Data were extracted to define the tumor geometry and the radiophar-106
maceutical biodistribution. Rituximab was virtually radiolabeled with two types of electron emitters. 107
The Auger electron emitters iodine-125 (125I) and indium-111 (111In) were studied because they proved
108
their efficiency in destroying lymphoma cells in vitro in RIT-related research23,24. β- particle emitters
109
lutetium-177 (177Lu), iodine-131 (131I) and yttrium-90 (90Y) were also considered. For the RIT treatment
110
of patients with relapsed / refractory NHL, 177Lu-lilotomab satetraxetan is currently on trial25, while
111
both 131I-tositumomab (Bexxar) and 90Y-ibritumomab tiuxetan (Zevalin) have been used26. In RIT, the
112
dosimetry is highly impacted by the radiopharmaceutical effective half-life, a parameter that would de-113
pend on the rituximab radiolabeling. We studied the energy deposition patterns in MALCs with Monte 114
Carlo modeling of radiation transport. Additionally, the effective half-life was accounted for by using the 115
simulated data and a simple pharmacokinetic model. 116
As a first step, the relevance of implementing realistic biological data was highlighted by com-117
paring average absorbed doses to literature data. For the following step, to illustrate the possibilities 118
offered by this new dosimetric model, we compared the radionuclides’ absorbed fraction, average ab-119
sorbed dose and absorbed dose volume distribution. As a last step, the influence of the radiopharma-120
ceuticals half-life on the absorbed dose was studied. 121
2 Material and methods 122
2.1 Three-dimensional model of follicular lymphoma 123
The development of the MALCs as well as the microscopy acquisition were detailed in prior stud-124
ies18–21. This section focuses on information relevant to the present work.
125
2.1.1 MALC growth and labeling 126
To compare the antibody biodistribution in different tumor volumes, the MALCs, created with 127
follicular lymphoma cells expressing green fluorescent protein (GFP), were cultured during 2, 5 or 10 128
days (hereafter referred to as D2, D5 and D10). Then, they were treated by a saturating concentration 129
of 10 µg/ml of CF555 labeled rituximab27 for a duration of 24 h.
130
2.1.2 SPIM imaging 131
Fluorescence microscopy technologies, such as SPIM detect the light emitted by fluorescent 132
markers28. SPIM was particularly adapted to this study since it allows the observation of whole
organ-133
isms or three-dimensional multicellular models over a few millimeters while keeping a low phototoxi-134
city29,30. 24 h after rituximab administration, z-stack of images were acquired. Each image corresponded
135
to a slice of the MALC in the x-y plane. For example, Figure 1 displays a central slice of MALCs (a) D2, (b) 136
D5 and (c) D10. Green signal corresponds to GFP 488 nm emission and reveals MALC geometry. The 137
black hollow at the center of MALCs D5 and D10 are due to a lack of follicular lymphoma cells. Red signal 138
from the 561 nm emission of CF555 represents the rituximab biodistribution. To optimize the contrast 139
between follicular lymphoma cells and rituximab, the colors on the images differ from the real colors 140
produced by the fluorescent markers. SPIM images were composed of voxels with (x, y and z) dimen-141
sions of 3.7 · 3.7 · 3.1 µm3 and were stored into TIFF files.
(a) (b)
(c)
Figure 1. SPIM images of the central slices of the MALC: (a) D2, (b) D5 and (c) D10. Fol-licular lymphoma cell nuclei and rituximab appear in green and red, respectively. 2.2 Image processing
143
To extract the data required for the dosimetry of the MALCs, SPIM images were processed with 144
Fiji31 (“Fiji Is Just ImageJ”, downloadable from fiji.sc). This program has specific features for the
145
processing of microscope images of three-dimensional biological samples32 and can read TIFF files. First,
146
the stacks of images were transferred to Fiji for 3D reconstructions (e.g. MALC D5 in Figure 2). Then, 147
two macros were developed and implemented in Fiji: 148
- The first one treated the green signal in order to extract the MALCs geometry. MALC voxels 149
were separated from the background by applying an intensity threshold. A clear delineation of the 150
MALCs boundary allowed a straightforward determination of the threshold value. Since the black hollow 151
sections of the MALC D5 and D10 were in the center, they were considered as a part of the volume of 152
interest (VOI). Finally, in view of the definition of the MALC geometry during Monte Carlo simulations, 153
the macro recorded different information into a “.dat” file; namely, the number of voxels, the voxel di-154
mensions along the three axes, and each voxel coordinate (x, y, z). 155
- The second macro treated the red signal from the rituximab CF555 label. It removed the back-156
ground noise, then recorded the voxel coordinates and intensity into a “.dat” file. During simulations, 157
the source voxels were selected with a probability directly derived from their red signal intensity. It was 158
supposed that the CF555 biodistribution would be identical to the radiopharmaceutical. This assumes 159
that the CF555 labeling would neither detach from the antibody nor impact its biodistribution. To the 160
best of our knowledge, no publication addresses these questions. This also assumes that the radiolabel-161
ing would not affect the rituximab biodistribution. This last point is supported by the requirement that, 162
in nuclear medicine, the radiolabeling strategies preserve the biological properties of the proteins33 such
163
as rituximab. 164
165
Figure 2. 3D reconstruction of MALC D5 from SPIM images. The axes are given in millimeters.
166
2.3 Voxel-based dosimetry 167
2.3.1 General settings 168
Energy depositions were calculated with the Geant4 Monte Carlo open-source platform34–36
169
since it enables the implementation of voxelized geometries and its physics models are well adapted to 170
energies encountered in TRT. Furthermore, Geant4, being a well-established object-oriented code base, 171
has a high degree of reuse meaning that little code must be written for a new application. The Geant4 172
“microbeam” example served as a basis. It was developed at the Centre d’Études Nucléaires de Bor-173
deaux-Gradignan (CENBG) to simulate the irradiation of individual cells with a microbeam of protons 174
or α particles37,38. In order to suit this example for TRT, we added the possibility of simulating the
irra-175
diation of a VOI (in this work the MALC) by internalized radiopharmaceuticals. To reconstruct the 176
MALCs, the class G4PVParameterised placed the SPIM images voxels (3.7 · 3.7 · 3.1 µm3) according to
177
their coordinates stored in the output file of the first macro (see 2.2). The MALCs were positioned into 178
a sphere of liquid water. This enabled electron backscattering into the MALCs with the consequence of 179
an additional energy deposition. The simulation of the irradiation of each MALC by each radionuclide 180
considered 106 decays. The activity was assumed homogeneously biodistributed within a voxel source.
181
Accordingly, the coordinates of a decay site inside such a voxel were sampled from a uniform distribu-182
tion. The particles were then emitted isotropically. Depending on the type of electron emitter, energy 183
depositions in the MALCs were simulated with different methods that will be presented in the following 184
sections (2.3.2 and 2.3.3). 185
2.3.2 Auger electron emitters 186
125I and 111In mean emission spectra of monoenergetic electrons (Auger and internal conversion
187
electrons, Figure 3) and photons (X-rays and γ-rays) were extracted from the publication of the Ameri-188
can Association of Physicists in Medicine39 (AAPM), as it is still a reference for Auger electron emitters
189
(e.g. 14,40,41). Table 1 shows important properties of the decay of 125I and 111In. Half-lives were extracted
190
from the Medical Internal Radiation Dose (MIRD) book42. The mean penetration corresponds to the
191
length of the vector connecting the electron emission and stopping points. Hence, this distance is lower 192
than the path length because the latter considers the direction changes of the electrons. Although nu-193
clear medicine dosimetric studies usually report the path length, in the present work the penetration 194
was more relevant for analyzing the results. 195
196
Figure 3. Mean electron emission spectra (Auger and internal conversion electrons) of 125I and 111In from the
197
AAPM publication39. For each energy decade, the top x-axis provides the corresponding mean penetration
ac-198
cording to Geant4-DNA.
199 200
Table 1. Some physical properties of the Auger electron emitters. Half-lives come from MIRD data42, spectra data
201
were extracted from the AAPM publication39 and mean penetrations were determined with Geant4-DNA.
202
Auger electron emitter 125I 111In
Half-life (day) 59.4 2.8
Mean electron energy released (keV/decay) 19.5 34.7
Electron yield per decay 25.8 14.9
Electron mean energy Ee−
mean (keV) 0.8 2.3 Penetration at Ee− mean (mm) 2.5 · 10-5 1.4 · 10-4 Maximum energy Ee− max (keV) 34.7 245.0 Penetration at Ee− max (mm) 1.5 · 10-2 4.2 · 10-1 203
Auger electrons induce energy deposition clusters localized at the nanometer scale43. Such
phe-204
nomena can be studied with step-by-step Monte Carlo codes since they give the track structure of the 205
particles down to the nanometer scale. Accordingly, 125I and 111In emissions were simulated with
206
Geant4-DNA44–47 (geant4-dna.org). “CPA100” physics models (“option 6”)48,49 were used. They describe
207
ionization, electronic excitation and elastic scattering processes and are applicable from 256 keV down 208
to 11 eV in liquid water. 209
For the simulations of photon interactions (Compton and Rayleigh scatterings as well as photo-210
electric absorption), Geant4-DNA does not provide any physics models to-date. Thus, Geant4 “Liver-211
more” physics models for photons were selected50,51. During simulations, electrons and photons could
212
produce vacancies in the atomic shells so atomic deexcitation emission was tracked (Auger electron 213
emission, Auger cascade and fluorescence). 214
2.3.3 β- particle emitters
215
AAPM’s publication39 only provides data for Auger electron emitters. Therefore, 177Lu, 131I and
216
90Y mean emission spectra of β- particles (Figure 4), monoenergetic electrons and photons were
ex-217
tracted from the MIRD book42. Table 2 presents the main properties of the decay of 177Lu, 131I and 90Y.
218
219
Figure 4. β- particle emission spectra of 177Lu, 131I and 90Y from MIRD book42. The top x-axis provides the
corre-220
sponding Geant4 mean penetration every 500 keV.
221 222
Table 2. Some physical properties of the β- particle emitters. Half-lives and spectra data come from MIRD book42
223
and mean penetrations were determined with Geant4.
224
β- particle emitter 177Lu 131I 90Y
Half-life (day) 6.6 8.0 2.7
Mean electron energy (β- particles +
monoenergetic electrons) released (keV/decay)
147.8 191.7 933.2
β- particle mean energy E
β−mean (keV) 133.1 181.8 933.0
Penetration at Eβ−
mean (mm) 1.6 · 10-1 2.6 · 10-1 2.9
β- particle maximum energy E β− max (keV) 497.8 806.9 2280.1 Penetration at Eβ− max (mm) 1.2 2.4 8.4 225
Part of the emission of 177Lu, 131I and 90Y has an energy too high to be modeled with Geant4-DNA
226
physics models. Thus, simulations of the irradiation with these emitters were accomplished with Geant4 227
in a condensed history mode, as this provides physics models applicable up to GeV energies. “Liver-228
more”52,53 physics models were used to describe particles interactions.
229
The ionization process was simulated along with bremsstrahlung. This latter slightly increased 230
the stopping power of the electrons / β- particles at these energies, thus marginally reducing their
pen-231
etration. “Livermore” electron models are defined down to about 10 eV. Nevertheless, in accordance 232
with guidelines, the cut-off was set to 250 eV. Energy production cuts for secondary particles was also 233
fixed at 250 eV. In order to limit the number of electrons crossing a voxel with no energy deposition, 234
step size limit was arbitrary chosen to 0.6 µm, corresponding to less than 1/5 of the voxel dimensions. 235
2.4 Dosimetric quantities 236
2.4.1 Simulation results 237
Geant4 simulations generated output files containing the energy deposited in the MALCs voxels. 238
Firstly, different dosimetric quantities were directly calculated from these data: the absorbed fraction 239
and the absorbed dose. 240
- The absorbed fraction ϕ represents the fraction of energy released from the source region that 241
is deposited in the target region. Here, the MALCs represent both the source and the target regions. The 242
results focused on electron absorbed fractions ϕe− (monoenergetic electrons and eventually β-
parti-243
cles), because photon absorbed fractions are insignificant at this scale: 244 ϕe−MALC= Ee− Ee− 0 (1) Where Ee− is the deposited energy and Ee−
0 the electron-released energy. The absorbed fraction
245
is frequently reported in nuclear medicine dosimetry studies54.
246
- The energy deposited Ei (in J) in a VOI i (either a whole MALC or a voxel) characterized by a 247
mass mi (in kg) was converted to absorbed dose Di (in Gy): 248
Di=
Ei
mi
(2) This quantity was then divided by 106 to obtain the mean absorbed dose per decay (or per unit
249
of time-integrated activity, in Bq · s, according to MIRD most recent terminology55). First, this quantity
250
was determined for the whole MALCs. However, the absorbed dose was not uniformly delivered within 251
the volume. In order to specify the volume fractions having received either low or high absorbed dose, 252
cumulative dose-volume histograms (cDVH) were plotted. They give the fraction of the volume (i.e. the 253
fraction of MALC voxels) in which an absorbed dose greater than or equal to a given value was delivered. 254
These graphs are routinely used in external radiotherapy, but also in some TRT studies56,57.
255
2.4.2 Considering radiopharmaceutical effective half-life 256
Subsequently, in order to consider the effective half-life of the radiopharmaceutical X-rituximab 257
(X being one of the radionuclides), the MALCs and voxels absorbed doses per unit administered activity 258
(A0 in Bq) were calculated. In nuclear medicine, this quantity allows the assessment of the absorbed
259
dose delivered to a VOI for a given administered activity. It was calculated as the product of the absorbed 260
doses per decay (see 2.4.1) and the time-integrated activity coefficient ã (also known as the residence 261
time and given in s). The value of ã represents the total number of decays occurring in a MALC per unit 262
administered activity55:
ã = 1 A0 ∫ A(X − rituximab, t) · dt ∞ 0 (3) Where A(X − rituximab, t) is the time-dependent activity of the radiopharmaceutical in a MALC 264
(in Bq). Assuming that this radiopharmaceutical has an instantaneous uptake in a MALC (i.e. instanta-265
neously bound to the MALCs according to the biodistribution extracted from the images) and its elimi-266 nation is monoexponential: 267 ã = 1 A0 ∫ A0· e−(ln(2) T⁄ eff(X−rituximab))·t ∞ 0 · dt (4)
ã = 1.443 · Teff(X − rituximab) (5)
268
Where Teff(X − rituximab), the effective half-life of the radiopharmaceutical (in s), depends on Tphys(X)
269
the physical half-life of the radionuclide X (in s) and on Tbio(rituximab) the biological half-life of rituxi-270
mab (in s): 271
Teff(X − rituximab) =
Tphys(X) · Tbio(rituximab)
Tphys(X) + Tbio(rituximab)
(6) 272
The physical half-lives are well documented (see Table 1 and Table 2), but, rituximab biological 273
life in NHL is less-well established. In a clinical study, Scheidhauer et al. evaluated the effective half-274
life of the radiopharmaceutical 131I-rituximab in NHL58. Biodistribution in 14 patients was determined
275
by gamma camera imaging. Our work focused on the 3.4 days mean effective half-life determined by 276
Scheidhauer et al. We emphasize, however, that its precision is limited. It is associated to a standard 277
deviation of 1.1 day. Also, Scheidhauer et al. reported a high inter-patient variability, with effective half-278
lives ranging from 1.7 to 5.5 days. The gamma camera imaging introduces further uncertainties on the 279
dosimetry59-60. According to equation (6), the 3.4 days effective half-life corresponds to a rituximab
bio-280
logical half-life of 5.8 days. Using this value and the equation (6), the effective half-lives of rituximab 281
radiolabeled with 125I, 111In, 177Lu or 90Y were deducted.
3 Results 283
3.1 MALC and rituximab biodistribution characteristics 284
Table 3 presents the dimensions of the three MALCs along x-, y-, z- axes and their masses in 285
Geant4 simulations which were used to determine the absorbed doses according to equation (2). The 286
masses were evaluated by multiplying the number of voxels in a MALC by the mass of a voxel filled with 287
liquid water (as simulations were performed in this material). Figure 1 shows that MALCs considered 288
in this study have ellipsoid-like shape. For MALC D2, D5 and D10, major radii are ~0.25 mm, ~0.5 mm 289
and ~1.3 mm, respectively. Rituximab is heterogeneously biodistributed inside a shell-like volume at 290
the periphery of the MALCs (Figure 1). Generally, the shell-like volumes are characterized by a thickness 291
and a distance to the surface of the MALCs both of the order of a few hundredths of a millimeter. It was 292
previously demonstrated that the extracellular matrix limits the diffusion of therapeutic agents in tu-293
mors17. It was also shown that MALCs expressed extracellular matrix proteins20. Accordingly, in an
on-294
going MALC-based study, the possibility that the rituximab peripheral location is due to the extracellular 295
matrix is being investigated. 296
Table 3. Sizes along x-, y- and z-axes of the MALCs D2, D5 and D10.
297
MALC Dimensions x · y · z (mm3) Mass (mg)
D2 0.34 · 0.53 · 0.50 4.6 · 10−2
D5 0.96 · 1.09 · 1.07 5.5 · 10−1
D10 2.54 · 1.23 · 2.26 2.8
3.2 Dosimetric quantities per decay 298
3.2.1 Comparison with literature data obtained in a simplified model 299
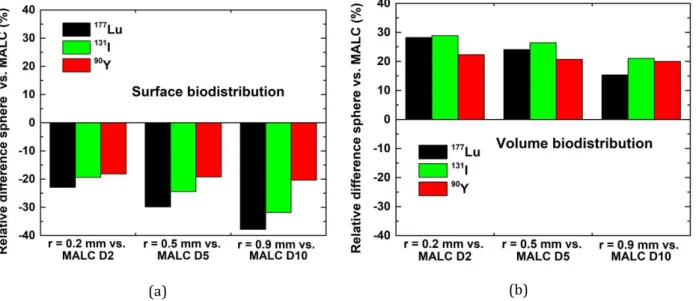
Figure 5 displays the relative difference (%) of absorbed dose per decay between the reference 300
data of Bardiès and Chatal3 for spheres with either (a) a surface or (b) a volume biodistribution and
301
MALCs calculations (relative difference = 100 · (Dsphere – DMALC) / DMALC). In this previous study,
calcula-302
tions were carried out by an analytical method based on scaled dose-point kernels in spheres with ra-303
dius ranging from 0.01 to 22 mm. For a valid comparison, the results for a MALC were compared to the 304
results of the sphere having the closest mass. Accordingly, absorbed doses for MALCs D2, D5 and D10 305
were compared to the values for spheres with radius, r, of 0.2 mm, 0.5 mm and 0.9 mm, respectively. 306
Furthermore, only 177Lu, 131I and 90Y were considered because Bardiès and Chatal focused their study
307
on β- particle emitters. The peripheral biodistribution of rituximab (discussed in section 3.1) can be seen
308
as an intermediate between the surface and volume biodistributions assumed by Bardiès and Chatal. 309
Hence, this is coherent that the absorbed doses per decay for MALCs lie between the values for these 310
two theoretical situations. It is also noticeable that results with these two biodistributions own a similar 311
degree of agreement with results for the MALCs. This indicates that for the purpose of absorbed dose 312
calculations, in these particular cases, the surface and the volume biodistribution are both equally rele-313
vant. Furthermore, non-negligible discrepancies between the theoretical model and realistic data were 314
observed. These results highlight the need to account of realistic biological data. 315
(a) (b)
Figure 5. Relative differences (%) between absorbed dose per decay calculated in spheres of various radii with
316
either a (a) surface or (b) a volume biodistribution3 and MALCs (taken as reference). Comparison spheres vs.
317
MALCs are as follow: r = 0.2 mm vs. MALC D2 (left), r = 0.5 mm vs. MALC D5 (middle) and r = 0.9 mm vs. MALC
318
D10 (right).
319 320
3.2.2 Comparison of the radionuclides 321
For clarity, the results for each radionuclide are reported by ascending order of energy released 322
per decay, that is: 125I, 111In, 177Lu, 131I and 90Y.
323
Figure 6 displays, for each radionuclide, the electron absorbed fraction in the MALCs and Table 324
4 shows the corresponding numerical values. As MALCs get bigger, the electrons / β- particles deposit
more energy inside before exiting them, increasing the absorbed fractions. Assuming a homogeneous 326
surface biodistribution of rituximab (which is at first sight the closer approximation of the real biodis-327
tribution as seen on Figure 1), for very large MALCs the absorbed fraction would tend toward 0.5 (semi-328
infinite medium condition). However, for MALC D5 and D10, the values become greater than 0.5 for all 329
radionuclides but 90Y (presumably, absorbed fraction of 90Y would become greater than 0.5 in bigger
330
MALCs). This can be explained by the rituximab penetration inside the MALCs, enabling the electrons / 331
β- particles to systematically deposit energy in the VOI, regardless their trajectories. This point is critical
332
since it further demonstrates the importance of using realistic biological data. 333
334
Figure 6. Absorbed fractions in MALCs D2, D5 and D10 for 125I, 111In, 177Lu, 131I and 90Y.
335 336
Table 4. Absorbed fraction in the MALCs for the five radionuclides.
337
Absorbed fraction
Radionuclide MALC D2 MALC D5 MALC D10
125I 1.00 1.00 1.00 111In 0.55 0.67 0.74 177Lu 0.49 0.62 0.71 131I 0.32 0.46 0.57 90Y 0.04 0.07 0.12 338
As radionuclides release more energy per decay, the penetration of the electrons / β- particles
339
increase (see Table 1 and Table 2). Thus, more energy is deposited outside the MALCs, and in turn the 340
absorbed fractions decrease. 125I deposits nearly its whole electron energy within the three MALCs. The
341
electrons it emits are unlikely to deposit energy outside the MALCs since their penetrations are limited 342
to 1.5 ·10-2 mm while the rituximab is mostly located at more than ~3 ·10-2 mm from the edge. Note that
343
the real values are inferior to 0.998 (rounded to 1.00 for consistency), due to scarce rituximab biodis-344
tribution closer to or at the surface. The absorbed fractions for 111In, lying between 0.55 and 0.74, are
345
notably lower than that of 125I. The reason is that ~80% of the electron energy released per decay of
346
111In is taken away by emissions of at least 145.0 keV, characterized by penetrations above 1.8 ·10-1 mm
347
(right-hand side of Figure 3). Due to this property, the absorbed fractions for 111In are remarkably close
348
to 177Lu, as their emissions have similar penetrations. Furthermore, the absorbed fractions for 131I are
349
higher than for 177Lu as its penetration are higher (by 1.0 ·10-1 mm at 𝐸
β−𝑚𝑒𝑎𝑛). Finally, the absorbed
350
fractions for 90Y, ranging between 0.04 and 0.12, are by far the lowest. Such low values are due to the
351
penetrations of its emissions (up to 8.4 mm) being significantly superior to the size of the MALCs. 352
Figure 7 displays the mean absorbed dose per decay delivered to the MALCs by each radionu-353
clide and Table 5 shows the corresponding numerical values. These results are impacted by the energy 354
released by the radionuclides and the absorbed fractions. 355
356
Figure 7. Mean absorbed dose per decay in MALC D2, D5 and D10 for 125I, 111In, 177Lu, 131I and 90Y.
357 358
359
Table 5. Mean absorbed dose per decay in the MALCs for the five radionuclides.
360
Mean absorbed dose per decay (µGy · Bq-1 · s-1)
Radionuclide MALC D2 MALC D5 MALC D10
125I 6.78 · 10−2 5.69 · 10−3 1.10 · 10−3 111In 6.26 · 10−2 6.41 · 10−3 1.37 · 10−3 177Lu 2.27 · 10−1 2.41 · 10−2 5.34 · 10−3 131I 2.01 · 10−1 2.46 · 10−2 5.84 · 10−3 90Y 1.21 · 10−1 1.98 · 10−2 6.15 · 10−3 361
Despite 111In (34.7 keV/decay) releasing more energy than 125I (19.5 keV/decay), the former
de-362
livered a lower absorbed dose in MALC D2 due to its lower absorbed fraction. Nevertheless, for MALC 363
D5 and D10, the absorbed fraction for 111In increases, leading to greater absorbed doses than for 125I.
364
In each MALC, absorbed doses for β- particle emitters are greater than for Auger electron
emit-365
ters, because they release considerably more energy. For example, absorbed doses for 177Lu are greater
366
than that of 111In by a factor ~4. Both have similar absorbed fractions, but 177Lu (147.8 keV/decay)
re-367
leases ~4 times more energy. For β- particle emitters, 177Lu and 131I (191.7 keV/decay) results are close.
368
Lower energy released by 177Lu, is compensated by its higher absorbed fractions. Among β- particle
369
emitters, 90Y (933.2 keV/decay) emits by far the more energy, yet the absorbed doses delivered are
low-370
est in MALCs D2 and D5 due to extremely low absorbed fractions. In MALC D10, however, it delivered 371
the highest absorbed doses because, compared to MALC D2, absorbed fractions were increased by a 372
factor 3. 373
Figure 8 illustrates, as an example the distributions of the absorbed dose per decay (in µGy·Bq
-374
1·s-1) inside the voxels of the slice of MALC D5 shown in Figure 1 (b). Note that 0.01 µGy·Bq-1·s-1
corre-375
sponds to a mean energy deposited per decay inside a voxel of 2.6 · 10-3 eV·Bq-1·s-1. Figure 9 displays the
376
cDVH (in µGy·Bq-1·s-1) of MALCs (a) D2, (b) D5 and (c) D10 for 125I, 111In, 177Lu, 131I and 90Y. Globally,
377
when radionuclides release more energy, the absorbed dose is delivered more uniformly within the 378
MALCs because of the increasing penetration of the emission. 379
Figure 8 (b) highlights the peripheral irradiation of 125I, with a pattern very similar to the
ritux-380
imab biodistribution. However, this radionuclide delivered high absorbed dose as revealed by the less-381
steep gradient of its cDVH. These observations are consistent with 125I emitting low energy electrons,
382
which deposit most of the energy in a small distance from the decay site. The highly localized absorbed 383
dose delivered by 125I was further observed at the cellular level by Arnaud et al.14. Unlike this
radionu-384
clide, 111In sparsely delivered absorbed dose in the central part of the MALCs (Figure 8 (c)) due to the
385
higher penetrations of its emission. For both Auger electron emitters, the low absorbed dose delivered 386
in the central part of the MALCs (or the lack thereof) is linked to the rituximab peripheral biodistribu-387
tion. Nevertheless, the limited penetration of rituximab inside the MALCs can be counterbalanced by a 388
radiolabeling with one of the β- particle emitters.
389
This benefit, illustrated by Figure 8 (d), (e) and (f), was brought by the higher penetration of 390
their emission. It translates to higher cDVH values on the left-hand side (Figure 9). Among β- particle
391
emitters, 90Y energy deposition was the most uniform throughout the MALCs. In comparison, 177Lu and
392
131I deposited less energy in the central part but more in the periphery. The improved absorbed dose
393
uniformity of 90Y is further expressed by steeper gradients in its cDVH. It is linked to the variation of
394
penetration and stopping power of β- particles with their energy. β- particles emitted by 90Yhaving
395
higher penetrations than for 177Lu and 131I, were more likely to reach the center of the MALCs. This
dif-396
ference is more pronounced as MALCs get bigger. Compared to 177Lu and 131I, emissions of 90Y have lower
397
stopping powers (according to NIST database61, at 𝐸
β−𝑚𝑒𝑎𝑛: 0.34, 0.29 and 0.19 keV/µm, respectively),
398
thus they deposited less energy close to the decay site. 399
(a) (b) (c)
(d) (e) (f)
Figure 8. Absorbed dose per decay (µGy·Bq-1·s-1) delivered to the voxel of the slice of MALC D5 shown in Figure 1
400
(b), for (b) 125I, (c) 111In, (d) 177Lu, (e) 131I and (f) 90Y. The corresponding color scale is displayed in (a).
(a) (b)
(c)
Figure 9. cDVH of MALC (a) D2, (b) D5 and (c) D10 per decay for 125I, 111In, 177Lu, 131I and 90Y.
402 403
3.3 Absorbed dose per unit administered activity 404
The influence of the radiolabeled rituximab effective half-life on the absorbed dose is presented. 405
Table 6 summarizes the effective half-lives for radiolabeling with 125I, 111In, 177Lu, 131I or 90Y as calculated
406
from equation (6). The differences between the physical half-lives of the radionuclides were decreased 407
by the introduction of the biological half-life of the rituximab (5.8 days). 408
Table 6. Effective half-lives of rituximab radiolabeled with one of the five radionuclides in NHL, determined with
409
equation (6).
410
Radionuclide X Effective half-life of X-rituximab (day)
125I 5.3 111In 1.9 177Lu 3.1 131I 3.4 90Y 1.8 411
For each radionuclide, Figure 10 displays the mean absorbed dose per unit administered activity 412
within the MALCs and Table 7 shows the corresponding numerical values. Regarding Auger electron 413
emitters, the effective half-life of 125I-rituximab was 2.8 times higher than 111In-rituximab. Therefore,
414
despite lower absorbed dose delivered per decay in MALC D5 and D10, 125I delivered more absorbed
415
dose per unit administered activity than 111In. For β- particle emitters, the effective half-life of 177
Lu-416
rituximab and 131I-rituximab were 1.7 and 1.9 times greater than that of 90Y-rituximab. As a result,
ab-417
sorbed dose per unit administered activity for 177Lu and 131I were more than 3 times higher in MALC D2
418
and more than 2 times higher in MALC D5 than that of 90Y. Furthermore, in MALC D10, despite higher
419
absorbed dose per decay, 90Y delivered less absorbed dose per unit administered activity than 177Lu and
420
131I. As discussed by Scheidhauer et al.58, the relatively long biological half-life of rituximab (5.8 days in
421
NHL) is best matched by 131I physical half-life (8.0 days) than by 90Y short physical half-life (2.7 days).
422
177Lu physical half-life of 6.6 days is also well adapted to the rituximab biological half-life.
424
Figure 10. Mean absorbed dose per unit administered activity to MALCs D2, D5 and D10 for 125I, 111In, 177Lu, 131I
425
and 90Y.
426 427
Table 7. Mean absorbed dose per unit administered activity to the MALCs for the five radionuclides.
428
Mean absorbed dose per unit administered activity (cGy · Bq-1)
Radionuclide MALC D2 MALC D5 MALC D10
125I 4.50 3.78 · 10−1 7.27 · 10−2 111In 1.48 1.51 · 10−1 3.23 · 10−2 177Lu 8.76 9.33 · 10−1 2.06 · 10−1 131I 8.45 1.04 2.46 · 10−1 90Y 2.78 4.56 · 10−1 1.42 · 10−1 429
Figure 11 illustrates, as an example the isodoses (in cGy·Bq-1) inside the voxels of the slice of
430
MALC D5 shown by Figure 1 (b). Only the β- particle emitters were represented since the absorbed dose
431
distribution of Auger electron emitters were very heterogeneous and did not allow for a clear represen-432
tation of isodoses. Figure 12 shows the cDVH of MALC (a) D2, (b) D5 and (c) D10 per unit administered 433
activity for 125I, 111In, 177Lu, 131I and 90Y.
434
When the effective half-life of radiolabeled rituximab increases, the absorbed doses per admin-435
istered activity increase. As a consequence, the region covered by high absorbed dose is largest for 131I
436
and smallest for 90Y as illustrated by the isodoses (Figure 11). Furthermore, the higher the effective
life, the greater the shift of the cDVH curves toward higher absorbed doses. Accordingly, in the region of 438
high absorbed doses, cDVH values of 125I become significantly higher than that of 111In. In this region,
439
cDVH values of 177Lu and 131I are noticeably higher than those of 90Y.
440
(a) (b)
(c) (d)
Figure 11. Isodose distributions in the slice of MALC D5 shown in Figure 1 (b), per unit administered activity of
441
(b) 177Lu, (c) 131I and (d) 90Y (cGy·Bq-1). The corresponding color scale is displayed in (a).
442 443
(a) (b)
(c)
Figure 12. cDVH per unit administered activity of MALC (a) D2, (b) D5 and (c) D10 for 125I, 111In, 177Lu, 131I and
444
90Y.
445
3.4 Discussion 446
Our methodology allowed the observation of the absorbed dose in an in vitro tumor model which 447
is more realistic than the spherical tumor with uniform biodistribution simplification. It is recognized, 448
however, that the realism of this work is limited with respect to clinical context. It is therefore essential 449
to review the degree of relevance of the biological and physical aspects of this work. 450
The present study focused on three MALCs with dimensions of the order of millimeter. On one 451
hand, such a sample did not reproduce the diversity of tumor geometry and rituximab pharmacokinetics 452
in patients, which are critical for dosimetry. For example, in clinical routine, the size of the diagnosed 453
follicular lymphomas ranges from a few millimeters to several centimeters62. Additionally, multiple
454
studies have highlighted the need for dosimetry in smaller follicular lymphomas (down to ~10 µm)63-65.
455
Our study did not extend to the biggest and the smallest of the follicular lymphomas. It is expected that, 456
with the increasing / decreasing size of the tumor model, radionuclides with higher (e.g. 90Y) / lower
(e.g. 125I) penetration emissions, would become more favored from a dosimetric perspective. On the
458
other hand, previous studies have highlighted the ability of three-dimensional aggregates to mimic the 459
physiological in vivo aspects of tumors, enabling the identification of new targets and drugs66-68. In
par-460
ticular, this tool has long been recognized as very effective to characterize the penetration of antibod-461
ies69-70. These previous works give confidence in the clinical relevance of the rituximab peripheral
dis-462
tribution in the MALCs, a key point of the present study. 463
The accurate Monte Carlo tracking of the radionuclide emissions in the MALCs relied largely on 464
the choice of the physics models. Geant4-DNA provides two sets of physics models able to entirely sim-465
ulate the electron emissions of 125I and 111In: the default (“option 2”) and the CPA100 (“option 6”) sets.
466
The latter set was selected following two main arguments. Differential cross sections for ionization and 467
cross section for electronic excitation of “option 6” are in better agreement than that of “option 2” with 468
experimental data. Furthermore, for low energy electrons, dose-point kernels generated by “option 2” 469
are considered unrealistic because they are very diffusive71, while those calculated by “option 6” are less
470
so72. Concerning β- particle emitters, “Livermore” were considered more relevant than
“PENELOPE-471
2008”73 electron physics models based on two arguments. Firstly, to be in accordance with Geant4-DNA
472
“option 6”, the simulations were realized in liquid water. For this material, “Livermore” ionization cross 473
sections are in better agreement with experimental data36. Secondly, regarding deexcitation processes,
474
“Livermore” simulates every atomic shell, while “PENELOPE-2008” only takes into account K, L and M 475
shells73.
476
Monte Carlo simulations were informed with data from one SPIM acquisition, showing biodis-477
tribution in MALCs after 24 h of incubation. To approximate the time-dependent activity in the MALCs, 478
we used the straightforward assumptions of a radiopharmaceutical instantaneous uptake and monoex-479
ponential elimination. In clinical studies, a more detailed description of the uptake and elimination is 480
provided. Typically, 3 to 4 SPECT or PET acquisitions are performed, the first a few hours and the last 481
between a few tenth of hours and nearly 200 h after administration25,56,74-75. Generally, these data are
482
fitted by a mono/biexponential function. The instantaneous uptake does not account for the decays oc-483
curring outside the tumor during the uptake in a clinical context. Hence, the absorbed dose to the tumor 484
delivered by radionuclides with short half-lives, such as 111In and 90Y, is overestimated compared to
485
those with longer half-live. We note, however, that SPECT acquisitions of mice and patients showed early 486
uptake of rituximab in NHL76-77 (a few hours after administration while 111In and 90Y physical half-lives
487
are ~2 days). Regarding the elimination of the rituximab in NHL, no data were found in the literature. 488
Implementation of more sophisticated pharmacokinetic models in our methodology would be an im-489
portant next step for a more relevant dosimetry. Ideally, these models should consider rituximab data 490
in patients’ NHL, upon availability. 491
4 Conclusion 492
We have developed a Monte Carlo dosimetric model based on realistic NHL geometry and ritux-493
imab biodistribution. It was employed to describe the absorbed dose that would be delivered at the 494
microscopic scale by Auger electron emitters (125I and 111In) and β- particle emitters (177Lu, 131I and 90Y)
495
in the context of RIT. 496
A comparison between the mean absorbed dose per decay for realistic geometry and biodistri-497
bution with literature data for a sphere with either a surface or a volume biodistribution demonstrated 498
significant differences. Then, for the five radionuclides, the absorbed fractions, the mean absorbed dose 499
and its associated distribution were compared. This comparison further highlighted the importance of 500
both the realistic MALC geometry and rituximab biodistribution as they often impacted the outcomes. 501
Aside from these two parameters, the decay properties - the electron / β- particle energy
re-502
leased per decay and penetration - had an important impact. The uniformity of the absorbed dose deliv-503
ered throughout the MALCs increased for radionuclides releasing more energy per decay (in ascending 504
order: 125I, 111In, 177Lu, 131I and 90Y). The mean absorbed dose of β- particle emitters was higher than that
505
of Auger electron emitters. 177Lu and 131I mean absorbed doses and were higher than 90Y in the two
506
smallest MALCs. Furthermore, when considering the radiolabeled rituximab effective half-life, the ab-507
sorbed dose for 177Lu and 131I remained close to each other and considerably greater than that of 90Y in
508
the three MALCs. 509
The methodology developed may be applied to various situations of TRT. Voxelized images of 510
others tumoral / healthy tissue models and tumor-seeking agents can be considered. It is possible to 511
simulate the emission of other radionuclides of interest such as potential theranostic Auger electron 512
emitters (e.g. copper-6474, useful for PET imaging) and β- particle emitters (e.g. terbium-16178-79, useful
513
for SPECT imaging) or therapeutic α particle emitters (e.g. actinium-22580-81). To further improve the
514
realism of the simulations, future work may integrate the temporal variation of the vector biodistribu-515
tion and the growth of MALC. Such work could be useful in the case of real irradiation experiment to 516
select relevant radionuclides and assess biological effects. 517
5 References 518
1. Strand SE, Jönsson BA, Ljungberg M, Tennvall J. Radioimmunotherapy dosimetry-a review. Acta 519
Oncol. 1993;32(7-8):807-817. doi:10.3109/02841869309096140
520
2. Roeske JC, Aydogan B, Bardiès M, Humm JL. Small-scale dosimetry: challenges and future 521
directions. Semin Nucl Med. 2008;38(5):367-383. doi:10.1053/j.semnuclmed.2008.05.003 522
3. Bardiès M, Chatal JF. Absorbed doses for internal radiotherapy from 22 beta-emitting 523
radionuclides: beta dosimetry of small spheres. Phys Med Biol. 1994;39(6):961-981. 524
doi:10.1088/0031-9155/39/6/004 525
4. Falzone N, Fernández-Varea JM, Flux G, Vallis KA. Monte Carlo evaluation of Auger electron-526
emitting theragnostic radionuclides. J Nucl Med. 2015;56(9):1441-1446. 527
doi:10.2967/jnumed.114.153502 528
5. Champion C, Quinto MA, Morgat C, Zanotti-Fregonara P, Hindié E. Comparison between three 529
promising β-emitting radionuclides, 67Cu, 47Sc and 161Tb, with emphasis on doses delivered to
530
minimal residual disease. Theranostics. 2016;6(10):1611-1618. doi:10.7150/thno.15132 531
6. Hindié E, Zanotti-Fregonara P, Quinto MA, Morgat C, Champion C. Dose deposits from 90Y, 177Lu,
532
111In, and 161Tb in micrometastases of various sizes: implications for radiopharmaceutical therapy.
533
J Nucl Med. 2016;57(5):759-764. doi:10.2967/jnumed.115.170423
534
7. Amato E, Italiano A, Baldari S. An analytical model to calculate absorbed fractions for internal 535
dosimetry with alpha, beta and gamma emitters. Pericol Classe Sci Fis Mat Nat. 2014;92(1):A1. 536
doi:10.1478/AAPP.921A1 537
8. Amato E, Lizio D, Baldari S. Absorbed fractions for electrons in ellipsoidal volumes. Phys Med Biol. 538
2011;56(2):357-365. doi:10.1088/0031-9155/56/2/005 539
9. Rahman Z, Mirza SM, Arshed W, Mirza NM, Ahmed W. Influence of thyroid volume reduction on 540
absorbed dose in 131I therapy studied by using Geant4 Monte Carlo simulation. Chin Phys C.
541
2014;38(87):056201. doi:10.1088/1674-1137/38/5/056201 542
10. Bao A, Zhao X, Phillips WT, et al. Theoretical study of the influence of a heterogeneous activity 543
distribution on intratumoral absorbed dose distribution. Med Phys. 2005;32(1):200-208. 544
doi:10.1118/1.1833151 545
11. Spaic R, Ilic R, Dragovic M, Petrovic B. Generation of dose-volume histograms using Monte Carlo 546
simulations on a multicellular model in radionuclide therapy. Cancer Biother Radio. 547
2005;20(3):320-324. doi:10.1089/cbr.2005.20.320 548
12. Uusijärvi H, Bernhardt P, Forssell-Aronsson E. Tumour control probability (TCP) for non-uniform 549
activity distribution in radionuclide therapy. Phys Med Biol. 2008;53(16):4369-4381. 550
doi:10.1088/0031-9155/53/16/010 551
13. Howell RW , Rajon D, Bolch BE. Monte Carlo simulation of irradiation and killing in three-552
dimensional cell-populations with lognormal cellular uptake of radioactivity. Int J Radiat Biol. 553
2012;88(1-2):115-122. doi:10.3109/09553002.2011.602379 554
14. Arnaud FX, Paillas S, Pouget JP, Incerti S, Bardiès M, Bordage MC. Complex cell geometry and 555
sources distribution model for Monte Carlo single cell dosimetry with iodine 125 556
radioimmunotherapy. Nucl Instrum Methods Phys Res B. 2016;366:227-233. 557
doi:10.1016/j.nimb.2015.11.008 558
15. Daydé D, Ternant D, Ohresser M, et al. Tumor burden influences exposure and response to 559
rituximab: pharmacokinetic-pharmacodynamic modeling using a syngeneic bioluminescent 560
murine model expressing human CD20. Blood. 2009;113(16):3765-3772. doi:10.1182/blood-561
2008-08-175125 562
16. Meignan M, Cottereau AS, Versari A, et al. Baseline metabolic tumor volume predicts outcome in 563
high-tumor-burden follicular lymphoma: a pooled analysis of three multicenter studies. J Clin 564
Oncol. 2016;34(30):3618-3626. doi:10.1200/JCO.2016.66.9440
565
17. Netti PA, Berk DA, Swartz MA, Grodzinsky AJ, Jain RK. Role of extracellular matrix assembly in 566
interstitial transport in solid tumors. Cancer Res. 2000;60(9):2497-2503. 567
18. Gravelle P, Jean C, Valleron W, Laurent G, Fournié JJ. Innate predisposition to immune escape in 568
follicular lymphoma cells. Oncoimmunology. 2012;1(4):555-556. doi:10.4161/onci.19365 569
19. Gravelle P, Jean C, Familiades J, et al. Cell growth in aggregates determines gene expression, 570
proliferation, survival, chemoresistance, and sensitivity to immune effectors in follicular 571
lymphoma. Am J Pathol. 2014;184(1):282-295. doi:10.1016/j.ajpath.2013.09.018 572
20. Decaup E, Jean C, Laurent C, et al. Anti-tumor activity of obinutuzumab and rituximab in a follicular 573
lymphoma 3D model. Blood Cancer J. 2013;3(8):e131. doi:10.1038/bcj.2013.32 574
21. Rossi C, Gravelle P, Decaup E, et al. Boosting γδ T cell-mediated antibody-dependent cellular 575
cytotoxicity by PD-1 blockade in follicular lymphoma. Oncoimmunology. 2019;8(3):1554175. 576
doi:10.1080/2162402X.2018.1554175 577
22. Read ED, Eu P, Little PJ, Piva TJ. The status of radioimmunotherapy in CD20+ non-Hodgkin’s 578
lymphoma. Target Oncol. 2015;10(1):15-26. doi:10.1007/s11523-014-0324-y 579
23. Griffiths GL, Govindan SV, Sgouros G, Ong GL, Goldenberg DM, Mattes MJ. Cytotoxicity with Auger 580
electron-emitting radionuclides delivered by antibodies. Int J Cancer. 1999;81(6):985-992. 581
doi:10.1002/(SICI)1097-0215(19990611)81:6<985::AID-IJC23>3.0.CO;2-W 582
24. Ong GL, Elsamra SE, Goldenberg DM, Mattes MJ. Single-cell cytotoxicity with radiolabeled 583
antibodies. Clin Cancer Res. 2001;7(1):192-201. 584
25. Blakkisrud J, Løndalen A, Martinsen ACT, et al. Tumor-absorbed dose for non-Hodgkin lymphoma 585
patients treated with the anti-CD37 antibody radionuclide conjugate 177Lu-lilotomab satetraxetan.
586
J Nucl Med. 2017;58(1):48-54. doi:10.2967/jnumed.116.173922
587
26. Goldsmith SJ. Radioimmunotherapy of lymphoma: Bexxar and Zevalin. Semin Nucl Med. 588
2010;40(2):122-135. doi:10.1053/j.semnuclmed.2009.11.002 589
27. Bezombes C, Grazide S, Garret C, et al. Rituximab antiproliferative effect in B-lymphoma cells is 590
associated with acid-sphingomyelinase activation in raft micodomains. Blood. 2004;104(4):1166-591
1173. doi:10.1182/blood-2004-01-0277 592
28. Huisken J, Stainier DYR. Selective plane illumination microscopy techniques in developmental 593
biology. Development. 2009;136(12):1963-1975. doi:10.1242/dev.022426 594
29. Ichikawa T, Nakazato K, Keller PJ, et al. Live imaging and quantitative analysis of gastrulation in 595
mouse embryos using light-sheet microscopy and 3D tracking tools. Nat Protoc. 2014;9(3):575-596
585. doi:10.1038/nprot.2014.035 597
30. Weber M, Mickoleit M, Huisken J. Multilayer mounting for long-term light sheet microscopy of 598
zebrafish. J Vis Exp. 2014;(84):e51119. doi:10.3791/51119 599
31. Schindelin J, Arganda-Carreras I, Frise E, et al. Fiji: an open source platform for biological image 600
analysis. Nat Methods. 2012;9(7):676-682. doi:10.1038/nmeth.2019 601
32. Eliceiri KW, Rueden C. Tools for visualizing multidimensional images from living specimens. 602
Photochem Photobiol. 2005;81(5):1116-1122. doi:10.1562/2004-11-22-IR-377
603
33. Sugiura G, Kühn H, Sauter M, Haberkorn U and Mier W. Radiolabeling strategies for tumor-targeting 604
proteinaceous drugs. Molecules. 2014;19(2):2135-2165. doi:10.3390/molecules19022135 605
34. Agostinelli S, Allison J, Amako K, et al. Geant4—a simulation toolkit. Nucl Instrum Methods Phys Res 606
A. 2003;506(3). doi:10.2172/799992
607
35. Allison J, Amako K, Apostolakis J, et al. Geant4 developments and applications. IEEE Trans Nuc. Sci 608
2006;53(1):270-278. doi:10.1109/TNS.2006.869826 609
36. Allison J, Amako K, Apostolakis J, et al. Recent developments in Geant4. Nucl Instrum Methods Phys 610
Res A 2016;835:186-225. doi:10.1016/j.nima.2016.06.125
611
37. Incerti S, Seznec H, Simon M, Barberet P, Habchi C, Moretto P. Monte Carlo dosimetry for targeted 612
irradiation of individual cells using a microbeam facility. Radiat Prot Dosim. 2009;133(1):2-11. 613
38. Barberet P, Vianna F, Karamitros M, et al. Monte-Carlo dosimetry on a realistic cell monolayer 614
geometry exposed to alpha particles. Phys Med Biol. 2012;57(8):2189-2207. doi:10.1088/0031-615
9155/57/8/2189 616
39. Howell RW. Radiation spectra for Auger electrons emitting radionuclides: Report No. 2 of AAPM 617
Nuclear Medicine Task Group No 6. Med Phys. 1992;19(6) 1371-1383. doi:10.1118/1.596927 618
40. Taborda A, Benabdallah N, Desbrée A. Dosimetry at the sub-cellular scale of Auger-electron emitter 619
99mTc in a mouse single thyroid follicle. Appl Radiat Isot. 2016;108:58-63.
620
doi:10.1016/j.apradiso.2015.12.010 621
41. Piroozfar B, Raisali G, Alirezapour B, Mirzaii M. The effect of 111In radionuclide distance and Auger
622
electron energy on direct induction of DNA double-strand breaks: a Monte Carlo study using 623
Geant4 toolkit. Int J Radiat Biol. 2018;94(4):385-393. doi:10.1080/09553002.2018.1440329 624
42. Eckerman K, Endo A. MIRD: Radionuclide data and decay schemes. Reston, VA: Society for Nuclear 625
Medicine; 2008. 626
43. Kassis AI. The amazing world of Auger electrons. Int J Radiat Biol. 2004;80(11-12):789-803. 627
doi:10.1080/09553000400017663 628
44. Bernal MA, Bordage MC, Brown JMC, et al. Track structure modeling in liquid water: A review of 629
the Geant4-DNA very low energy extension of the Geant4 Monte Carlo simulation toolkit. Phys Med. 630
2015;31(8):861-874. doi:10.1016/j.ejmp.2015.10.087 631
45. Incerti S, Ivanchenko A, Karamitros M, et al. Comparison of GEANT4 very low energy cross section 632
models with experimental data in water. Med Phys. 2010;37(9):4692-4708. 633
doi:10.1118/1.3476457 634