Publisher’s version / Version de l'éditeur:
Vous avez des questions? Nous pouvons vous aider. Pour communiquer directement avec un auteur, consultez la première page de la revue dans laquelle son article a été publié afin de trouver ses coordonnées. Si vous n’arrivez pas à les repérer, communiquez avec nous à [email protected].
Questions? Contact the NRC Publications Archive team at
[email protected]. If you wish to email the authors directly, please see the first page of the publication for their contact information.
https://publications-cnrc.canada.ca/fra/droits
L’accès à ce site Web et l’utilisation de son contenu sont assujettis aux conditions présentées dans le site
LISEZ CES CONDITIONS ATTENTIVEMENT AVANT D’UTILISER CE SITE WEB.
Digital Human Modeling for Design and Engineering (DHM) 2004 [Proceedings],
2004
READ THESE TERMS AND CONDITIONS CAREFULLY BEFORE USING THIS WEBSITE. https://nrc-publications.canada.ca/eng/copyright
NRC Publications Archive Record / Notice des Archives des publications du CNRC :
https://nrc-publications.canada.ca/eng/view/object/?id=43d0d9ac-8646-4fb4-a08f-6f890fb657c5
https://publications-cnrc.canada.ca/fra/voir/objet/?id=43d0d9ac-8646-4fb4-a08f-6f890fb657c5
NRC Publications Archive
Archives des publications du CNRC
This publication could be one of several versions: author’s original, accepted manuscript or the publisher’s version. / La version de cette publication peut être l’une des suivantes : la version prépublication de l’auteur, la version acceptée du manuscrit ou la version de l’éditeur.
Access and use of this website and the material on it are subject to the Terms and Conditions set forth at
Exploring Anthropometric Data Through Cluster Analysis
National Research Council Canada Institute for Information Technology Conseil national de recherches Canada Institut de technologie de l'information
Exploring Anthropometric Data Through
Cluster Analysis *
Paquet, E.
June 2004
* published in Digital Human Modeling for Design and Engineering (DHM). June 15-17, 2004. Oakland University, Rochester, Michigan, USA. NRC 46564.
Copyright 2004 by
National Research Council of Canada
Permission is granted to quote short excerpts and to reproduce figures and tables from this report, provided that the source of such material is fully acknowledged.
04DHM-4
Exploring anthropometric data through cluster analysis
Osama Abdali and Herna Viktor
University of Ottawa, Ottawa (Ontario), CanadaEric Paquet and Marc Rioux
Visual Information Technology, National Research Council, Ottawa (Ontario), CanadaCopyright © 2004 SAE International
ABSTRACT
Anthropometric databases consisting of both multimedia and relational content are increasingly becoming commonplace. These databases are huge and contain data with diverse formats, representations and models. Data mining provides a powerful mechanism to further explore and explain the data as contained in these heterogeneous repositories, focusing on discovering new relationships which cannot be found using standard information retrieval techniques. In particular, cluster analysis is a data mining technique which is used to group data records into unlabeled classes, e.g. to group individuals with similar body types, income and education levels into a cluster, using unsupervised learning.
This paper introduces cluster analysis as a method to explore 3D body scans together with the relational anthropometric and demographic data as contained in an integrated multimedia anthropometric database. The paper provides an overview of different cluster analysis algorithms and discusses the strengths and weaknesses of each approach when mining 3D objects together with relational attributes. Cluster analysis algorithms are evaluated in terms of scalability, the number of attributes that can be processed, the level of human intervention required and the characteristics of the clusters, amongst others. This is followed by a discussion on the application of cluster analysis to anthropometric data. The use of cluster analysis to group the data records into clusters based on both the 3D body scans and the relational attributes lead to a new understanding of the data and their interrelationships.
INTRODUCTION
Clustering (or cluster analysis) is a data mining technique that deals with the extraction of the implicit knowledge, data relationship or other patterns not explicitly stored in databases, by grouping related records together. Cluster analysis has a wide range of applications in pattern recognition, image segmentation, economic science,
market research, information retrieval, text mining, bio informatics and DNA analysis [1, 5, 12]. A cluster is a collection of objects that are similar to one another and are dissimilar to the objects in other clusters. The goal of clustering is to find inter-cluster similarity and intra-cluster dissimilarity, through the discovery of a hidden pattern that gives meaningful groups (clusters) of objects.
This paper describes the use of cluster analysis to obtain new insights into a multi-dimensional database consisting of 3D full-body scans together with numerous relational attributes.
The paper is organized as follows. Section 2 introduces the anthropometric data. In section 3, an overview of cluster analysis techniques is provided. This is followed, in Section 4, with a description of the four techniques identified for use with the anthropometric data set. Section 5 discusses the application of cluster analysis to the anthropometric data.Section 6 concludes the paper.
THE ANTHROPOMETRIC DATA SET
Anthropometry is the study of human body measurements (height, weight, size, proportions, etc.) and its biomechanical characteristics. Anthropometric data refer to a collection of physical dimensions of a human body. The aim of anthropometry is therefore to characterize the human body by a set of measurements [2]. The Civilian American and European Surface Anthropometry Resource (CAESAR) data consortium is the first 3-D surface anthropometry of NATO nations that represents the anthropometric variability of men and women, aged between18 and 65 in North America and Europe. The CAESAR database contains anthropometric data (e.g. weight, height), demographic data (e.g. income, car brand) and 3D full-body scans concerning thousands of individuals in the USA, Canada, Italy and in the Netherlands [2, 3].
An important question to address is the identification of so-called archetypes within this data, in order to identify
meaningful subsets of the population. An archetype is defined as a centrally located subject in each cluster that is the true representative of the cluster [2]. The use of cluster analysis to identify such archetypes would go a long way to increase our understanding of the data. For example, these archetypes can be used for designing common consumer and industrial products. These products include, for example, clothes and cars that fir the population better and are more adapted to their morphology [2, 3] The anthropometric data can be mined to find interesting patterns and clusters that could further characterize the population, using cluster analysis as discussed next.
CLUSTER ANALYSIS TECHNIQUES
Cluster analysis is an active area of data mining research, with numerous research groups focusing on creating techniques, which automatically group data into related clusters [1, 5, 6, 7, 8, 9, 10, 11]. These techniques vary in the amount of a-priori knowledge required, the scalability, the number of clusters which can be found and the data types supported.
Clustering techniques are grouped into partitioning,
hierarchical, grid-based and density-based methods [1].
These clustering algorithms are based on the distance measure between two objects that are represented by a set of attribute-value pairs. The methods for computing the similarity (or dissimilarity) between two objects, to a large extent, depend on the nature of the attributes themselves and the characteristics of the objects that we need to model by the similarity function. Euclidean distance and Manhattan distance are well-known methods for distance measurement [1, 8].
Partition-based clustering methods construct the clusters
by creating various partitions of the data set. The user provides the desired number k, of clusters and some criterion function is used in order to evaluate the proposed partition or the solution. This measure of quality could be the average distance between clusters, for instance. Some well-known algorithms under this category are k-means, PAM, CLARA and CLARANS [7, 8].
Hierarchical clustering methods build a cluster hierarchy,
i.e. a tree of clusters also known as dendogram. Hierarchical clustering methods are categorized into agglomerative (bottom-up) and divisive (top-down). An agglomerative clustering starts with one-point clusters and recursively merges two or more most appropriate clusters. In contrast, a divisive clustering starts with one cluster of all data points and recursively splits into non-overlapping clusters. The process continues until a stopping criterion (frequently, the requested number k of clusters) is achieved. Hierarchical methods provide ease of handling of any form of similarity or distance. It is applicable to various attribute types. However, most hierarchical algorithms do not revisit and improve intermediate clusters after their construction. Furthermore, the termination criteria is characterised by
its vagueness. Hierarchical clustering algorithms include BIRCH and CURE [1, 5, 6, 9],
Density-based methods discover clusters with arbitrary
shape and require the concepts of density, connectivity and boundary. Clusters, defined as a connected dense component, grow in the direction that density leads. DBSCAN, DBCLASD and DENCLUE are the well-known methods in the density-based category [1, 5, 6].
The grid-based clustering approach uses a multi-resolution grid data structure. It quantizes the space into a finite number of cells that form a grid structure on which all of the operations for clustering are performed. The main advantage of the approach is its fast processing time, which is typically independent of the number of objects, yet only dependent on the number of grid cells for each dimension. Several interesting methods in this clustering category are STING, WaveCluster and CLIQUE [1, 5, 6, 10, 11].
There are also other techniques available including model-based clustering, constraint-based and fuzzy clustering [1, 4, 5, 6]. The following section describes the cluster analysis techniques, which are relevant for use with the CAESAR data.
CLUSTER ANALYSIS TECHNIQUES FOR
ANTHROPOMETRIC DATA
One of the most challenging tasks in finding clusters within the CAESAR database is to deal with the high dimensionality of the data. CAESAR has a huge attribute set that needs to be considered when finding clusters. For a given sample size, there is a maximum number of features above which the performance of the clustering algorithm will degrade rather than improve. This problem is termed as the “curse of dimensionality” [14]. The CAESAR database contains more than fifty anthropometric features in addition to the same number of demographic features. To create good clusters, our initial task is to reduce the dimension of the data set and then find the clusters in new dimensional space. There are different techniques available for dimensionality reduction, including Principal Component Analysis (PCA) and wavelet transform, amongst others [1, 5, 13]. The other issues that are of importance when applying clustering methods to the CAESAR data are the scalability of the method for a large number of records, the reliability and efficiency, the ability to find irregularly shaped clusters, the sensitivity to outliers and the a-priori knowledge required. The algorithm should be scalable in terms of computation time and memory requirements. While the expected level of noise in the CAESAR data is low, due to the fact that the measurement data is coming directly from human shape scans, the method should be able to find outliers. It should be able to find clusters automatically without any human intervention or domain expert’s input. Rather, the domain expert should act as a human judge to evaluate the end results of clustering, without intervening during cluster creation. To achieve
this goal, the clustering approach should be able to represent each cluster by its archetype [2].
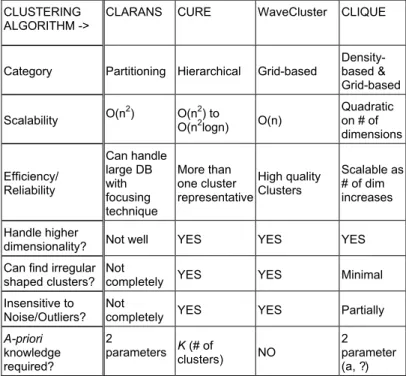
Following the above-mentioned requirements, the following four clustering methods were selected as possible candidates for use with the CAESAR data. Table 1 shows a comparative chart of the four possible clustering techniques that could be useful to create CAESAR clusters, as discussed next.
CLUSTERING ALGORITHM ->
CLARANS CURE WaveCluster CLIQUE
Category Partitioning Hierarchical Grid-based
Density-based & Grid-based
Scalability O(n2) O(nO(n22) to logn) O(n)
Quadratic on # of dimensions Efficiency/ Reliability Can handle large DB with focusing technique More than one cluster representative High quality Clusters Scalable as # of dim increases Handle higher
dimensionality? Not well YES YES YES Can find irregular
shaped clusters? Not
completely YES YES Minimal Insensitive to
Noise/Outliers? Not
completely YES YES Partially
A-priori knowledge required? 2 parameters K (# of clusters) NO 2 parameter (a, ?)
Table 1: Cluster analysis techniques for CAESAR data (adapted from [6])
CLARANS is a partition-based method that uses a sampling technique where a sample of neighbours is dynamically drawn. The clustering process consists of searching a graph where every node is a potential solution. In this approach, the number of clusters k is specified by the user. CLARANS requires two additional parameters, namely the maximum number of neighbours to which any specific node can be compared and the number of samples to be taken. When the local optimum is found, CLARANS starts with a new randomly selected node in search for a new local optimum. It swaps random neighbours of the current node based on the lower swapping cost [1, 7]. CLARANS is suitable for use with the CAESAR data since it finds one archetype per cluster, detects outliers and is scalable. In addition, it handles large datasets and high dimensions well [7]. A disadvantage of this approach is the need to specify the number k of clusters in advance. Also, results may vary due to the randomisation in the search process.
CURE is an agglomerative hierarchical method that uses multiple representative points to evaluate the distance between clusters. The technique uses two methods to achieve scalability. The first one is data sampling. Secondly, the data are partitioned into p partitions, so that fine granularity clusters are constructed within these partitions. The distance between two clusters used in the
agglomerative process is equal to the minimum of distances between two scattered representatives, thus combining graph (all-points) methods and geometric (the so-called one centroid) methods. In addition, originally selected scattered points are shrunk to the geometric centroid of the cluster by a user-specified factor a. Shrinkage suppresses the affect of the outliers since outliers happen to be located further from the cluster centroid than the other scattered representatives [1, 6, 9]. In addition, CURE is suitable for use with the CAESAR data since it is scalable, handles large dimensions and is able to find clusters of different shapes and sizes. Also, in case of an irregular shape, it provides more than one archetypes per cluster. However, CURE needs the number of required clusters as an input and requires user intervention. In terms of scalability, it is time complex (O(n2logn)), but variations use heap or k-d tree data structure to assist in merging of clusters in order to improve performance [9].
WaveCluster is based on the wavelet transform and the
grid-based approach. A wavelet transform is a signal
processing technique that decomposes a signal into different resolution sub-bands [1]. Wavecluster divides the range of values associated with each dimension into a finite set of equal length intervals. The ensemble of all discrete dimensions forms a discrete multidimensional space. The smallest volumetric element of this space is called a voxel. Wavecluster assigns the continuous values associated with each dimension to the corresponding voxel in the multidimensional space. If more than one value is attributed to a voxel, their sum is accumulated. Wavecluster applies discrete wavelet transform to the multidimensional discrete space in order to find connected components or clusters in the transformed wavelet space [1, 6, 10]. WaveCluster works well with high dimensional data sets, such as the CAESAR data. The quality of the output clusters are high, it successfully handle noises and is able to find irregular shape clusters with no a-priori knowledge [10]. In order to use WaveCluster, an estimation of the resolution, i.e. the number of discrete channels associated with each dimension, must be provided as well as a basis function for the wavelet transform [6, 10]. CLIQUE, which combines grid-based and density-based principles, uses dimensionality reduction in order to identify the m most informative dimensions prior to clustering. That is, dimensionality reduction is used to identify the dimensions, which have non-uniformly distributed values and are thus relevant for clusters formation. The improvement in clustering is achieved by partitioning each of these m dimensions into the same number of equal length intervals, through the use of a greedy heuristic search method. An m-dimensional data space is partitioned into non-overlapping rectangular units and searches for dense units. A unit is dense if the fraction of total data points contained in the unit exceeds the input model parameter. The method forms a cluster as a maximal set of connected dense units within a subspace. It scales linearly with the size of input and thus has good scalability as the number of dimensions in the data increases, thus working well with high
dimensions [1, 6, 11]. Also, due to the identification of data subspaces it allows for better clustering than from the original space, since it focuses the search and it is insensitive to noise [11]. A drawback is that the user has to specify parameters, the choice of which has a substantial effect on the number of clusters and the resulting clusters.
APPLICATION OF CLUSTER ANALYSIS TO
ANTHROPOMETRIC DATA
The mining of anthropometric data using the above-mentioned clustering methods will lead to the creation of meaningful clusters and their corresponding archetype(s). The advantage of using the clustering approach is that we can detect the natural groups, in the form of clusters, as based on different body types, together with demographic information such as income, gender and level of education, etc. That is, the use of clustering would go a long way to aid our understanding of the distinguishing characteristics of the population. The clusters and interesting archetypes as identified will be very useful in designing clothes that fit us better or to derive human body models on which industrial designs can be based.
Our synthesis of the analysis of the four clustering approaches, as discussed in the previous section, indicates that the WaveCluster method should be used initially to identify potential candidates for clustering. This method is able to identify clusters of different sizes and no a-priori knowledge regarding the number of clusters is required. Also, through using the WaveCluster approach, more than one archetype can be associated to a given cluster, if required. Another advantage of WaveCluster is its high scalability and its insensitivity to outliers, which often occur in the anthropometric data. After applying WaveCluster to the data, a k number of clusters will thus be identified. Next, the CLARANS, CURE and CLIQUE algorithms will be applied to the data, using the results of WaveCluster as a-priori knowledge regarding the number of clusters and as indication for setting the other parameters of each algorithm. The results of the four methods will subsequently be evaluated by human judges, as well as in terms of predictive accuracy against previously unseen cases. The end result will be a set of clusters based on the results of the four cluster analysis algorithms, as verified by a human expert.
CONCLUSION
In this paper, we introduced cluster analysis techniques and presented four candidate clustering methods for use with the CAESAR data. We also discussed the pros and cons of the methods we selected and their suitability for use with the anthropometric data. Future work will include the application of these four techniques to the CAESAR data, leading to a selection of the most appropriate set of clusters and archetypes, based on both the predictive accuracy of the results and the feedback received from human judges.
REFERENCES
[1] J. Han and M. Kamber. Data Mining: Concepts and Techniques. Morgan Kaufman Publishers, USA. 2001.
[2] E. Paquet and M. Rioux. Anthropometric Visual Data Mining: A Content-Based Approach, submitted to IEA 2003 - International Ergonomics Association XVth Triennial Congress, Seoul, South Korea. August 24-29, 2003.
[3] E. Paquet, K. Robinette and M. Rioux. Management of Three-dimensional and Anthropometric Databases: Alexandria and Cleopatra. Journal of Electronic Imaging, Volume 9(4). October 2000.
[4] M. Dunham. Data Mining: Introductory and Advanced Topics. Pearson Education, New Jersey, USA. 2003.
[5] P. Berkhin. Survey of Clustering Data Mining Techniques. Accrue Software Inc., San Jose, CA, USA. 2002.
[6] E. Kolatch. Clustering Algorithms for Spatial Databases: A Survey. Department of Computer Science, University of Maryland, USA. 2001. [7] R. Ng and J. Han. Efficient and effective clustering
methods for spatial data mining. In Proceedings of the VLDB Conference, Santiago, Chile. 1994. [8] L. Kaufman and P. Rousseeuw. Finding Groups in
Data: An Introduction to Cluster Analysis. John Wiley Sons, New York, USA. 1990.
[9] G. Sudipto, R. Rastogi and K. Shim. CURE: An Efficient Clustering Algorithm for Large Databases. Proceedings of ACM SIGMOD International Conference on Management of Data. New York, USA.1998.
[10] G. Sheikholeslami, S. Chatterjee and A. Zhang. WaveCluster: A Multi-resolution Clustering Approach for Very Large Spatial Databases. In Proceedings of the 24th Conference on VLDB, 428-439, New York, USA. 1998.
[11] R. Agrawal, J. Gehrke, D. Gunopulos and P. Raghavan. Automatic Subspace Clustering of High Dimensional Data for Data Mining Applications. In Proceedings of the ACM SIGMOD Conference, 94-105, Seattle, WA, USA. 1998.
[12] Y. Zhao and G. Karypis. Clustering in Life Sciences. In "Functional Genomics: Methods in Molecular Biology”. Humana Press, New Jersey, USA. 2003.
[13] A. Ben-Hur and I. Guyon. Detecting Stable Clusters Using Principal Component Analysis. In Methods in Molecular Biology, M.J. Brownstein and A. Kohodursky (eds.). Humana Press, New Jersey, USA. 2003.
[14] R. Bellman. Adaptive Control Processes: A Guided Tour. Princeton University Press. 1961.