HAL Id: hal-02316845
https://hal.archives-ouvertes.fr/hal-02316845
Submitted on 15 Oct 2019
HAL is a multi-disciplinary open access
archive for the deposit and dissemination of
sci-entific research documents, whether they are
pub-lished or not. The documents may come from
teaching and research institutions in France or
abroad, or from public or private research centers.
L’archive ouverte pluridisciplinaire HAL, est
destinée au dépôt et à la diffusion de documents
scientifiques de niveau recherche, publiés ou non,
émanant des établissements d’enseignement et de
recherche français ou étrangers, des laboratoires
publics ou privés.
Using Smart Offices to Predict Occupational Stress
Ane Alberdi, Asier Aztiria, Adrian Basarab, Diane J. Cook
To cite this version:
Ane Alberdi, Asier Aztiria, Adrian Basarab, Diane J. Cook. Using Smart Offices to Predict
Oc-cupational Stress.
International Journal of Industrial Ergonomics, Elsevier, 2018, 67, pp.13-26.
Any correspondence concerning this service should be sent
to the repository administrator:
[email protected]
This is an author’s version published in:
http://oatao.univ-toulouse.fr/22405
To cite this version: Alberdi, Ane and Aztiria, Asier and Basarab,
Adrian and Cook, Diane J. Using Smart Offices to Predict Occupational
Stress. (2018) International Journal of Industrial Ergonomics, 67. 13-26.
ISSN 0169-8141
Official URL
DOI :
https://doi.org/10.1016/j.ergon.2018.04.005
Open Archive Toulouse Archive Ouverte
OATAO is an open access repository that collects the work of Toulouse
researchers and makes it freely available over the web where possible
Using
smart offices to predict occupational stress
Ane
Alberdi
a,∗,
Asier Aztiria
a,
Adrian Basarab
b,
Diane J. Cook
c aMondragon University, Electronics and Computing Department, Goiru Kalea, 2, Arrasate, 20500, SpainbUniversité Paul Sabatier Toulouse 3, IRIT UMR 5505, 118 Route de Narbonne, Toulouse Cedex 9, 31062, France cSchool of Electrical Engineering and Computer Science, Washington State University, Pullman, WA, 99164, USA
Keywords: Stress Smart office Automatic assessment Behavior Physiology A B S T R A C T
Occupational stress is increasingly present in our society. Usually, it is detected too late, resulting in physical and mental health problems for the worker, as well as economic losses for the companies due to the consequent absenteeism, presenteeism, reduced motivation or staff turnover. Therefore, the development of early stress detection systems that allow individuals to take timely action and prevent irreversible damage is required. To address this need, we investigate a method to analyze changes in physiological and behavioral patterns using unobtrusively and ubiquitously gathered smart office data. The goal of this paper is to build models that predict self-assessed stress and mental workload scores, as well as models that predict workload conditions based on physiological and behavior data. Regression models were built for the prediction of the self-reported stress and mental workload scores from data based on real office work settings. Similarly, classification models were employed to detect workload conditions and change in these conditions. Specific algorithms to deal with class-imbalance (SMOTEBoost and RUSBoost) were also tested. Results confirm the predictability of behavioral changes for stress and mental workload levels, as well as for change in workload conditions. Results also suggest that computer-use patterns together with body posture and movements are the best predictors for this purpose. Moreover, the importance of self-reported scores' standardization and the suitability of the NASA Task Load Index test for workload assessment is noticed. This work contributes significantly towards the development of an unobtrusive and ubiquitous early stress detection system in smart office environments, whose implementation in the industrial environment would make a great beneficial impact on workers’ health status and on the economy of com-panies.
1. Introduction
The pace of modern-day life, the competitiveness in the workplace, poor working conditions and the immense number of tasks with in-accessible deadlines that are assigned to workers are causing work-re-lated stress to become increasingly frequent in our work environment. The International Labour Organization (ILO) defines stress as the harmful physical and emotional response caused by insufficient perceived resources and abilities of individuals to cope with the perceived demands, and is determined by work organization, work design and labour relations (I. L. O, 2016). It is the second most frequent work-related health problem in Europe (European Agency for Safety and Health at Work, 2013a), presenting in 2005 a pre-valence of 22% among working Europeans. In a recent opinion poll (European Agency for Safety and Health at Work, 2013b), 51% of the workers confessed that stress is common in their workplace and the 6th European Working Conditions Survey (European Foundation for the Improvement of Living and Working Conditions,
2016) exposed that 36% of European workers deal “(almost) all of the time” with high pressure to meet tight deadlines.
If timely action is not taken, occupational stress can provoke serious physical and mental problems on the worker (Milczarek et al., 2009), but also important economic losses in the companies. Musculoskeletal disorders, depression, anxiety, increased probability of infections (Wijsman et al., 2013), chronic fatigue syndrome, digestive problems, diabetes, osteoporosis, stomach ulcers and coronary heart disease (Marlen Cosmar et al., 2014;Peternel et al., 2012;Bickford, 2005) are only a few examples of occupational stress’ long-term health con-sequences. Occupational stress can also result in increased absenteeism and presenteeism, reduced motivation, satisfaction and commitment, along with a greater rate of staff turnover and intention to quit, costing high amounts of money to the enterprises (Drivers and Barriers, 2012). An estimate of €617 billion a year is what work-related depression costs to European enterprises, including costs of absenteeism and pre-senteeism (€272 billion), loss of productivity (€242 billion), healthcare costs (€63 billion) and social welfare costs in the form of disability
∗Corresponding author.
E-mail addresses: [email protected] (A. Alberdi), [email protected] (A. Aztiria), [email protected] (A. Basarab), [email protected] (D.J. Cook). https://doi.org/10.1016/j.ergon.2018.04.005
office environments to create stress prediction models (Dawadi et al., 2015). This algorithm consists of the application of a sliding window to extract five different time-series statistics from physiological and be-havioral data, describing the change and variability of these patterns. This allows the construction of models to predict self-assessed stress and workload levels from the change features instead of using the usual instantaneous feature values. Although it is out of the scope of this work, the computation of these behavioral and physiological change parameters not only provides a method to take the temporal nature of stress into account, but it is also a way to standardize data coming from different subjects, facilitating generalization of the models over a po-pulation group.
As a second goal of this work, we also determine the possibility of automatically detecting a workload condition change using these changes in physiological and behavioral data.
The CAAB algorithm has been validated in other scenarios and has been shown to be useful for cognitive state and everyday functioning assessment (Dawadi et al., 2015). The validation of the approach for early stress detection would result in a system that could alert both workers and managers enabling to take timely action. Moreover, this would define the path to follow towards the final development and
implementation of a global early detection system for disorders that provoke behavioral changes, among which stress is just an example.
Therefore, the research questions we aim to address in this paper are:
•
Can we predict users' perceived stress and mental workload level from changes in their unobtrusively collected behavioral and phy-siological data?•
Which physiological or behavioral changes are the most informant about stress and mental workload levels?•
Can physiological and behavioral variability as monitored by am-bient sensors be used to detect the conditions under which a parti-cipant is working, both from a predefined set of conditions and from reliably differently perceived conditions?•
Can these data be used to detect a change in workload settings? Can they also detect the direction of these changes? And a reliably perceived workload change?The main contributions of this paper are: 1) Use of the CAAB al-gorithm to evaluate the possibility of measuring self-assessed and standardized stress and mental workload from changes in unobtrusively collected real-life smart office data. 2) Analysis of the predictability of a wide variety of stress and mental workload assessment scores. 3) A feature selection-based analysis of the contribution of each type of behavioral and physiological change to the prediction of each of the self-assessment test scores. 4) Analysis of the predictability of an ob-jective and reliable workload condition, change in these conditions and their directionality from unobtrusively collected data. 5) Testing of specific algorithms (i.e. SMOTEBoost (Chawla et al., 2003) and RUS-Boost (Seiffert et al., 2010)) to boost models’ sensitivity for mental workload detection.
The remaining part of the paper proceeds as follows. First, Section2, begins by reviewing the related literature. Section 3 explains the methods used for the data collection, preprocessing and model building process. Next, in Section4, prediction models’ results are presented. Finally, in Section5, results are discussed and the conclusions drawn are presented.
2. Related work
Smart offices have already been implemented and used for a variety of purposes, being the area of energy efficiency a highly popular field of application (Akbar et al., 2015; Choi et al., 2015a, 2015b; Rottondi et al., 2015). Moreover, research aimed at improving workers’ quality of life based on this technology are also present in the literature (Kaklauskas et al., 2011;Kiyokawa et al., 2012;McDuff et al., 2012).
To date, stress detection research has mainly focused on the use of physiological signals that could objectively measure stress-levels while replacing the well-accepted but highly inaccessible methods such as salivary cortisol measurements. Even if a wide variety of physiological signals have been analyzed, the most successful results have been achieved with the monitoring of skin conductance levels (SCL), as well as with heart rate (HR) and heart rate variability (HRV) extracted from electrocardiograms (ECG) (Alberdi et al., 2015). Stress and emotions have also been associated with some objectively-measured behaviors (Sharma and Gedeon, 2012). These include computer use patterns (Eijckelhof et al., 2014), posture (McDuff et al., 2012;Arnrich et al., 2010), facial expressions (McDuff et al., 2012; Dinges et al., 2005), speech (Kurniawan et al., 2013;Hagmueller et al., 2006;Lu et al., 2012), mobile phone use (Sano and Picard, 2013;Muaremi et al., 2013), writing patterns (Vizer et al., 2009;Saleem et al., 2012) and global activity-level parameters measured in smart environments (Suryadevara et al., 2012). Nonetheless, the reported conclusions do not result from real office-work settings but from experiments under artificial conditions where partici-pants were not performing their usual work and/or stress was elicited with atypical stressors for an office worker.
benefit payments (€39 billion) (European Agency for Safety and Health at Work, 2013a). An estimate of 50–60% of all lost working days in European enterprises are due to work-related stress and psychosocial risks (European Agency for Safety and Health at Work, 2013a).
In this context, methods to detect occupational stress in time so as to take the required measures and to avoid its negative health-related and economic consequences are necessary. Often, stress levels are evaluated by means of self-reported questionnaires, which are performed from time to time, and therefore, are not adequate to detect subtle changes that might end up in a more serious problem (Alberdi et al., 2015). Usually, the diagnosis comes too late with these methods, when damage has been done. Moreover, self-reported questionnaires are subjective and rely on subjects’ recall abilities and awareness of the situations, which is not guaranteed (McDuff et al., 2012), leading sometimes to incorrect stress level measurements.
In recent years, technology to unobtrusively and ubiquitously monitor users' behavior is being developed as Smart Environments (Ramos et al., 2010). Future work environments are supposed to be intelligent, adaptive, intuitive and interactive (Strömberg et al., 1007). In this sense, a smart office has been defined as an environment that is able to adapt itself to the user's needs, release the users from routine tasks they should perform, change the environment to suit their pre-ferences and access services available at each moment by customized interfaces (Marsá Maestre et al., 2006). In addition, we also see an opportunity based on its potential to avoid health-related problems for workers and improve their quality of life. As a great percentage of workers develop their tasks in an office environment, smart offices re-present a useful infrastructure to continuously monitor workers' beha-vior in a completely transparent way, gathering real work-life data throughout the working day and therefore, to overcome the main dis-advantages of the usual assessment methods. The collected data can provide a complete view of workers' behavior in a real-world work environment, the efficiency and ecological validity of the resulting stress assessments and reducing stress detection delays.
Our goal in this paper is to build and validate stress and mental workload prediction models based on unobtrusively collected physio-logical and behavioral data in a smart office environment. As all other disorders, stress progresses over time. Usually, in stress detection re-search, the temporal nature of the disorder is not taken into account, and only a snapshot of the symptoms is considered for prediction. In contrast, in this work we hypothesize that changes over time of these symptoms can predict the mental states of the subjects and the condi-tions they are undergoing.
To support this hypothesis, we propose the use of the Clinical Assessment using Activity Behavior (CAAB) approach adapted to smart
To overcome this obstacle and get to know stress in the most natural environment possible,Koldijk et al. (2016)recently analyzed the pos-sibility of detecting stressful situations and estimating mental states from unobtrusively collected smart office physiological and behavioral data. These data were collected in an experiment where the participants performed real office-work and were being stressed with common real office-related stressors such as time pressure and e-mail interruptions. They succeeded in accepting their hypothesis and built both stress and mental workload prediction models from the smart office data. They also analyzed the importance of building individual stress detection models instead of generic models, concluding that specialized models for particular groups of people with similar characteristics might be much more effective on this task. However, as most of the existing literature does, these authors (Koldijk et al., 2016) ignored the temporal nature of stress and only considered the use of instantaneous values of the physiological and behavioral data to create the prediction models. Given that stress is a disorder that progresses over time, we hypothesize that stress-detection research would benefit from an approach based on the use of time-series statistics describing physiological and behavioral change over time.
3. Methods 3.1. Dataset
The SWELL Knowledge Work Dataset for Stress and User Modeling Research (SWELL-KW) (Koldijk et al., 2014)1 collected in the ‘Smart
Reasoning for Well-being at Home and at Work’ (SWELL) project was used for the current study. We decided to use this dataset for two reasons. First, it reflects real office workers' state performing their natural office work under real-life stressors, instead of being collected in an experiment where they are asked to perform artificial tasks or being submitted to non-common stressors. Second, the data gathered in the experiment can be easily collected with unobtrusive and easily accessible sensors that could be deployed in real office environments. Thus, this could facilitate the exploitation of the results obtained from this analysis.
SWELL-KW consists of multimodal data of 25 people who were submitted to a real work-setting experiment in a smart office environ-ment. The participants were asked to perform common office work while they were being subjected to different workloads and different stress levels elicited by means of e-mail interruptions and time pressure. In addition to an initial relaxed state (R), three different conditions were simulated: a neutral condition where the subjects were asked to perform some ‘normal work’ without any stressors (N), a condition where they were forced to work under time pressure (T), and a third condition with e-mail interruptions as stressors (I). In the meanwhile, their physiological signals, computer use patterns, facial expressions and body posture were recorded by means of computer logging, video recordings, a Kinect 3D sensor and specific minimally-intrusive body sensors (namely, a Mobi (TMSI) device with self-adhesive electrodes to record ECGs and Skin Conductance levels). Participants' perceived le-vels of stress and mental workload were assessed once per condition by a variety of self-reported questionnaires: Self Assessment Manikin (SAM) (Lang, 1980), Rating Scale Mental Effort (RSME) (Zijlstra and Van Doorn, 1985), NASA Task Load Index (NasaTLX) (Hart and Staveland, 1988) and a stress level assessment by means of a visual analog scale.Table 1summarizes the data collected in SWELL-KW.
3.2. Preprocessing
3.2.1. Minute-level feature extraction
Physiological and behavioral data of the 25 participants were col-lected continuously during the experiments, resulting in a raw data collection of 138 min (3 × 6 min R + 45 min N + 45 min I + 30 min T) for each one of the participants in the form of a computer log file, a FaceReader (FaceReader, 2015;Kinect for Windows SDK 2.0) log file, a Kinect SDK (Kinect for Windows SDK 2.0) joint coordinates file and a log registering the angles of the upper body and physiological data fromMobi (2016). Along with this raw dataset, SWELL-KW pro-vided aggregated minute-length features as specified in Table 1and whose extraction is explained in detail in the literature (Koldijk et al., 2014). In this study, we made use of these minute-level features, but other time-window lengths for data aggregation could also be con-sidered.
Modality Source Sensor Minute-length aggregated features
Physiology Body sensors (3 features) Mobi (TMSI) sensors with self-adhesive electrodes for ECG and Skin Conductance Level (SCL) (TMSI, 2017)
Heart Rate (HR), Heart Rate Variability (HRV), SCL
Behavior Personal Computer (16 features) uLog key-logging application (Noldus Information Technology, 2018)
Mouse use patterns (all mouse events, left clicks, right clicks, double clicks, wheel scrolling, drag events, distance), keyboard use patterns (all key events, n°of letter types, n°of special keys, n°direction keys, n°error keys, n°shortcut keys, n°of spaces typed) and applications (n°of app. changes, n°of tabfocus changes)
Facial expressions (8 features) iDS uEye UI-1490RE USB camera (IDS) and Philips SPC 900NC webcam (Koninklijke Philips)
The degree of detection of the following emotions: neutrality, happiness, sadness, anger, surprise, scare, disgust and valence
Head and facial movements (32 features)
iDS uEye UI-1490RE USB camera and Philips SPC 900NC webcam
Head orientation (3), mouth opening, eye opening (2), eyebrow raising (4), gaze direction (3) and amount of activation of several facial points (20)
Body posture and movements (94 features)
Kinect 3D (Kinect for Windows SDK 2.0)
Proximity to the computer, forward inclination, shoulders' state (2), relative skeletal angles' average values describing the participants' posture (43) and standard deviations describing movements (47)
Subjective/ Psychological Self-reported tests (12 features) – SAM scores (Valence, arousal, dominance), stress, RSME score (mental effort), NasaTLX scores (mental demand, physical demand, temporal demand, effort, performance, frustration and global NasaTLX)
1Available online at (M. M. T., et al., 2014).
Table 1
3.2.2. Behavior statistics’ computation
As mentioned previously, we had available a set of minute-length physiological and behavioral features for each participant, as well as the subjective levels of perceived stress and mental workload under each condition for each participant. From this minute-level dataset, we computed two different summarizing datasets with two different goals using two different configurations for the CAAB algorithm.
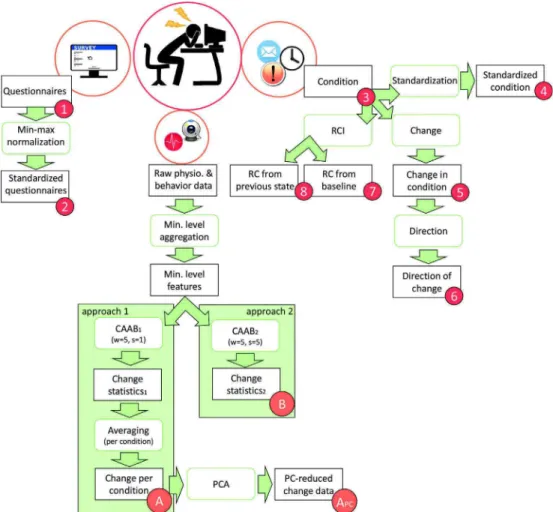
In order to extract the physiological and behavioral statistics for each participant under each condition, we implemented the CAAB (Dawadi et al., 2015) algorithm adapted to smart office data in Matlab. The minute-length physiological and behavioral data was processed using this algorithm as follows. First, each participant's minute-length physiological and behavioral features for each condition were extracted. Second, five summarizing time-series statistics were computed for each physiological and behavioral feature in this period using a sliding window of length (w) 5 min with a skip size (s) of 1 min: variance, skewness, kurtosis, autocorrelation and change. In order to stabilize data variance and remove the effect of non-stationary (e.g. periodic) components, a log-transform followed by a linear detrending was applied to each physiological and behavioral variable falling inside the sliding window just before the computation of the summary statistics. While the first four are well-known time-series processing methods (Dakos et al., 1371), the change statistic was first introduced byDawadi et al. (2015). In brief, computation of the change feature is to apply a change detection algorithm between the two halves of the piece of time-series data that falls into the sliding window, so that we receive a ‘1’ if a significant change is found between the two halves, and a ‘0’ otherwise. For this purpose, we used an implementation of the Hotelling-T test (Hotelling, 1931) change algorithm available for Matlab.2Finally, the average of each time-series
statistic for the length of the condition period was computed. The set of
time-series statistics' averages was used for the final predictions. Note that the sliding window length (w = 5) was selected empirically in a preliminary test, but other window sizes could also be considered. This process is highlighted in Approach 1 ofFig. 1.
For the second dataset, only the last two steps differed from the previous process: after the application of the log-transform and linear detrending, the same five summarizing time-series statistics were computed, but this time, using a non-overlapping sliding window of 5 min' length (s = 5, w = 5). Condition-level averages were not com-puted this time, and the 5 min’-level dataset was considered as the final version for the condition change detection (see Approach 2 inFig. 1). Thus, the resulting preprocessed datasets for further analysis were: 1) a collection 100 data instances of 780 (5 time-series statistics of 156 physiological and behavioral features) summary behavior statistics modeling each one of the 25 participants who went through the four conditions of the SWELL experiment (dataset A (seeFig. 1)), and 2) a collection of 616 data instances of 780 summary behavior statistics describing the physiological and behavioral output of the 25 partici-pants for 5 min non-overlapping intervals during the length of the whole experiment (dataset B)).
We made sure that none of the variables in any of the two datasets exceeded 30% of missing data, to remove the whole variable from the analysis if it was so. The remaining missing values (variables with <30% missing data) were imputed by the mean value for each attribute using the ‘ReplaceMissingValues’ filter in Weka.
Fig. 1. Flow-chart of the whole preprocessing method. Post-processed self-assessed stress levels used as prediction labels are numbered from 1 to 8, whereas post-processed datasets containing physiological and behavioral data are called A, APCand B.
3.2.3.4. Reliable change in perceived workload levels. Despite the more ecologically valid experimental conditions that are used, the objectively measured condition might not necessarily be reflecting a significant workload change for all of the participants. To standardize the effect of each condition on the perceived task load for each participant, we computed the Reliable Change Indexes (RCI) (Christensen and Mendoza, 1986) for the NasaTLX scores. RCI informs whether a participant's perception (in this case, perceived workload levels) has experienced a significant change in an assessment score based on his/ her own previous perception. RCI discards changes that might have appeared due to reasons other than an actual change in scores (such as measurement unreliability, repeated-testing or practice effects) by applying a threshold to the scores' differences. We looked for two different RCIs, one for each post-processed dataset. For the first case, we computed whether each participant was reporting a reliable change in the perceived task loads for each condition compared to the relaxed state (‘R’) (label 7). We assumed the NasaTLX score to be null for that initial condition. The reliable change index per condition and subject was computed as shown in Equation(1),
= −
RCI i Nasa i Nasa R
S Em
( ) ( ) ( )
2
baseline TLX TLX
NasaTLX (1)
where NasaTLX( )i and NasaTLX( )R are the self-reported task-load level for the condition i and for the relaxed condition respectively, and
SEmNasaTLXor Standard Error of Measurement represents the expected
variation of the observed NasaTLX scores due to measurement error, being computed as shown in Equation(2),
= −
SEmNasaTLX SDNasaTLX 1 rNasaTLX (2)
where rNasaTLXis the test-retest reliability measuring the consistency of the NasaTLX scores over time. Test-retest reliability parameters for the NasaTLX scores can be found inTable 2.
For the second case, we analyzed whether the participants were undergoing a significant workload change in each 5-min length period (label 8). For this purpose, we computed the RCI in self-reported NasaTLX scores at the beginning and at the end of each consecutive 5-min time slot. This change was computed as shown in Equation(3),
= −
RCI j Nasa j Nasa j
S Em ( ) ( ) ( ) 2 cons TLX end TLX init Nasa . TLX (3)
where NasaTLX(jend)is the self-reported task-load index at the end of the 5-min length period j and NasaTLX(jinit)is the self reported task-load index at the beginning of the 5-min length period j.
A summary of the whole preprocessing task is given inFig. 1.
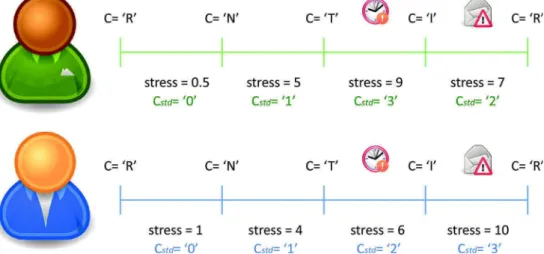
Fig. 2. Two examples for the standardization of the ‘condition’ (C) label. The C variable shows the objective condition the participant is undergoing, whereas stress variable shows the perceived stress levels for that condition by the participant. Cstdrepresents the standardized condition value calculated from the user's perceived
stress level in each condition.
3.2.3. Stress and mental workload assessment scores’ set up
The goal of this paper is to create prediction models that map physio-logical and behavioral changes of data collected in a smart office to the subjective stress and mental workload ratings self-reported by the partici-pants, as well as to objectively measure working conditions and condition changes. Our target variables are therefore defined as explained hereafter. 3.2.3.1. Self-reported stress and workload levels. The self-reported valence, arousal and dominance levels measured by the SAM test, the stress level, the mental effort measured by the RSME questionnaire, and the mental demand, the physical demand, the temporal demand, the effort, the performance, the frustration and the global task load levels measured by the NasaTLX questionnaire were all collected once for each condition setting (label 1 (see Fig. 1)). As self-reported questionnaires might be very subject-dependent, we also computed the standardized version of the ratings by applying min-max normalization per subject to the questionnaire responses (label 2). 3.2.3.2. Simulated workload condition settings. Moreover, a label objectively indicating the condition under which the data were collected was used (label 3). This one takes the form of a four-class nominal variable, representing the four workload condition settings implemented during the experiments: R, N, T and I. Nonetheless, the effect provoked by each condition setting may depend on each subject, i.e. a participant might feel much more stressed under time pressure (T) than under a condition with frequent e-mail interruptions (I) while another one feels the opposite. To reduce this type of inter-subject variability, we computed the standardized versions of the condition settings (Cstd) (label 4). For this purpose, we ordered the conditions from the least to the most stressful for each participant (as measured by the ‘stress’ label) and assigned corresponding numbers: ‘0’ for the least stressful and ‘3’ for the most stressful one (see Fig. 2).
3.2.3.3. Change in workload condition settings. In this case, a condition change variable was computed, indicating whether the subject was being submitted to a workload condition change in each one of the five-minute length data instances (label 5). Data were labeled with ‘1’ if this was true and with a ‘0’ otherwise. Finally, we also decided to make an attempt on detecting the directions of these condition changes, i.e.: for each 5-min period, we computed whether the user was increasing (positive label), decreasing (negative label) or maintaining (neutral label) his/her self-reported perceived workload levels (as measured by the ‘NasaTLX’ label), and assigned ‘-1’, ‘0’ or ‘1’ to each data instance (label 6).
3.3. Stress and mental workload prediction
The preprocessed datasets resulting from the previous steps were analyzed using Weka (Frank et al., 2016).
3.3.1. Self-reported stress and workload levels
First, a regression analysis between the self-assessed stress and mental workload levels and smart office based physiological and beha-vioral data was performed (prediction of ‘labels 1’ with ‘dataset A’). The models utilized radial basis function (RBF) kernel support vector ma-chines (SVM). For this purpose, a model was built for each self-assessed score using all features extracted from the experiment data. The models were validated following a 10-fold CV approach and their correlation coefficients (r) and Mean Absolute Errors (MAE) were compared. The 10-fold CV approach consists of performing a cross validation 10 different times, each time using a different partitioning of the data into training and validation sets, and then averaging the results (Gust, 2009). We searched for statistical predictability of the smart office data models comparing the results to a baseline model based on the ZeroR algorithm with a paired t-test. ZeroR is an algorithm aimed at creating prediction models based only on the distribution of the response variable and ig-noring the data attributes (Witten et al., 2011). It is commonly used as a basis of comparison for the other algorithms that have to overcome its performance to be considered useful. When it is being used for regression purposes, its error metric must be beaten. Adjusted p-values (*p<0.01, **p<0.001) were used to check for statistical significance in order to avoid Type 1 error rate due to the number of correlation analyses being run. Unless otherwise stated, the same validation approach based on 10-fold CV and t-test comparison to the corresponding ZeroR baseline classifier was used for all models in this work.
We then performed feature selection by analyzing the predictive power of each type of feature for each self-assessment score. For that purpose, we built source-specific models based on only: (1) physiolo-gical features, (2) computer use patterns, (3) facial expressions, (4) head and facial movements, and (5) body posture and movements. A RBF SVM algorithm was used to build the models.
Next, all the previous steps were repeated to build prediction models of the standardized self-assessment scores (prediction of ‘labels 2’ with ‘dataset A’). Models using all the collected data and source-specific models were created and validated.
The huge number of features coming from only five sources that are being used as attributes in this work, might result in highly collinear models which have the risk of not being optimal. To avoid this issue, we computed a Principal Component (PC) based reduced dataset ex-plaining the 95% of the variability of the whole dataset. We built and evaluated the prediction models for this PC-reduced dataset (prediction of ‘labels 1’ with ‘dataset APCA’).
3.3.2. Simulated workload condition settings
Regarding the detection of the objective mental-workload condi-tions from smart office data, we built and evaluated several classifica-tion algorithms (predicclassifica-tion of ‘labels 3’ with ‘dataset A’). In this case, as subjects were submitted to four different workload conditions, we were facing a multi-class classification problem, where a random guess classifier would yield 25% accuracy. Naïve Bayes, linear SVM, AdaBoost and C4.5 tree algorithms were selected for this purpose. As all the four conditions were considered of equal importance, the weighted versions of the area under the Receiver Operating Characteristic (ROC) curve (wROCAUC), the area under the precision-recall curve (wPRCAUC),
and F-score (wFscore) were computed for comparison, as well as the overall accuracy (Acc.) of the models. We considered the classification models useful when they beat baseline models' accuracy and ROCAUC values. This process was then repeated for the standardized condition labels (prediction of ‘labels 4’ with ‘dataset A’).
3.3.3. Change in workload condition settings
In the second approach, there were very few data instances re-presenting a workload condition change available: only 17.8% of all data instances were of this type, resulting in highly imbalanced data. This is a very common problem in health-related machine learning tasks, where a disease is a rare event, and it is very difficult to collect enough data instances representing the affected class. Usual machine learning algorithms tend to create biased models towards the majority class when being applied to imbalanced datasets, resulting in high prediction accuracies but, very low sensitivity. Notwithstanding, the main goal is often to detect the rare event, i.e. the presence of the disease or disorder.
To overcome this imbalanced data issue, alternative machine learning approaches must be used. In this work, in addition to some usual machine learning algorithms, two alternative algorithmic ap-proaches called SMOTEBoost and RUSBoost were tested aiming at im-proving models’ sensitivity. SMOTEBoost (Chawla et al., 2003), is a method that combines boosting techniques with SMOTE (Chawla et al., 2002) oversampling techniques. The objective of boosting is to create a “strong” classifier using a set of “weak” classifiers while SMOTE aims at reducing class imbalance by creating synthetic data instances to over-sample the minority class. By combining these processes iteratively, SMOTEBoost often improves the sensitivity of the models without af-fecting the overall accuracy of the models.
In contrast, the second approach, uses the combination of boosting and RUS undersampling technique to reduce class imbalance (Seiffert et al., 2010). RUS, randomly removes data instances from the majority class until a desired balance is achieved, resulting in training datasets of smaller size, and thus, greatly reducing complexity and training time of the models. Despite its simplicity, RUSBoost has demonstrated its ef-fectiveness in previous works (Van Hulse et al., 2007). Therefore, we first built condition change prediction models using usual machine learning algorithms (prediction of ‘labels 5’ with ‘dataset B’), namely, Naïve Bayes, linear SVM, AdaBoost and C4.5 tree. We evaluated the accuracy,ROCauc, PRauc, Fscore and sensitivity metrics of the models by means of a 10-fold CV approach. Next, we built models based on SMOTEBoost and RUSBoost algorithms using linear SVM and C4.5 tree as weak classifiers. This time, a 5-fold CV was used for validation purposes and the performance of the models was compared to a base-line algorithm by means of a McNemar's test.
Not all condition changes aimed to detect in the previous part imply the same risks: whereas a condition change from neutral or relaxed to stressful is an event of “high risk”, the change in the opposite direction means an improvement in the workers' status. Both events are of in-terest, being the first one necessary to be detected in order to take preventive measures, and the second one, useful to track workers' status. Thus, we aimed at detecting the direction of the condition changes previously modeled (prediction of ‘labels 6’ with ‘dataset B’). For that purpose, we built models based on Naïve Bayes, linear SVM, AdaBoost and C4.5 tree algorithms to solve the three-class classification problem (negative class: change to a more stressful condition, neutral class: no change, positive class: change to a less-stressful condition). 3.3.4. Reliable change in perceived workload levels
Finally, we performed the detection analyses for the RCIs in per-ceived task-loads for each participant. First, we built and evaluated prediction models for the reliable NasaTLX score changes from baseline (prediction of ‘labels 7’ with ‘dataset A’) (i.e. classification of data in-stances representing relaxed states vs. significant workload states) using unobtrusively collected smart office data and Naïve Bayes, linear SVM,
r SD
NasaTLX (Battiste and Bortolussi, 1988) 0.77 14.6
Table 2
AdaBoost and C4.5 tree algorithms. We repeated the process for source-specific models. Second, we performed reliable perceived task-load change detection among consecutive 5 min-length time periods using unobtrusively collected physiological and behavioral smart office data and the same algorithmic approaches as in the previous case (prediction of ‘labels 8’ with ‘dataset B’).
4. Results
This section presents the results obtained from the regression and classification models described in Section3.3, which analyze the pre-dictability of the self-reported and objective stress and workload con-dition levels from smart office data.
4.1. Self-reported stress and workload levels
Table 3(a) shows the results of the regression analyses for the self-reported scores using all features available in the first-approach dataset (prediction of ‘labels 1’ with ‘dataset A’). Valence, mental effort, effort and global NasaTLX scores were found to be strongly correlated to the smart office data while dominance and mental demand were showing mod-erate to strong correlations. Arousal, physical demand, temporal de-mand and frustration were moderately correlated to the unobtrusively collected data, whereas correlation for performance label was weak to moderate and for stress only weak. In fact, for these last two scores, enough statistical significance was not found after adjusting the p-va-lues, and therefore, they can not be considered to be predictable from the collected data.
Table 3(b) shows the prediction results for the self-assessed scores from the dataset of 82 PCs explaining the 95% of the variance of the whole dataset (prediction of ‘labels 1’ with ‘datasetAPCA’). Overall, cor-relation results are low, and none of the MAE values has shown enough statistical significance to be considered a useful model.
Table 3 (c) shows the results for the regression analyses on the standardized self-reported scores (prediction of ‘labels 2’ with ‘dataset A’). Generally speaking, the correlations obtained by these standardized scores are higher than the ones obtained using absolute values. Effort raised up to very strong correlation levels, while dominance raised to strong correlation levels. Valence, mental effort and NasaTLX were also found to be strongly correlated to the collected data. Moderate to strong correlation were found for arousal, mental demand, physical demand, temporal demand and performance, while frustration was only showing moderate correlations. Stress was the score showing the lowest corre-lations, but this time was found to correlate weak to moderately. Moreover, this time, all the scores showed statistically significant
All features with self-reported scores (a)
All PCs with self-reported scores (b)
All features with standardized scores (c)
r MAE r MAE r MAE
SAM Valence 0.71** 1.75** 0.12 2.60 0.74** 22.02** Arousal 0.56** 1.91* 0.00 2.40 0.64** 25.52** Dominance 0.66** 1.83** 0.04 2.45 0.72** 23.06** Stress Stress 0.35** 1.78 0.11 1.93 0.51** 30.80** RSME MentalEffort 0.68** 2.06** 0.06 2.75 0.73** 23.27** NasaTLX MentalDemand 0.62** 1.86** 0.01 2.45 0.68** 24.61** PhysicalDemand 0.49** 1.23** 0.16 1.40 0.61** 27.17** TemporalDemand 0.59** 2.37** 0.03 3.03 0.63** 26.83** Effort 0.75** 1.70** 0.24* 2.51 0.81** 20.24** Performance 0.50** 2.37 0.08 2.80 0.62** 26.92** Frustration 0.50** 1.70* 0.15 2.03 0.57** 28.71** NasaTLX 0.71** 16.41** 0.07 22.35 0.70** 23.23** Table 4
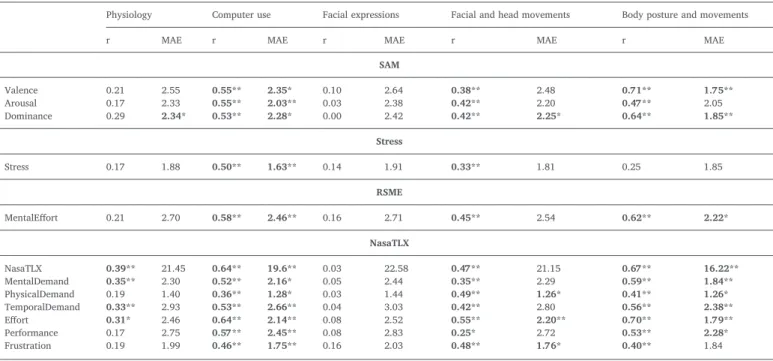
Regression results for the absolute test scores by behavioral feature type for 10-fold CV and RBF SVM (statistically significant improvement (adjusted *p < 0.01,**p < 0.001) in comparison to a baseline algorithm).
Physiology Computer use Facial expressions Facial and head movements Body posture and movements
r MAE r MAE r MAE r MAE r MAE
SAM Valence 0.21 2.55 0.55** 2.35* 0.10 2.64 0.38** 2.48 0.71** 1.75** Arousal 0.17 2.33 0.55** 2.03** 0.03 2.38 0.42** 2.20 0.47** 2.05 Dominance 0.29 2.34* 0.53** 2.28* 0.00 2.42 0.42** 2.25* 0.64** 1.85** Stress Stress 0.17 1.88 0.50** 1.63** 0.14 1.91 0.33** 1.81 0.25 1.85 RSME MentalEffort 0.21 2.70 0.58** 2.46** 0.16 2.71 0.45** 2.54 0.62** 2.22* NasaTLX NasaTLX 0.39** 21.45 0.64** 19.6** 0.03 22.58 0.47** 21.15 0.67** 16.22** MentalDemand 0.35** 2.30 0.52** 2.16* 0.05 2.44 0.35** 2.29 0.59** 1.84** PhysicalDemand 0.19 1.40 0.36** 1.28* 0.03 1.44 0.49** 1.26* 0.41** 1.26* TemporalDemand 0.33** 2.93 0.53** 2.66** 0.04 3.03 0.42** 2.80 0.56** 2.38** Effort 0.31* 2.46 0.64** 2.14** 0.08 2.52 0.55** 2.20** 0.70** 1.79** Performance 0.17 2.75 0.57** 2.45** 0.08 2.83 0.25* 2.72 0.53** 2.28* Frustration 0.19 1.99 0.46** 1.75** 0.16 2.03 0.48** 1.76* 0.40** 1.84 Table 3
Regression results for the self-reported test scores using RBF SVM algorithm for 10-fold CV (statistically significant improvement (adjusted *p < 0.01,**p <
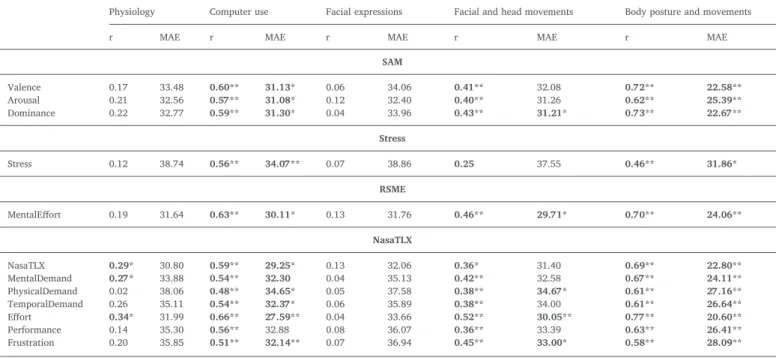
body posture and movements gained importance, as all subscores as well as the global task load index showed highest correlations with this feature type. The global score followed the same trend as the non-standardized scores, but correlations were slightly improved. Standar-dized mental demand was found to be only predictable by body posture and movements, and physical demand became most predictable with body posture and movements, followed by computer use patterns and facial and head movements. Standardized temporal demand and effort were most correlated to body posture and movements followed by computer use patterns as in the non-standardized case, but effort also showed enough statistical significance to be considered predictable by means of facial and head movements. Standardized performance scores became only predictable by the body posture and movement-based model whereas frustration gained enough statistical significance to be considered predictable by body posture and movements, computer use patterns and facial and head movements, in decreasing correlation order.
4.2. Simulated workload condition settings
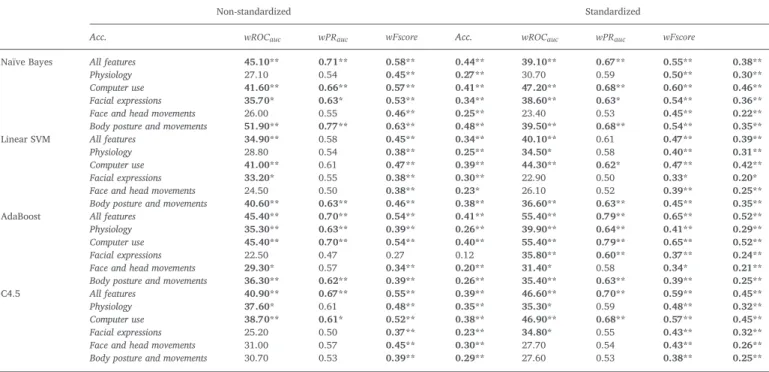
Table 6shows the results for the objective (prediction of ‘labels 3’ with ‘dataset A’) and standardized (prediction of ‘labels 4’ with ‘dataset A’) workload condition detection models using all physiological and be-havioral features and by feature type. Regarding the objective scores, overall, Naïve Bayes and AdaBoost based models were achieving the highest accuracies and the highest number of models with enough statistical significance. In fact, Naïve Bayes based models using all features, only computer use patters, only facial expressions and only body posture and movements were able to predict the workload con-dition. In the case of AdaBoost, physiological data-based models also showed statistical significance for prediction but facial expression-based model didn't. Linear SVM expression-based models were only useful using body posture and movement data, whereas C4.5 tree algorithm only resulted in statistically significant models using computer use patterns and the combination of all features.
For the standardized scores, models show improved prediction ac-curacy compared to the non-standardized scores, and more statistical significances are found. In addition to those significances found for the
Table 5
Regression results for the standardized test scores by behavioral feature type for 10-fold CV and RBF SVM (statistically significant improvement (adjusted *p < 0.01,**p < 0.001) in comparison to a baseline algorithm).
Physiology Computer use Facial expressions Facial and head movements Body posture and movements
r MAE r MAE r MAE r MAE r MAE
SAM Valence 0.17 33.48 0.60** 31.13* 0.06 34.06 0.41** 32.08 0.72** 22.58** Arousal 0.21 32.56 0.57** 31.08* 0.12 32.40 0.40** 31.26 0.62** 25.39** Dominance 0.22 32.77 0.59** 31.30* 0.04 33.96 0.43** 31.21* 0.73** 22.67** Stress Stress 0.12 38.74 0.56** 34.07** 0.07 38.86 0.25 37.55 0.46** 31.86* RSME MentalEffort 0.19 31.64 0.63** 30.11* 0.13 31.76 0.46** 29.71* 0.70** 24.06** NasaTLX NasaTLX 0.29* 30.80 0.59** 29.25* 0.13 32.06 0.36* 31.40 0.69** 22.80** MentalDemand 0.27* 33.88 0.54** 32.30 0.04 35.13 0.42** 32.58 0.67** 24.11** PhysicalDemand 0.02 38.06 0.48** 34.65* 0.05 37.58 0.38** 34.67* 0.61** 27.16** TemporalDemand 0.26 35.11 0.54** 32.37* 0.06 35.89 0.38** 34.00 0.61** 26.64** Effort 0.34* 31.99 0.66** 27.59** 0.04 33.66 0.52** 30.05** 0.77** 20.60** Performance 0.14 35.30 0.56** 32.88 0.08 36.07 0.36** 33.39 0.63** 26.41** Frustration 0.20 35.85 0.51** 32.14** 0.07 36.94 0.45** 33.00* 0.58** 28.09**
improvement in terms of prediction error compared to a baseline classifier, concluding that all scores can be predicted from smart office data after standardization.
Table 4 shows the results of the feature selection analysis for the self-reported scores (prediction of ‘labels 1’ with ‘dataset A’). Valence and dominance were best predicted by body posture and movements fol-lowed by computer use patterns. Dominance was also predictable by facial and head movements, and arousal only showed enough statistical significance for the computer use pattern-based models. Self reported stress was only found to be predictable by computer use patterns, beating the results obtained with the whole set of features. Mental effort measured by the RSME test was best predicted by the body posture and movement parameters, but was also statistically significant for the model based on computer use patters.
Next, regression results for the self-reported NasaTLX score and subscores are reviewed. The global score was best predicted by body posture and movements, followed by computer use patterns, as well as the mental and temporal demand. Performance was also predictable by computer use patterns and body posture and movements, in decreasing order. Physical demand was most correlated to facial and head move-ments, followed by body posture and movements and computer use patterns whereas effort was best predicted body posture and move-ments, computer use and facial and head movements. Finally, frustra-tion was found to be only predictable by facial and head movements, followed by computer use patterns.
Table 5 shows the results of the feature selection analysis for the standardized scores (prediction of ‘labels 2’ with ‘dataset A’). Overall, results improved, but follow the same trend. In this case, arousal be-came more predictable by means of body posture and movement-based models instead of computer use pattern-based models as in the previous case, which now occupies the second place. Standardized stress scores also showed statistically significant predictability using RBF SVM models based on only body posture and movements in addition to the one built using only computer use patterns. Standardized mental effort as measured by the RSME score was found to be predictable using only body posture and movement-, computer use pattern- and facial and head movement-based models, in decreasing order of performance. For the standardized NasaTLX questionnaire responses, models based on
non-standardized case, computer use pattern-based linear SVM and facial expression-based AdaBoost also showed prediction power. AdaBoost seems to be the best working algorithm for this case.
4.3. Change in workload condition settings
Table 7 shows the results for the workload condition change de-tection using the usual machine-learning algorithms, whereasTable 8
shows the results for the SMOTEBoost and RUSBoost algorithms aimed at dealing with class imbalance (prediction of ‘labels 5’ with ‘dataset B’). Usual algorithms gave better results than expected. Whereas some of the models showed too low sensitivities for the negative class, others where able to detect these events within an acceptable rate (≥0.60). A computer use pattern-based Naïve Bayes model showed enough statis-tical significance to accept predictability of the objective workload
changes, with a good sensitivity for the negative class. AdaBoost showed predictability of the target variable for all feature-, computer use pattern-, and body posture and movement-based models, in de-creasing order of accuracy and sensitivity. C4.5 tree was the best in predicting the condition changes with a computer-use pattern-based model, followed by a model built using all the features. Linear SVM was not showing enough statistical significance in terms of accuracy to ac-cept it was working better than a baseline model. Regarding SMOTE-Boost and RUSSMOTE-Boost models, overall, we achieved higher sensitivity rates towards the negative class: some models even yielded 100% sensitivity. Nonetheless, only two of them showed enough statistical significance to accept predictability of the workload change, which were a SMOTEBoost based model using computer use patterns and a C4.5 tree as weak classifier, and a RUSBoost based model using the combination of all features and a C4.5 tree algorithm as weak classifier.
Table 6
Classification results for the actual and standardized workload conditions by behavioral feature type for 10-fold CV (statistically significant improvement (adjusted *p<0.01, **p<0.001) in comparison to a baseline algorithm)).
Non-standardized Standardized
Acc. wROCauc wPRauc wFscore Acc. wROCauc wPRauc wFscore
Naïve Bayes All features 45.10** 0.71** 0.58** 0.44** 39.10** 0.67** 0.55** 0.38**
Physiology 27.10 0.54 0.45** 0.27** 30.70 0.59 0.50** 0.30**
Computer use 41.60** 0.66** 0.57** 0.41** 47.20** 0.68** 0.60** 0.46** Facial expressions 35.70* 0.63* 0.53** 0.34** 38.60** 0.63* 0.54** 0.36** Face and head movements 26.00 0.55 0.46** 0.25** 23.40 0.53 0.45** 0.22** Body posture and movements 51.90** 0.77** 0.63** 0.48** 39.50** 0.68** 0.54** 0.35** Linear SVM All features 34.90** 0.58 0.45** 0.34** 40.10** 0.61 0.47** 0.39**
Physiology 28.80 0.54 0.38** 0.25** 34.50* 0.58 0.40** 0.31**
Computer use 41.00** 0.61 0.47** 0.39** 44.30** 0.62* 0.47** 0.42** Facial expressions 33.20* 0.55 0.38** 0.30** 22.90 0.50 0.33* 0.20* Face and head movements 24.50 0.50 0.38** 0.23* 26.10 0.52 0.39** 0.25** Body posture and movements 40.60** 0.63** 0.46** 0.38** 36.60** 0.63** 0.45** 0.35** AdaBoost All features 45.40** 0.70** 0.54** 0.41** 55.40** 0.79** 0.65** 0.52** Physiology 35.30** 0.63** 0.39** 0.26** 39.90** 0.64** 0.41** 0.29** Computer use 45.40** 0.70** 0.54** 0.40** 55.40** 0.79** 0.65** 0.52** Facial expressions 22.50 0.47 0.27 0.12 35.80** 0.60** 0.37** 0.24** Face and head movements 29.30* 0.57 0.34** 0.20** 31.40* 0.58 0.34* 0.21** Body posture and movements 36.30** 0.62** 0.39** 0.26** 35.40** 0.63** 0.39** 0.25** C4.5 All features 40.90** 0.67** 0.55** 0.39** 46.60** 0.70** 0.59** 0.45**
Physiology 37.60* 0.61 0.48** 0.35** 35.30* 0.59 0.48** 0.32**
Computer use 38.70** 0.61* 0.52** 0.38** 46.90** 0.68** 0.57** 0.45** Facial expressions 25.20 0.50 0.37** 0.23** 34.80* 0.55 0.43** 0.32** Face and head movements 31.00 0.57 0.45** 0.30** 27.70 0.54 0.43** 0.26** Body posture and movements 30.70 0.53 0.39** 0.29** 27.60 0.53 0.38** 0.25**
Table 7
Classification results for the workload condition change by behavioral feature type for 10-fold CV (statistically significant improvement (adjusted *p < 0.01, **p < 0.001) in comparison to a baseline algorithm).
Naïve Bayes Linear SVM
Acc. ROCauc PRauc Fscore Sens. Acc. ROCauc PRauc Fscore Sens.
All features 83.30 0.80** 0.47** 0.57** 0.62** 84.84 0.74** 0.42** 0.57** 0.57**
Physiology 81.62 0.56 0.30** 0.23** 0.16** 82.20 0.50 0.18 0.00 0.00
Computer use 88.02** 0.89** 0.73** 0.70** 0.78** 84.02 0.63** 0.33** 0.40** 0.31** Facial expressions 78.24 0.62** 0.31** 0.24** 0.20** 82.17 0.50 0.18 0.00 0.00 Facial and head movements 73.05 0.63** 0.32** 0.28** 0.30** 80.91 0.55* 0.23 0.21** 0.15** Body posture and movements 80.58 0.75** 0.41** 0.46** 0.48** 79.50 0.66** 0.31** 0.44** 0.46**
AdaBoost C4.5
Acc. ROCauc PRauc Fscore Sens. Acc. ROCauc PRauc Fscore Sens.
All features 89.29** 0.90** 0.77** 0.66** 0.60** 86.56* 0.77** 0.56** 0.60** 0.58**
Physiology 82.01 0.64** 0.32** 0.01 0.00 81.60 0.52 0.22 0.06 0.04
Computer use 87.24** 0.86** 0.66** 0.58** 0.51** 90.44** 0.84** 0.69** 0.71** 0.66** Facial expressions 81.13 0.63** 0.31** 0.15** 0.05 78.27 0.53 0.24* 0.15** 0.12** Facial and head movements 80.65 0.65** 0.32** 0.11 0.08 81.00 0.56 0.23 0.06 0.04 Body posture and movements 86.53** 0.85** 0.64** 0.55** 0.48** 83.35 0.69** 0.45** 0.52** 0.50**
Note that these significances were tested by means of a McNemar's test instead of the t-test as in the other models. However, these models were not highly improving the results obtained previously with the usual algorithms.
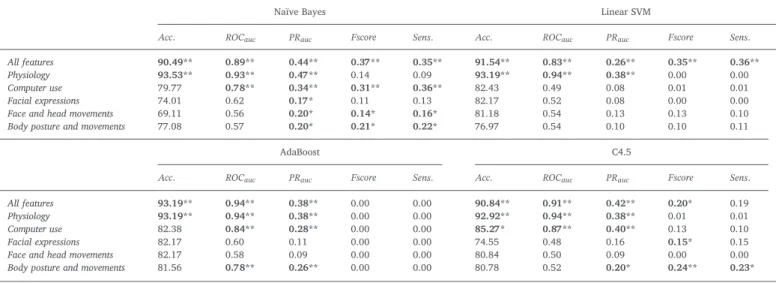
Table 9 shows the results for the task load change directionality detection (prediction of ‘labels 6’ with ‘dataset B’). AdaBoost algorithm was performing worst, as all models based on this algorithm were biased towards the majority class. Some other models were showing statistically significant improvement in terms of accuracy compared to a baseline classifier, but were performing very poor in terms of F-score and/or sensitivity, making them useless for our purpose. Only a Naïve Bayes- and a linear SVM-based model built using the combination of all features showed statistical significance for all metrics, leading us to accept their prediction power for the positive, negative and null task load changes. Nonetheless, these models were yet showing low sensi-tivity rates.
4.4. Reliable change in perceived workload levels
Table 10shows the results for the reliable perceived task load index change detection (prediction of ‘labels 7’ with ‘dataset A’ and ‘labels 8’ with ‘dataset B’). The reliably different task-loads from baseline situation (relaxing vs. stressful) were found to be detectable using models based on all features, computer use patters and body posture and movements, whereas physiology-, facial and head movement- and facial
expression-based models did not show enough statistical significance to accept the hypothesis. The highest accuracies were achieved by means of Ada-Boost and Naïve Bayes-based models, and regarding feature selection, computer use patterns were found to be more useful than body posture and movement based models. A reliable change between consecutive 5-min periods was harder to detect and fewer useful models were found. Naïve Bayes classifier was performing best by means of body posture and movement-based models, followed by computer use and facial and head movement based models. Models built using linear SVM, Ada-Boost and C4.5 algorithms were not significantly improving the de-tection accuracy achieved by a baseline classifier.
5. Discussions and conclusion
In this paper, we analyzed the possibility of predicting workers' stress and workload levels, as well as changes in these conditions, by means of time-series statistics computed from unobtrusively collected physiological and behavioral data in a smart office environment. The research questions in hands are of great interest to today's society where stress is becoming increasingly present and harmful, but are also per-tinent to the current state of the art in ambient intelligence and smart environments. Unobtrusive monitoring of peoples' behavior and phy-siology is already possible, but we yet need to associate these patterns to the disorder of interest. Moreover, it is still necessary to clarify and limit the use of the proposed system to avoid ethical and privacy issues
Table 8
Classification results for the workload condition change by behavioral feature type for 5-fold CV using SMOTEBoost and RUSBoost algorithms (statistically significant improvement (adjusted *p < 0.01, **p < 0.001) in comparison to a baseline algorithm).
SMOTEBoost RUSBoost
Acc. ROCauc PRauc Fscore Sens. Acc. ROCauc PRauc Fscore Sens.
Linear SVM All features 0.86 0.88 0.61 0.57 0.61 0.83 0.86 0.52 0.60 0.53
Physiology 0.74 0.56 0.22 0.26 0.26 0.83 0.51 0.46 0.04 1.00
Computer use 0.87 0.89 0.62 0.68 0.61 0.85 0.89 0.26 0.66 0.55
Facial expressions 0.68 0.56 0.22 0.33 0.27 0.78 0.62 0.27 0.23 0.31 Face and head movements 0.72 0.62 0.24 0.28 0.26 0.73 0.63 0.26 0.34 0.30 Body movements 0.75 0.64 0.26 0.30 0.30 0.76 0.67 0.29 0.38 0.35 C4.5 All features 0.85 0.89 0.65 0.58 0.59 0.86** 0.88** 0.60** 0.64** 0.60**
Physiology 0.77 0.65 0.28 0.25 0.30 0.78 0.62 0.29 0.36 0.38
Computer use 0.87** 0.91** 0.74** 0.66** 0.60** 0.87 0.86 0.60 0.66 0.64 Facial expressions 0.69 0.54 0.19 0.20 0.18 0.75 0.62 0.25 0.36 0.33 Face and head movements 0.73 0.63 0.23 0.22 0.23 0.74 0.64 0.25 0.26 0.26 Body movements 0.83 0.81 0.53 0.54 0.51 0.81 0.83 0.45 0.53 0.48
Table 9
Classification results for the positive, negative and null workload condition change by behavioral feature type for 10-fold CV (statistically significant improvement (adjusted *p < 0.01, **p < 0.001) in comparison to a baseline algorithm).
Naïve Bayes Linear SVM
Acc. ROCauc PRauc Fscore Sens. Acc. ROCauc PRauc Fscore Sens.
All features 90.49** 0.89** 0.44** 0.37** 0.35** 91.54** 0.83** 0.26** 0.35** 0.36** Physiology 93.53** 0.93** 0.47** 0.14 0.09 93.19** 0.94** 0.38** 0.00 0.00 Computer use 79.77 0.78** 0.34** 0.31** 0.36** 82.43 0.49 0.08 0.01 0.01 Facial expressions 74.01 0.62 0.17* 0.11 0.13 82.17 0.52 0.08 0.00 0.00 Face and head movements 69.11 0.56 0.20* 0.14* 0.16* 81.18 0.54 0.13 0.13 0.10 Body posture and movements 77.08 0.57 0.20* 0.21* 0.22* 76.97 0.54 0.10 0.10 0.11
AdaBoost C4.5
Acc. ROCauc PRauc Fscore Sens. Acc. ROCauc PRauc Fscore Sens.
All features 93.19** 0.94** 0.38** 0.00 0.00 90.84** 0.91** 0.42** 0.20* 0.19 Physiology 93.19** 0.94** 0.38** 0.00 0.00 92.92** 0.94** 0.38** 0.01 0.01 Computer use 82.38 0.84** 0.28** 0.00 0.00 85.27* 0.87** 0.40** 0.13 0.10 Facial expressions 82.17 0.60 0.11 0.00 0.00 74.55 0.48 0.16 0.15* 0.15 Face and head movements 82.17 0.58 0.09 0.00 0.00 80.84 0.50 0.09 0.00 0.00 Body posture and movements 81.56 0.78** 0.26** 0.00 0.00 80.78 0.52 0.20* 0.24** 0.23*
before is implementation (Alberdi et al., 2015). Results show that the prediction of perceived stress and workload levels is possible using change and variability patterns of data collected unobtrusively from smart offices.
A regression analysis of the target scores from smart office data showed many statistically significant results, enforcing the hypothesis that this kind of collected data can actually predict the perceived stress and workload levels. The correlations found by this analysis vary from moderate to strong, depending on the nature of the objective label. NasaTLX scores, together with effort, mental effort and valence were the best-predicted scores, whereas self-reported stress and performance didn't show enough statistical significance to be considered predictable. In case of stress prediction, this is not surprising, as this label was ac-quired by means of a single-question visual analog scale, which unlike NasaTLX, RSME or VAS questionnaires, is not a questionnaire whose reliability has been verified and might be too subjective to be well capturing the real perceived stress levels of the users. Nonetheless, the analyses on the standardized scores improved the previous results, even demonstrating predictability for the self-reported stress and perfor-mance levels. This reasserts the fact that there is some inter-subject variability present on every score used for the study, but also suggests that controlling for this variability by means of standardization methods, can make their prediction possible.
A reduced dataset using Principal Component approach showed a highly decreased performance on the predictability of the models. This might be due to several reasons. On one hand, it suggests that actual feature values are much more correlated to the self-reported scores than the PCs representing this data. On the other hand, it might also suggest that there is no much collinearity among the initial set of features. Nonetheless, the reason can also be an excessive standardization of the input data which might have provoked the loss of machine-learning algorithms' mapping ability to subject-specific response data. This can be verified by validating the previous models based on actual feature values following a Leave-One-Subject-Out Cross-Validation (LOSOCV), which is a well-known procedure in the field. LOSOCV consists of ex-cluding one participant at each time from the model-training step, while using their data in the model-testing part. This process is repeated
until all users' data is used both for training and for testing, and models' average performance is computed. This would allow to verify the us-ability of the current approach to detect stress and workload levels of new workers without the need of collecting their data. The literature shows that LOSOCV based validation usually gives much more mod-erate results (Koldijk et al., 2014). Hence, the importance of building user-specific models, models based on data from a small group of people which is as similar as possible to the final user or to build general models that can benefit from users’ feedback to adapt gradually to each of them.
Regarding feature selection analyses performed in the regression models, computer use patterns and body posture and movements are the most correlated type of behavior, followed by head and facial movements. These results agree with previous research that report a relationship between perceived stress levels and computer-use patterns (Liao et al., 2005; Vizer et al., 2009; Kolakowska, 2013; Eijckelhof et al., 2014), body posture (Arnrich et al., 2010) and head and facial movements (Liao et al., 2005). In fact, models based on only physio-logical measurements and facial expressions were never significant by themselves, while literature affirms the predictability of stress levels both from facial expressions (Dinges et al., 2005;Otsu et al., 2012;Das and Yamada) and physiological signals (Hjortskov et al., 2004;Zhai and Barreto, 2006; Al Osman et al., 2013; Sharma et al., 2013;Wijsman et al., 2013). This is an important finding, as physiological measure-ments based on SCL and ECGs are the most widely used signals in stress detection (Alberdi et al., 2015). These results suggest that behavior might be much better in predicting stress under the circumstances of this case study. However, we must first understand the nature of the experiment used to collect the data of the current study and the steps taken to process it, to interpret the results consequently. The reason why physiological signals might not be showing high correlations as usual, can be that the time-series statistics extracted from them are not reflecting an increase or decrease in the signals but the amount of ab-solute change.
The directionality of the change in physiological signals might be very important as far as stress detection is concerned. For example, it is well known that stress provokes an increase in SCL signals, or a
Table 10
Classification results for the Reliable Task Load Index Change from the relaxed state and from the previous state by feature type for 10-fold CV (statistically significant improvement (adjusted *p < 0.01, **p < 0.001) in comparison to a baseline algorithm).
RCIbaseline RCIconsecutive
Acc. ROCauc PRauc Fscore Sens. Acc. ROCauc PRauc Fscore Sens. Naïve Bayes All features 96.00** 1.00** 1.00** 0.88** 0.84** 85.77 0.79** 0.35** 0.45** 0.55**
Physiology 80.30 0.74** 0.65** 0.42** 0.35** 87.49 0.55 0.20* 0.14* 0.11 Computer use 95.00** 1.00** 1.00** 0.85** 0.79** 83.55** 0.81** 0.47** 0.47** 0.68** Facial expressions 84.00 0.85** 0.79** 0.60** 0.59** 85.42** 0.51 0.17 0.09 0.07 Head and facial movements 82.90 0.80** 0.75** 0.57** 0.56** 78.87** 0.61* 0.23** 0.21** 0.26** Body posture and movements 87.70* 0.92** 0.76** 0.77** 0.85** 84.46* 0.73** 0.33** 0.36** 0.41** Linear SVM All features 93.00** 0.86** 0.79** 0.79** 0.72** 87.04 0.63** 0.22* 0.34** 0.33**
Physiology 77.20 0.54 0.31 0.11 0.08 89.29 0.50 0.11 0.00 0.00
Computer use 90.80** 0.84** 0.72** 0.76** 0.70** 89.31 0.50 0.11 0.00 0.00 Facial expressions 73.60 0.51 0.28 0.07 0.05 89.31 0.50 0.11 0.00 0.00 Head and facial movements 79.90 0.66* 0.45* 0.41** 0.38* 88.51 0.51 0.13 0.05 0.03 Body posture and movements 89.80** 0.82** 0.71** 0.72** 0.65** 86.99 0.57* 0.17* 0.23** 0.19** AdaBoost All features 97.00** 0.98** 0.92** 0.95** 1.00** 90.39 0.88** 0.58** 0.46** 0.41** Physiology 79.90 0.75** 0.65** 0.51** 0.50** 89.19 0.71** 0.28** 0.01 0.01 Computer use 97.00** 0.98** 0.92** 0.95** 1.00** 89.04 0.81** 0.42** 0.19* 0.15 Facial expressions 73.30 0.52 0.42* 0.17 0.14 89.03 0.62** 0.20** 0.01 0.01 Head and facial movements 81.20 0.85** 0.75** 0.48** 0.43** 89.03 0.65** 0.20** 0.01 0.01 Body posture and movements 84.00 0.89** 0.81** 0.58** 0.54** 88.36 0.73** 0.33** 0.17* 0.13* C4.5 All features 92.50** 0.99** 0.97** 0.80** 0.72** 87.70 0.67* 0.31** 0.26** 0.22**
Physiology 81.70 0.75** 0.61** 0.54** 0.52** 89.13 0.51 0.11 0.01 0.01 Computer use 93.00** 1.00** 0.99** 0.80** 0.71** 89.03 0.55 0.15 0.01 0.01 Facial expressions 69.40 0.58 0.43* 0.32* 0.33* 85.56* 0.47 0.13 0.04 0.04 Head and facial movements 73.20 0.68* 0.52* 0.35** 0.34** 89.18 0.51 0.11 0.00 0.00 Body posture and movements 73.80 0.63 0.45* 0.45** 0.49** 84.60** 0.54 0.21* 0.21** 0.20**