Publisher’s version / Version de l'éditeur:
HVAC&R Research : International Journal of Heating, Ventilating, Air-
Conditioning and Refrigerating Research, 5, October 4, pp. 297-316, 1999-10-01
READ THESE TERMS AND CONDITIONS CAREFULLY BEFORE USING THIS WEBSITE. https://nrc-publications.canada.ca/eng/copyright
Vous avez des questions? Nous pouvons vous aider. Pour communiquer directement avec un auteur, consultez la
première page de la revue dans laquelle son article a été publié afin de trouver ses coordonnées. Si vous n’arrivez pas à les repérer, communiquez avec nous à PublicationsArchive-ArchivesPublications@nrc-cnrc.gc.ca.
Questions? Contact the NRC Publications Archive team at
PublicationsArchive-ArchivesPublications@nrc-cnrc.gc.ca. If you wish to email the authors directly, please see the first page of the publication for their contact information.
NRC Publications Archive
Archives des publications du CNRC
This publication could be one of several versions: author’s original, accepted manuscript or the publisher’s version. / La version de cette publication peut être l’une des suivantes : la version prépublication de l’auteur, la version acceptée du manuscrit ou la version de l’éditeur.
Access and use of this website and the material on it are subject to the Terms and Conditions set forth at
Measurements of VOC adsorption/desorption characteristics of typical
interior building materials
An, Y.; Zhang, J. S.; Shaw, C. Y.
https://publications-cnrc.canada.ca/fra/droits
L’accès à ce site Web et l’utilisation de son contenu sont assujettis aux conditions présentées dans le site LISEZ CES CONDITIONS ATTENTIVEMENT AVANT D’UTILISER CE SITE WEB.
NRC Publications Record / Notice d'Archives des publications de CNRC:
https://nrc-publications.canada.ca/eng/view/object/?id=7392a5b1-4892-48f3-93b1-b936027d4da4
https://publications-cnrc.canada.ca/fra/voir/objet/?id=7392a5b1-4892-48f3-93b1-b936027d4da4
http://www.nrc-cnrc.gc.ca/irc
M e a sure m e nt s of V OC a dsorpt ion/de sorpt ion c ha ra c t e rist ic s of
t ypic a l int e rior building m a t e ria ls
N R C C - 4 2 5 9 0
A n , Y . ; Z h a n g , J . S . ; S h a w , C . Y .
O c t o b e r 1 9 9 9
A version of this document is published in / Une version de ce document se trouve dans:
HVAC&R Research : International Journal of Heating, Ventilating, Air-
Conditioning and Refrigerating Research,
5, (4), October, pp. 297-316, October
01, 1999
The material in this document is covered by the provisions of the Copyright Act, by Canadian laws, policies, regulations and international agreements. Such provisions serve to identify the information source and, in specific instances, to prohibit reproduction of materials without written permission. For more information visit http://laws.justice.gc.ca/en/showtdm/cs/C-42
Les renseignements dans ce document sont protégés par la Loi sur le droit d'auteur, par les lois, les politiques et les règlements du Canada et des accords internationaux. Ces dispositions permettent d'identifier la source de l'information et, dans certains cas, d'interdire la copie de documents sans permission écrite. Pour obtenir de plus amples renseignements : http://lois.justice.gc.ca/fr/showtdm/cs/C-42
VOL.
5,
No.4 HVAC&R RESEARCH OCTOE ER 1999Measurements of VOC
AdsorptionlDesorption Characteristics of
Typical Interior Building Materials
Y. An, Ph.D.
J.S. Zhang
Member ASHRAE
C.Y.Shaw
Member ASHRAEThe adsorption/desorptiona/volatile organic compounds (VOCs) on interior building materiaL surfaces (i.e., the sink effect) can affect the VOC concentrations in a building, and thus needto
he accountedfor in an indoor air quality(fAQ) prediction model.hI this study, the VOC adsorp-tiotl/desorption characteristics (sink effect) were measured for four typical interior building materials including carpet. vinyl floor tile, painted drywall, and ceiling tile. The
voes
tested were ethylbenzene. cyclohexanone, 1,4·dichlorobenzene, benzaldehyde, and dodecane. These fire VOCs wefe selected because the)' are representativeof hydrocarbons, aromatics, ketones, aldehydes, and chlorine substituted compounds. The first order reversible adsorption/desorp-tion modelwas based on the Langmuir isotherm was used to analyze the data and to determine the equilibrium constant of each YOC-malerial combination. It was found that the adsorp-tion/desorption equilibrium constant, which is a measure of the sink capacity.increased linearly with the inverseof the VOC vapor pressure. For each compound. the adsorption/desorption equilibriumconstant,and theadsorption rate constant differ significantlyamongthe/our mate-rials tested. A detailed characterization of the material structure in the micro-scaLe wouldimprovethe understanding and modeling of thesink effect in thefuture. The resultsof this study can be used to estimate the impact of sink effect on the VOC concentrations in buildings.
INTRODUCTION
Interior building materials can act as sinks to adsorb volatile organic compounds (VOCs) from indoor air and re-emit them later.'TIlis phenomenon is known as the sink effect, and can affect indoor
voe
concentrations signiticantly. One frequently used model for describing indoor sinks is a first order reversible adsorption/desorption model Langmuir-isotherm (Tichenor et aL 1991 and Levsen and Soliinger 1993). This model assumes that at a fixed エ・ュセperaturc. the
voe
adsorption ratc is proportional to the VOC concentration in the bulk air over the material surface while the desorption rate is proportional to the VOC mass adsorbed on the material surface (i.e., first-order). The model is:dM
dt (1 )
whereNtis the VOC mass adsorbed on a unit area of the adsorbent surface, C is the concentra-tion in the bulk air around the surface, andkaand kdare adsorption and desorption rate con-stants. respectively. At equilibrium, the VOC adsorption rate is equal to the VOC desorption rate:
y, An is with the mass spectrometry facility, Department of Pediatrics, Duke Unher:;ity Medical Center. Durham. North Carolina J.S. Zhang is a research officer and c.Y. Shaw is senior research officer of the Institute for Re.<;earch in COll-struction, NationalResearchCouncil. Canada.
Will
VOLli"m 5, NUMBER 4,OCTOBER1999
A
D
A Compressed llItra-clcan air cyl inder B. hオュゥ、ゥヲゥセイ amiall'flow comroller
C. Temperarure con1rolled chamber for VOC pErmeation tubes D. Test chamber (500 x 400 x ::!50 mm)
E Chamber air.sampling system
N⦅サセ
299
Figure 1. Sehemalic of the Dynamic Chamber Test System for Sink Effect Studies
desorption period started immediately after the VOC concentrations in the chamber had become equilibrium. During the desorption period, only the conditioned air was introduced into the chamber. The
voe
concentrations in this period decreased with time and eventually became undetectable.A dynamic chamber tcst system (Figure 1) was employed for the test. In the sorption period, the VOCs were generated from the
voe
permeation tubes inside aエ・ュー・イ。エオイ・セ」ッョエイッャャ・、 con-tainer(C)and carried by dry air (A). The conditioned air from a humidifier (B) was added to the VOCs !low and the total !low was introduced into a test chamber (D). In the desorption period. only conditioned air was introduced into the test chamber. In both periods, the ail' change rate for the chamber (excluding the volume of the specimen) was constant at 0.5±0.01 h· l, and the relative humidity and temperature in the chamber were maintained at 50±
2% and 23±
1°C, respectively.Itwas assumed that the VOCs in the chamber were perfectly mixed and that the mass change of each VOC in the test chamber was describedbythe mass balance equation (Tichenor et al. 1991):
(3)
where Nand L are the chamber air change rate and the specimen loading ratiolrespectively, The
NCin term in Equation (3) is the VOC concentration change per unit time due to supply air. while NC is the VOC concentration change per unit time due to the exhaust of air. The kaLe term in Equation (3) represents the VOC concentration change due to the adsorption on speci-men, while the (kaIKe}ML term represents the VOC concentration change due to the desorption from specimen. In order to exclude the sink effect of the background materials such as chamber walls, specimen holder, and wax surfaces for specimen edges. Two morc terms were added to Equation (3) to account for the VOC mass adsorbed and desorbed on tbese surfaces. Thus, the mass balance equation is:
VOLUME 5. NUMBER 4,OCTOBER1999 30J
A.Vinyl flooring tile B, Painted drywall
.
:: , " '.
.' ,.
."" ZjセG '.
.
".
...
- ."-',..
セ.-,'-C Ceiling tile D, Carpet
Figure 2. Test Materials
Table 1. Detailed Description of Test Specimen
Size, Thickness. Pn:condition
Specimen Description Storage cmXcm em Timc.h
Specimen iョセィッオウ」 made, 20,2x45.2 0,08
."
,
Holder stainless steel, and
=,._.,...,
・ャ・」エイッセーッャゥUィ・、NVinyl Commercial vinyl Stored in the laboratory for 20x45
OJ
.il flooring sheet tlooring over one yearTile
Nセ⦅
...
_-Gypsum Painted with an Stored in the laboratory for 20x 45 1.0 NLセ
Wallboard interior latex paint three months after paiming .- ----_...
. '
-Ceiling Commercial Stored in the laboratol)' for 20x45 14 48 Tile fiberboard sheet over ooe year
Carpe, Nylon fiber pile Stored in the laboratory for 20x 45 04(Fiber) 48
bounded with a over one year 0,2 (BacklOg)
styrenebutadiene latex to a jute backing
"...•.'MGセセセM⦅NL
•...
"" ".•...
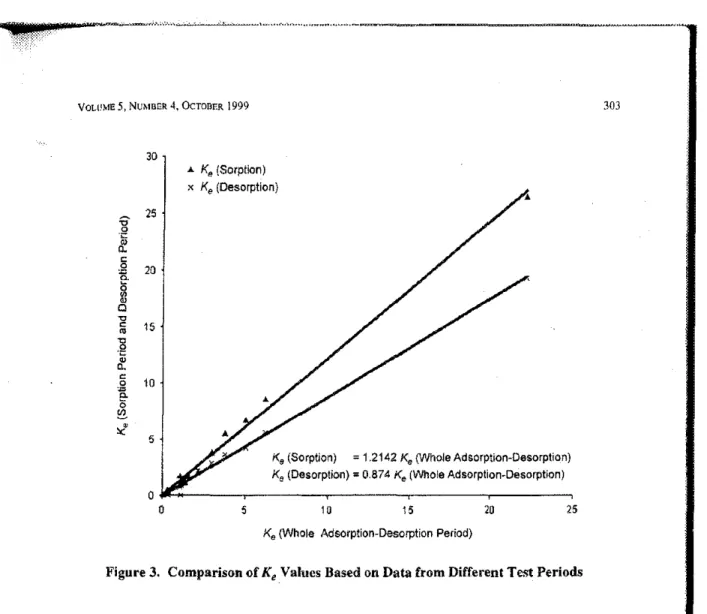
volHNャセヲe 5, NUMBER 4.OCTOBER1999 303 30 ..to. Ke(Sorption) x Ke(Desorption) 25 20 15 10 5 Ks(Sorption) =1.2142Ke (VVholea、ウッイーエゥッョセd・ウッイーエゥッョI Ke(Desorption)=0.874Ke(Wholea、ウッイーャゥッョセd・ウッイーエェッョI 25 20 15 10 5 ッBGZZ[セMセ⦅MMMMイMMMMイMMMMNNMMMMMMセo
Ke(Whole Adsorption-Desorption Period)
Figure 3. Comparison of
K
eValues Based on Data from Different Test PeriodsTable 3, K,andk.ValuesofFive VOCs with Carpet by Three Regression Methods
VOCs EB
eYH
IDeB
BZA DODSorption Period
I
k,(mh- l ) 1.62±O.21 O.40±0.O2 O.75±O.O4 O.94±O.O3 O.51±OO2
K, (m) 1.65±O.O4 2.0R±O.08 5.37±O.15 8J7±O.11 26.03±O.50
I
--Desorption Period
k,(mh-') O.33±O.O3 O.54±O.04 i, 0.49±O.O2 0.39±O.O2 O.45±O.O2
I
K,(m) O.64±O.02 2.19±O.07 I 3.54±O.OR 5.51±O.14 19.0910.56
.
_---
i--._._..
,sッイーエゥッョセd」ウッイーエゥッョ I
k.(mh- l ) O.67±O.17 0.44iO.02
:
0.60±O.03 0.57±O.04 O.42±O.01I
Ke(m) l.O5±O.07
..
2.15±O.O5 ,! 3.79±O.1O 6.22±O.22 22.2±O.5⦅Mセ
._--EXPERIMENTAL RESULTS
Figures 4A through 4£ show the measured VOC concentrations for the chamber background and the four test materials. For comparisoTl, the values using the non·sink model [Equation (7)1 are also presented. The calculatedkaandKevalues based on the data obtained from the whole adsorption-desorption period for the four materials are shown in Table 4. Table 5 presents the statistic analysis results (coefficient of detcnnination) for the application of linear sink model to theexperimental data.
VoLUME 5. NllMRER 4, OCTOBER 1999 305 Ethylbenzene Cyclohexanone QNRQ⦅BBセセᄋ 1.0J 0.8 --0.6 M 0.3 E
f
0.' o 0.4 0.2 50 100 150aoo
250 300 Elapsed tirre (h) 0.2 0.0o
50 100 150 200 250 300 8apSad tlrre (h),
ャ
セセM[[AMッN___
0.0_o
Dichlorobenzene Benzaldehyde o.a 0.0GMセM⦅M ,"-". . . .__セMMM o 50 100 150 2(X) 250 300 Sasped tlrre (h) 06 0.2.セ
セ 0.4 o 100 150 200 250 300 Elapsed tima (h) 1.2, 4.0·( M 0.8· 0..,
0.6.s
0a.•
0.2 0.0a
50 Dodecane 1.0 - ,---".__- . - .,
0.8J:
セ 0.6 セ0
0.4 • Tested No-sink model - - Sink model 0.2 o 50 tOO 150 200 250 300 Bapsed lime (hlVOLUMES,NUMBF.:R 4, OcrOBER 1999 307 E1hylbenzene Cyclohexanone 1.4 ' 1.2
·M""..,...
1.0セ
08 E. 0.6"
0.4 06li-r---,...,...
0.6Nセ 0.2 0.0'll ..
•
a 100 200 300 400 50C 600 Bapsed time (h) 500 600 100 200 300 400 Bapsocttlm.l(h) 0.2 0.0 MセMM ...セGMM __セ⦅ o Dichlorobenzene Benzaldehyde 1.2 1.0 . , .-. 0.81
0.6 () 0.4•
0.8.., _ 0.6 C.2 0.2 100 200 300 400 500 600 8apsed tirre (h) 100 200 :100 400 500 600 BasperHrre (h) oNッャMセᆳo
Aセ 0.0セMMMMセ⦅]M Mセa
Dodecane1.0'l:
0.8 . I • Tested No-sink model - - Sink model 0.2 ッNッセM⦅ᄋo
100 200 300 400 500 600 Bapsedtil'l"l$(h)VOLU/'.IE 5, NUMBER 4,OCTOBER1999
Table 4. AdsorptionlDe,orplion Equilibrium Constants for Different Te,t Materials with the Five VOCs
309
VOCs
EB
CYIIIleB
BZA
DOD
--Chamber Backgroundka(mh-1) 0.OO46±O.012 0.OO80±O.OO47 0OO80±0.OO85 0.0Il±O.OO4 0.010±0.OO5
Ke (m) 00041±0.fJ033 O.OO72±O.OOll 0.020±0.002 0.02I±O.OO3 , 9Y5,:tO.OO61
Vinyl Tile
0.14±O.06
I
0.11±O.02k[J(mh- 1)* 0.26±0.32 O.19±O.05 0.25±O.0.J
Ke (m)* 0.095±O.008 0.1610.01 OJO±O.OI 0.25±O.04 I 0.85JO.12
Painted Drywall
...
_-ka (mh-1)* 0.25±O.28 0076±O.014 0.32:t0.03 0.18±O.OJ 0.07610.005
K/«m)* 0.046±O.015 0.32±O.05 1.l3±O.06 1.25±O.07 2.93±O.25
Ceiling Tile
ka (mh-I)* 1.13±0.60 l.23±O.04 1.4010.33 1.08±O.16 0.97±O.14
Ke(m)* 0.31±O.02 I.10±0.06 1.53±O.07 l.38±O.05 5.0710.32 ._-,,--_._.
-Carpet
ka.(mh-1)>i< 0.67±O.17 0.44±O.02 0.60±0.03 0.57±O.04 0.42±O.01
Ke (m)* 1.05±O.07 2.15±O.05 3.79±O.1O 6.22±O.22 22.2±O.5
''The sil1k effect of the chamber background has bcen clIcJudcd,
Table S. Coefficient of Determination for Regression Experimental Data with Linear Sinkセャッ、・ャ
--_.•.
_-
....-._.VOCs
EB
CYHDeB
BZA
DOD
Chamber Background 0.989 0.999 0.994 0.995 0.997 VinylTile 0.990 0.999 0.999 0.992 0.997 PaintedDrywall 0.997 0.997 0.996 0.996 0.993 Ceiling Tile 0.995 0.992 0.993 0.997 0.995 Carpet 0.991 0.998 0.996 0.992 0.989 ...
----Test of Chamber Background
As shown in Hgure 4A, the measured concentrations of ethylbenzene and cyclohexanone were almost identical to that estimated by the non-sink model, indicating that the chamber back-ground did not have any sink effect for the two compounds. A very slight sink effect was observed for I,4-dichlorobenzene and benzaldehyde, while a small sink effect was observed for dodecane. The results showed that the predicted 」ッョ」・Mョエイ。エゥッョセ using the linear sink model agreed closely with the measured values for these VOCs, while the agreement with theョッョセウゥョォ
model was not as close.
TheK, values for I A-dichlorobenzene and benzaidehyde were 0.020 m and 0.02i m. respec-tively. TheK, value, for ethylbenzene and cyclohexanone were below
om
m. TheK,of dode-cane wa, 0.125 m. The,e results ,uggested that sink effecI of thc chamber background may be ignored if theKevallIe is less than 0.1 m.Test of Vinyl Floor Tile
Figure4B shows the plots ofVOC concentrations vs. time over the surface of vinyl flooring tile. Slight sink effects were observed for cyclohexanone, L4-dichlorobenzene, and benzalde-hyde. while ethylbenzene displayed a negligible sink effect. The 'ink effect for dodecane was grealer than that for the other YOCs.It is noted thaI theK, values of all five VOCs for vinyl
VOLllME 5, NnlBER 4,OCTOBER1999
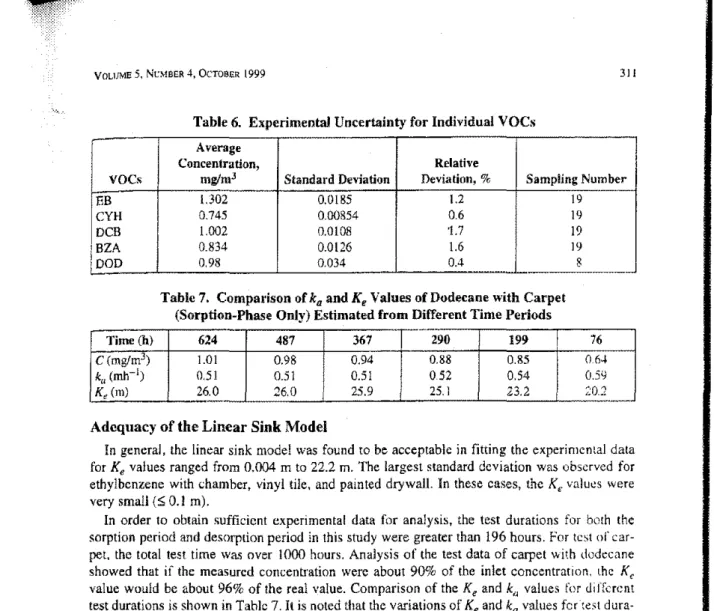
Table 6. Experimental Uncertainty for Individual VOCs
311
I
Average
Concentration, Relative
VOCs mglmJ Standard Deviation Deviation,% Sampling Number
1.302 0.0185 1.2 19 -EB
CYH
0.745 0.00854 0.6 19 DCB 1.002 0.0108 "l.7 19 BZA 0.834 0.0126 1.6 19 DOD 0.98 0.034 0.4 8 _ . _ -Table 7. Compa";son ofkaandK, Values of Dodeeane with Carpet(Sorption-Phase Only) Estimated from Differenl Time Periods
..
セNMTime (h) 624 487 367 290 199 76
C (mglmJ) 1.01 0.98 0.94 0.88 0.85 OM
k"(mh-1) 051 0.51 0.51 052 054 005<;
K, (m) 26.0 26.0 25.9 25.1 23.2 ;':0.2
Adequacy
ofthe Linear Sink Model
In general, the tinear sink model was foundtobe acceptable in fitting the experimental data for Kevalues ranged from 0.004 m to 22.2 m. The largest standard deviation was observed for
ethylbenzene with \;hamber, vinyl tile, and painted drywalL In these cases, the Kt.カ。ャオセウ were
very small($0.1 m).
In order to obtain sufficient experimental data for analysis, the test durations for both the sorption period and desorption period in this study were greater than 196 hours. For test
or
car-pet,the total test time wa'iover 1000 hours. Analysis of the test data of carpet with dodecane showed that ifthe measured concentration were about 90% of the inlet concentrarion, lhc Kc value would be about 96% of the real value. Comparison of theKeandk,.j values for Jiffnent test durations is shown in Table 7,It is noted that the variations ofKeandkavalues fcr"test、オイ。セtion greater than 199 hours were within 11%and 5% of the· real value, respectively.
K.
and
VOCVapor Pressure (Po)
The adsorption/desorption equilibrium constant Keequals the ratio of the
vce
ュLエセN[[ Jdsorhcd on a unit surface Me tovoe
concentration in the chamber air at equilibrium Ceo For aZZ[ゥhセョ Ceo a largeKevalue indicates that more VOC molecules are adsorbed on the surface. In othl:r words, a large Kevalue corresponds to a large sink capacity. Itwas found in this study that kセ J.rpar-ently depends on surface roughness and VOC vapor pressure. As shown in Figure 5, the Ke \'al-ues ofdifferent materials for individual VOCs increased in the following order:Chamber background
<
Vinyl flooring tile<
Painted drywall<
Ceiling tile<
Corper.Moreover, the Ke values of different VOCs for the same individual material incrcJ.'i..:J as follows:
Ethylhenzene
<
Cyclohexanone<
/,4-Dichlorobenzene<
Benzaldehyde<
Dodeccme. The appropriate relationship betweenK
l andPo
was based on fundamental thermodynamics.At a gas-surface equilibrium. the chemical potential Ilfl of a VOC in the gas phase is equal to its chemical potential on the adsorption surface (Atkins 1978). givenby
_
..
_
..
セNB....
BNBBBセMセMMMMMMMMMMMMMMM...
vowセAe 5,NoMBER 4. OcTOBER 1999
and
3IJ
and Equation (12) is rewritten
as:
(13 ) where,a;;;;: ajla2'Full coverage bymonolayer adsorption was assumed. Then l1sis unity and n
equalsaplpo.
10e VOCs in the test chamber \-verc assumed to be ideal gases. Their concentrations at equi· libriumCanbe converted to their pressuresby:
(14)
The VOC mass adsorbed on the surface at equilibrium was converted to the VOC adsorbate molar number by
(15)
The following equation was established:
(16)
At a given temperature,
RT
is constant. TheK
eandPo
are inversely correlated for anindivid-ual VOC, based on the Langmiuf isotherm and ideal gas conditions. For adsorption processes with VOCs at low concentrations, if no specific interaction exists between material surface and any of the VOCs, the relationship as shown in Equation (16)should apply to each of these
vacs,
Moreover,if
the standard chemical potentials in air and at the surface are assumed to be identical for all VOCs (i.e., the term a in Equation (16) is independent of Po), a linear relation-ship betweenK
eand IIPo
should be established.Figure 5 shows that such a linear correlation between Keand l/Po does ex.ist for the five
VOCs with the five material surfaces. Since the tested five VOCs represented five types of organic compounds (alkanes, ketones, aldehydes, aromatics, and chlorine-substituted com-pounds), the linear correlation indicated that the type of VOCs may not he the key issue in the sink effect in indoor environment. The actual key issue is the vapor pressure of the VOCs. The equations shown in Figure 5 may be used as a first approximation to Equation (16) under the test condition studied (i.e., 23°C and 50% rh), becauser 2> 0.9 does indicate a strong correlation.
As shown in Figure 5, the Kevalues for the five material surfaces are quite different. As the measured sampie sizes were the same for all these materials, a higher Kevalue for an indi vidual
voe
indicated a larger effective adsorption surface area (also called specific surface area). The specific surface area of a material is determined by the ュゥ」イッセウ」。ャ・ physical structure of the material including both the surface and interior structure. A detailed characterization of theュゥ」イッセウ」。Q・ structure of the materials tested to determine their セー・、ヲゥ」 surface area would improve the understanding of the VOC surption process.
Adsorption Constant
k.'llie kavalues represent the rate of the adsorption on the sink surface. As shown in Table 4 and Figure 6, the averagek.values of the five VOCs increased as: chamber background (0.008 mh .. [) <painted drywall (0.18 mh- I)セ vinyl flooring tile (0.19 mh- I)<carpet (0.54mh-l)<ceiling tile (1.16mh- I).
ACKNOWLEGEMENT
This study is funded by NRC and members of the Consortium for Material Emissions and IAQ Modeling (CMEIAQ).
NOMENCLATURE
A specimen surface area, m2 BZA benzaldehyde
C VOCconcentration (mg/mJ )inchamber at timet
ee
VOC concentration in chamber at equilibrium, mglmJCill VOC concentration of supply air, which is constant during sorption period and zero in desorption period CYH cyclohexanone DCB 1A·dichlorobenzene DOD dodecane EB ethyl benzene ka adsorption conslOmt, mh-- l kd desorption constant,h-1
K
e adsorptionJdesorption equilibrium constant, which equalskJk
J ,mL spe,dme..,o-Ioading ratio, which equals ratio of specimen surface area (m2) to the nct chamber volume
(mJ ).m"'/m3
M
voe
mass adsorbed per unit sink surface area, mg/m2Me
voe
mass adsorbed per unit sink surf:\ce area at equilibrium, mg/m2N airchange rate in thechamber,hO
.!
Po VOC saturated vapor pressure, mmHg R gas constant (8.3141K-I mol-I)
rh rclalive humidity, %
elapsedtime,h
V chamber volume, ex.eluding volume of test specimen, m3 Wmo! VOC relative molecularmass
VOLI!ME 5, NUMBliR 4,OCTOBFR1999 315
r
REFERENCES
Atkins,P.W. 1978.Physical Chemisrry.Sanfrancisco: W.H. Freeman and Company.
Black, M.S., L,M. Work, A.G.Worthan,and W.J. Pearson. 1993. Measuring the TVOCConcentrationsof Carpet Using Environmental Chambers.Indoor Air 2:401.
Axley.l.W., and D. Lorenzetti. 1993.SorptionTransportModelsfor IAQ Analysis.Modelillg{セヲ Indoor
Air Quality and Exposure.ASTM STP 1205,p. 105.
Brown. S,K., M.R. Sim, MJ. Abramson, and C.N. Gray. 1991. Progress Towards National Indoor Air QualityGoalsfor VolatileOrganicCompounds.AReport to the Air Qlwliry Commi!lee a/the Narional Health and Medical Research Council.
Chang, J.C.S" andZ. Guo. 1994.Modelingof Alkane Emissions from a WoodStain.Indoor Air4:35.
Chang, l.C.S., and L.E. Sparks.1997.Evaluation of Sink Effects on VOCs from a LatexPaint. 1. o/Air
Waste !\.fanagement480 0): 953·958.
Colomho, A., M. De Bortoli, H. Knoppel, E. Pecchio. and H.Vissers. 1993.Adsorption ofSelected Vola··
tile Organic Compounds on a Carpet, a Wall Coating, and a Gypsum bセェ。イ、 in a Test Chamber.Indoor
Air,3:276.
Dunn, H.E., and T. Chen. 1993.CriticalEvaluation of the Diffusion Hypothesis in the Theory of Porous
Media
voe
Sourcesand Sinks.Modelmg ofIndoor Air Quality and E,posure.ASTM STP 1205. p. 64.Levsen, K" and S. Sollinger. 1993.Textile-FloorCoverings as SinksfOJIndoor AirPollutants, Pror:eed·
ings ojindoor Air 2:395.
Lyman, W,J., W.F.Reehl,and D.H. Rosenblatt. 1990.Handbook oj Chemical Property Esrimatiotl Meth-ods.Washington, DC: American Chemical Society.
Tichenor,B.A., Z. Guo.lE.Dunn. L.E.Sparkii.andM.A Maiion. 1991. TheInteractionofVapor Phase