Publisher’s version / Version de l'éditeur:
ASHRAE Transactions, 102, 2, pp. 313-321, 1996
READ THESE TERMS AND CONDITIONS CAREFULLY BEFORE USING THIS WEBSITE. https://nrc-publications.canada.ca/eng/copyright
Vous avez des questions? Nous pouvons vous aider. Pour communiquer directement avec un auteur, consultez la première page de la revue dans laquelle son article a été publié afin de trouver ses coordonnées. Si vous n’arrivez pas à les repérer, communiquez avec nous à PublicationsArchive-ArchivesPublications@nrc-cnrc.gc.ca.
Questions? Contact the NRC Publications Archive team at
PublicationsArchive-ArchivesPublications@nrc-cnrc.gc.ca. If you wish to email the authors directly, please see the first page of the publication for their contact information.
NRC Publications Archive
Archives des publications du CNRC
This publication could be one of several versions: author’s original, accepted manuscript or the publisher’s version. / La version de cette publication peut être l’une des suivantes : la version prépublication de l’auteur, la version acceptée du manuscrit ou la version de l’éditeur.
Access and use of this website and the material on it are subject to the Terms and Conditions set forth at
Outdoor air delivery rates to occupants and age of air
Li, Z. H.; Zhang, J. S.; Christianson, L. L.; Kulp, R. N.; Sparks, L. E.
https://publications-cnrc.canada.ca/fra/droits
L’accès à ce site Web et l’utilisation de son contenu sont assujettis aux conditions présentées dans le site LISEZ CES CONDITIONS ATTENTIVEMENT AVANT D’UTILISER CE SITE WEB.
NRC Publications Record / Notice d'Archives des publications de CNRC:
https://nrc-publications.canada.ca/eng/view/object/?id=a858afbc-d71e-4c6d-9486-ad9ebaff3371 https://publications-cnrc.canada.ca/fra/voir/objet/?id=a858afbc-d71e-4c6d-9486-ad9ebaff3371http://www.nrc-cnrc.gc.ca/irc
Out door a ir de live ry ra t e s t o oc c upa nt s a nd a ge of a ir
N R C C - 3 7 9 0 5
A L i , Z . H . ; Z h a n g , J . S . ; C h r i s t i a n s o n , L . L . ;
K u l p , R . N . ; S p a r k s , L . E .
J a n u a r y 1 9 9 6
A version of this document is published in / Une version de ce document se trouve dans:
ASHRAE Transactions, 102, (2), pp. 313-321, 1996
The material in this document is covered by the provisions of the Copyright Act, by Canadian laws, policies, regulations and international agreements. Such provisions serve to identify the information source and, in specific instances, to prohibit reproduction of materials without
written permission. For more information visit http://laws.justice.gc.ca/en/showtdm/cs/C-42
Les renseignements dans ce document sont protégés par la Loi sur le droit d'auteur, par les lois, les politiques et les règlements du Canada et des accords internationaux. Ces dispositions permettent d'identifier la source de l'information et, dans certains cas, d'interdire la copie de
SA-96-1-2
Outdoor Air Delivery Rates
to Occupants and Age of Air
Zhenhai Li, Ph.D. Member ASHRAE Russell N. Kulp, Ph.D. Member ASHRAE Jianshun S. Zhang, Ph.D. Member ASHRAEOヲiiicセM
37
705
Leslie L. Christianson, Ph.D., P.E.
Member ASHRAE
Leslie E. Sparks, Ph.D.
Member ASHRAE
Zhenhai Li is director of the research lab at Double L Group, Peosta, Iowa. Jianshun S.Zhang is a research officer at the National Research Council of Canada, IRC, Ottawa, Ontario. Leslie L. Christianson is a professor at the University ofIllinois atUrbana-Champaign. Russ N. Kulp and Leslie E. Sparks are research officers at the Air and Energy EngineeririgResearch Laboratory, U.S. Environmental Protection
Agency, Research Triangle Park, N.C.
ABSTRACT
Asimple and accurate technique to directly measure the olltdoor air delivery rates to building occupants is presented.
A few (two to three) measurements of tracer concentrations
are sufficient for calculation. Experimental results show that
the calculated outdoor air change rates from the tracer gas
experiments agreed well with the outdoor aiJj10w rates
mea-sured independently by nozzles. A relationship between the
local outdoor air exchange rate and the mean age of air was derived.
The proposed technique provides a way of simplifying the
measurement of mean age of air and correcting experimental errors. Experimental results show that almost all the errors in the mean age a/air (a maximum 0/20% in our tests) caused
by inaccurate timing of the start of a tracer gas step-up pro-cess (tracer buildup) can be corrected by the proposed method. The underestimated ages of air in the step-down pro-cesses (tracer decay) were also successfully corrected.
INTRODUCTION
Ventilation can be considered as the introduction of clean outdoor air to occupied spaces for the purpose of controlling odors and indoor contaminants. A fundamental purpose of the heating, ventilating, and air-conditioning (HVAC)system is to distribute that outdoor air to occupied spaces properly and proportionally. So far, there is no practical way to directly measure the outdoor air delivery ratetoa particular point or to an occupant in the room, although methods that can be used to esti-mate it are available (Sandberg and Sjoberg 1983; Janssen 1984; Anderson 1988). The mean age of air at a point is defined by Sandberg and Sjoberg (1983) as the average timepassedsince the molecules at that point entered the room.Ithas been one of the major tools available for assessing ventilation effectiveness and indoor air quality. Its reciprocal has been used as the local ventilation rate (Faulkner et al. 1993; Bauman etal. 1991;
Sand-ASHRAE Transactions: Symposia
berg and Sjoberg 1983; Fisk et al. 1988; Offermann 1988). The mean age of air is a good indication of "how long" since the outdoor air left the diffusers-the freshness of the air.Itdoes not necessarily tell "how much" outdoor air a point (the sampling point or an occupant) is receiving. Techniques that can directly measure outdoor air delivery rates to building occupants are needed to assess the ventilation effectiveness in buildings.
Tracer gas techniques for measuring the mean age of air
usually take hours of measurements and require expensive
equipment. For characterizing ventilation and indoor air quality, simpler, quicker, and more economical techniques are needed. In this paper, a method for point measurements of outdoor air delivery rates is proposed. Also, a relationship between the local
mean age of air and the local outdoor air exchange rate is derived.
Met\1ods are presented to correct experimental errors in obtain-ing mean ages ofair. Theoretical analyses are validated by exper-iments.
OUTDOOR AIR DELIVERY RATE-CONCEPT AND THEORY
Consider a point in a ventilated space, point P. Define a tiny zone, zone Z. of any shape surrounding point P, with a volume
ofV. Zone Z can be infinitely small, Le.,Vgoes to zero, and the
analysis will be essentially to point P. Zone Z can be considered as a tiny zone in the following analyses for convenience. In fact, volumeVcan have any size and alltheresults are still valid.
The tracer gas step-up process (tracer build-up process-a continuous and constant flow oftracer is introduced in the supply duct [Sandberg and Sjoberg 1983]) is used for analysis, but the same results hold true for the tracer step-down (decay) process (outdoor air is introduced to ventilated spaces initially seeded uniformly with tracer). For a tracer gas step-up process, define: Co = initial tracer concentration in seeded outdoor air;
C(I) = spatial average tracer concentration in zone Z at time t; = time elapsed since the start .of tracer gas step-up.
The right side: (5)
[
f"
al,)'dl]
f"
all)dl
=Iz -
II._'-c
t _---,-_ tl V V セMエャ Cr05S- onol air low Air Outlets Point PMarked outdoor oir
with concentration Co
Occupied Spaces
--Zone Z
Air Inlet 1 Air Inlet 2 Air Inlet 3
I
I
I
Air exiting Zone Z with a concentration
of C(I)
Zone Z Incoming air
セセ」MM containing marked
outdoor oirwith
a concentration
of Co
Combining the above two equations:
[
Co - CUI)]
In Co ClI
z) = R .('2 - I,). (6)
Here R is the time average over[t" t
z].
With C(tl)'C(IZ)'and Co. measured, R can be calculaled.Integrate both sides fromt
=
t,tot=
12 (t2 >tIandtl ,tz ;:: 0): Figure 1 Diagram ofairflow into and out of ZoneZ.Seeding Assumption The tracer concentration in outdoor
air at diffuser(s) is assumed to be a step function (att=O)and the
tracer is seeded unifonnly. Room air has zero tracer
concentra-tion whent
,,0.
Marked Outdoor Air Delivery Rate (O(t)) The カッャオセ
metric flow rate of marked outdoor air into zoneZ(ftl/s [mll
s]). O(t)represents only the net marked outdoor air flowing
into zone Z that causes the amount of marked outdoor air in
zone Z to change.Itis irrelevant to the physical airflowH」ゥイ」オセ
lating) into and out of zoneZ.Itis also irrelevant to the local velocities flowing past zoneZ.Denote the time average ofOCt)
as
O.
The true mean value of0
at steady-state flow rate(assuming steady state exists) is the real outdoor air delivery
rate into zone Z.
Marked Outdoor Air Exchange Rate (R, R(t)): The marked outdoor air delivery rate to zone Z divided by zone volume,R=
0
IV,andR(t)= 0(t)1V,S-I.The true mean value of R at steady state can be considered as the local outdoor airexchange rate when zone Z is tiny.R can be obtained through a
mass balance in zone Z.
Mass Balance From the mass balance of tracer in zoneZ,
at any timet (t;:: 0),
Theャ・ヲエセィ。ョ、 side:
dC(t! O(t! . dl.
Co-C(,) =
I I
DISCUSSION OF THIS CONCEPT
Obviously, when[tt,tzlis at steady state, the true meanR value
canbeobtained whent2 - t,is sufficiently large.Insome cases, the oUldoor airflow rate changes over time (e.g.,カ。イゥ。「ャ・セ。ゥイセカッャオュ・
[YAV]systems, pulsing winds), andR does not have aウエ・。、ケセウエ。エ・
true mean value, sO only average values over time can be obtained.
Inthis case, Equation 6 canbeused to obtain such averages.
These analyses are done without preassumptions for venti-lation conditions. Therefore, Equation 6 is valid in general,
including the following cases: (I)when room air or the air in buildings is not well mixed,(2)when R does not have a steady
value-the slope of the semi-log concentration curve is not
constant, (3)when there are multiple air inlets, and (4) when
cross-flows exist between zones. No matter where the outdoor
air comes from, Equation6is valid as long as the outdoor air is marked with tracer at concentration Co.
Theウゥョァャ・セコッョ・ method, used by many researchersHgイゥュセ
srud etal. 1980; Fisket al. 1985; Bearg and Turner 1988;Janssen 1984), takes the overall slope of theウ・ュゥセャッァ curve from a tracer process as the overall air exchange rate. Itis well known that
Bキ・ャャセュゥク・、B room air is a necessity for good results (O'Neill 1990) because it uses the point (tiny zone) measurement toイ・ーイ・セ
sent a large zone or a room. Furthermore, Equation6shows that it is only the slope at theウエ・。、ケセウエ。エ・ period that is equal to the local outdoor air exchange rate for zone Z. When the slope changes, the ウゥョァャ・セコッョ・ method will yield confusing results from the overall slope.
Inthis analysis, the volume of zoneZwas not required tobe
infinitely small or to have a definite size. The analysis is true for both cases as long asC(t)represents the spatial average」ッョ」・ョエイ。セ
tion of the zone. Generally, for a zone of any size, this method can
beused to calculate the outdoor air exchange rate(R)if the spatial average concentration in that zone,C(t),can beュ・。ウセ・、N WithR
known, one can obtain the outdoor air delivery rate,
a
セ R . V.Periodsinthe Step-Up Process The marked outdoor air takes time tci reach any point in the room after seeding starts. Define this initial time delay for point P asto.Whent<to,there is no marked outdoor air flowing into zoneZ. After this initial period, a transient period is needed for the marked outdoor airflow rate,OCt),to reach its
ウエ・。、ケセウエ。エ・ value. Therefore, the marked outdoor airflow into zone
(4) (3) (2) (I) Co - Cllz) = -InCo ClI,)'
f"
dClI) =f"
Olt! . dl. It Co-Cit! It Vv
dClr) = 0(,)' lCo- Clr»)'dl
f"
dClt!'t
Co C(t! orA Tracer Gas Step-up Process
(10)
In[c'o - C'(t,)] _ In[ Co ] = R'(I - Is),
c'o c'fr) - Co - C(r)
tE steady state.
RELATIONSHIP BETWEEN THE MEAN AGE OF AIR AND OUTDOOR AIR EXCHANGE RATE
and step-down processes, respectively. With t, and t, properly chosen, one can calculateRimmediately from concentrations of two samples, C(t,) and C(t2) (plus the initial concentrationCo),
The outdoor air exchange rate(R)calculated is the average value in the interval[11' I,].As indicated, the steady-state true mean value ofR can be obtained when t2 - t, is sufficiently large. With
this methodlno fast-response gas analyzer is necessary, and three
measurements of tracer concentrations with good accuracy are sufficient. When the concentration measurements contain random errors, either more samples (C(t)), C(t4), .•.)can be used or[t1,t,]can be elongated to improve the accuracy.
Method 2-0ne·Point Method Equation Equation 7 for a step-upprocess (or Equation 9 for a step-down process) can be used tocalculatethe R value using one datumofCrt)atlarge t. The term locan be measured independently by recording the time wben the sampling point firstsees the tracer after injection. One can also estimatefo, or assume to=0, whentislarge. Although there is error in usingRIO,tfor the
truemean value, this method needs only onedatum ofC(I)plus Co'Itcan beusefulfor field applications using simple instruments.This method can only beused whenthetransient period is short or negligible.
Method 3-Linear Regression MetItod (Slope) If the data of C(t) at the steady-state period are available, regression can be used to obtain the best fit ofR value (slope) using Equation
6or 8. In this case,[I"t2]should be in the steady-state period. The slope of the semi-log concentration decay curve has been used as the overall air exchange rate (e.g., Grimsrud et aL 1980; Fisketal. 1985; Bearg and Thmer 1988;Janssen 1984). This analysis tells us that the slope can be considered as the overall air exchange rate only when the room average concentration history is close to that at the sampling point, i.e., when roomairis "well ntixed."
Age of Air and Outdoor Air Exchange Rate
From Equation 6, lettl=tsand t,= t,then (noteC(ts)=0):
Simplified Two-Period Process
The transient process of marked outdoor airflow into zone Z at the beginning makes the analysis difficult. To seek a relation-ship between the mean age of air and the outdoor air delivery rate, the tracer process is approximated by two periods. In [0,ts]'the marked outdoor airflow rate into zone Z,O(t),is assumed to stay at zero. At t=ts'it jumps to its steady-state true mean value and stays at that value(tsis called "effective start time," see Figure2). Let the concentration of this assumed process in zone Z be
Crt).In the steady-state period,C(t)= C(t). In the initial period and the transient process,C(t)follows tIte assumed two-period process. Thus, the assumed process is solely determined by the real process. Apparently, tIte only difference between the two processes is in the transient period. This model should work well if the transient process is short and vice versa.
(8) (9) 0 セ lrcnslont period ....5
'"
I -1 '0 (initial period)セ
-1.5"
,
It,
"'-t -2.5 1, I, '"&jI" -3Tracer Gas Step-Down Process
Similar to Equations6and7:
. d
C (I,)
1n-- = -R(t, - I,)
cdCt,)
where
d(t) = tracer concentration at any point of the room measured after the start of the step-down at time t,
cセ = initialtracer concentration in roomair.
and
o 10 20 30 40 50 60 70 80
Tlmo elapsed since clock starts (min)
Practical Measurements of Outdoor Air Delivery Rates
Method I-fuo-Point Method The marked outdoor air change rate,R,can be calculated from Equation 6 or 8 for step-up
Figure2 Illustration of times in a step-up process on a semi·[og curve.
Zhas threeperiods: the initial, the transient, and the steady-state period. Figure2 shows a diagram of these periods. It is a well-known fact that the slope changes at the beginning period of tracer gas processes-the transient period. Only the period during which the marked outdoorairis flowing into zoneZwith a steady flow rate is considered the steady-state period. The length of the transient period may be affected by many factors, e.g., airvelocities, crossflows between zones, size of the room, structure of the building, etc.
Inthe initial period (0, to), there is no tracer flowing into zoneZ. Based on Equation6,let t,
=
to and t2=
t:In[co
cセcエI}
= R'o.,ft-Io) 1"10' (7)Here,RIO.tis the average value of the outdoorairexchange rate in zoneZover [to,t].Itis not the same as the steady-state value. This difference will become smaller as t becomes large and the transient period becomes shorter.
For the step-down technique, at any point in the room, the mean age of air:
This equation can be used to obtainI,(e.g., by letting1=(2),
Although the two-period process is an assumed process, theR
in Equation lOis still the true mean value of the actual outdoor air exchange rate. Following a similar procedure, for a
step-down process:
The Corrected Mean Age of Air
In many cases of tracer gas experiments, itwas difficult to
determine when SF6first arrived at the diffuser in the step-up process (the actual start time). In a step-down process, it is even more difficult to determine the actual start time of the
experi-I. The proposed method can be used to measure the outdoor air delivery rates to building occupants (tiny zones) directly,
from a few concentration measurements in a tracer step-up
(or step-down) process. It can also be used to measure the mean age of air.
2. Because only a few measurements are needed to perform
the calculation accurately, the method makes it possible to establish practical and economical ventilation test
proto-cols. Expensive tracer gas analyzers needed to cover wide
ranges of concentrations (ASHRAE 1992) are not neces-sary and the tracer gas process does not need to be moni-tored for long hours. With this method, it is possible to measure the outdoor air exchange rate in YAY systems,
since it can be used to measure the average outdoor air
delivery rate over any period of time.
3. The proposed method can help to correct or remove errors in the mean age of air caused by errors in timing the start of a tracer gas process and by the transient period (e.g., in a decay process of field measurements), resulting in greater accuracy. Besides, with this method, no integration is needed.
ADVANTAGES OF THE PROPOSED TECHNIQUE
ments because it is difficult to know how much outdoor air already exists when the decay starts. This timing error will add errors directly to the mean age of air. With the conventional (direct) way of calculating the mean ages of air, there is essen-tially no method to remove this error. With the proposed method, however, this error can be calculated and removed, resulting in improved accuracy of the mean age of air.
The effective start time,Is,of the two-period tracer process has three components in an actual test:
The experimental timing error,fer'adds error directly to the
mean age ofair and it should he removed. From Equation 14, the corrected mean age of air,
,
A, (A,= Ap - I,,) is:I
A, = 10+I,+"R" (15)
The mean age of air from Equation 15 should be of better accuracy, while Equation 14 yields results (mean ages of air) closest to those calculated in the conventional way.
1. The first component is the timing error in marking the
actual start of the tracer gas process, I,rLet's define I"to be positive when the actual start time of the process is later than the recorded start time.
2. The second component,10,is the delay from the actual start time until the sampling point sees the marked outdoor air.
3. The third component is the time difference resulting from the transient period, I,. Itis from the time when the sam-pling point first sees the marked outdoor air(I"+ (0)to the
effective start point, ts'Define tt to be positive when tsis larger thanter+fo-Therefore:ts=fer+fo+ft·
(14) (13) (12)
r
Co- C(r)r,
r
-Rr,-,)
I A=
L dl=
J. dl+ e ' dl=
r +-. p o C o 0 ts S R d A =r
C (r)d. p Jo d t Co Plugging Equation 10 into Equation 12:d
InC (r) = -R'( )
cg
I-I" (II)tE steady state.
The mean age of air has been well defined (Sandherg and Sjoberg 1983). For the step-up process, at any point in the room, point P, the mean age of air:
The same result can be derived for the step-down process. This
equation shows a relationship between the mean age of air
(Ap),the local outdoor air exchange rate(R),and the effective start time (I,). As we know from practical experiments, the
marked outdoor air needs time to reach different zones of the
room. Different sampling points may also have different effec-tive start times. Errors could occur when the reciprocal of the
mean age of air is used as the local ventilation rate.
A higher mean age of air at a certain sampling point may be caused by:(I)the local outdoor air exchange rate to this point,R,
being smaller or (2) the marked outdoor air being delayed over a longer period of 10before it reaches the sampling point. In both cases, the mean age ofair at the sampling point will be higher, but
they have different practical implications.
The mean age of air at point P canhecalculated using Equa-tion 14. Clearly, the accuracy ofthe mean age ofair calculated in this way will depend on how well the transient process is approx-imated with the two-period process. Another way of calculating the mean age of air(RandI,)is to use Equation 10 to do a linear regression for the whole process (including the transient period). Although theR andI,obtained this way are approximate values
(Rwill not be the true mean value), they represent a concentra-tion history curve closer to the measured one.
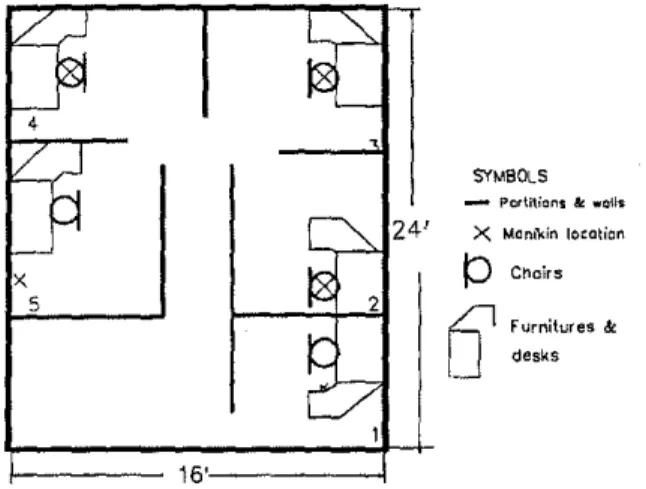
Figure3 Layoul of cubicles for the step-up lesls.
Experimental Setup
The step-down tracer gas measurements were conducted at
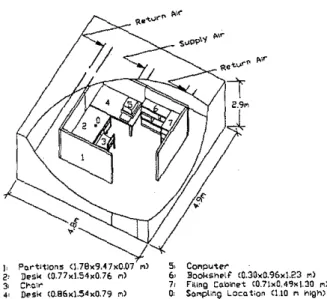
a research facility in Canada using a full-scale ventilation test room (16 by 16 by 10ft [4.8 by 4.9 by 2.9 m])containing a single office workstation (Figure 4). In the tests, mixing fans were used to mix the tracer gas with the room air to minimize the spatial nonunifonnity of tracer concentration at the beginning of the decay process. The time when the mixing fans were turned off was defined as the starting time of the decay process. All the tests were done at a 1.075 ±O.03 ACH outdoor air change rate (i.e., a
EXPERIMENTAL RESULTS WITH THE STEp·DOWN PROCESS The Corrected Mean Age of Air
In this series of tests, the flow rate of SF6was low, about 2
rnL/min. Therefore, errors in timing the actual start time of the
tests were expected. In these tests,to at the return is measured to
be about 0.5 minutes for the tests done at 5 ACH; and about I
minute at 2 ACHItwas estimated to be close to zero (neglected).
The corrected mean ages of air from Equation 15 are listed in
Table 1. (Note:Apl- t"canalsobeused instead ofAp2 - I" for
the corrected mean age of air wheneverApI is available.)
Comparing the corrected mean ages of air in Table I with
the original ones, it is clear that, at return, the corrected ones are
closer to the nominal time constant of30 minutes. Also, the mean ages of air at the return from different tests show much better
correlation with the outdoor air exchange rates at the return. A higherRvalue at the return corresponds to a lower mean age of
air (test 16) and a lowerRvalue corresponds to higher mean age
of air (test 20), indicating that the experimental errors have been successfully corrected. Therefore, Equation \5 yielded better
accuracy of the mean age of air.
In test 19,R=1.84 at return, 8% below the nominal 2 ACH.
The mean age of air should be greaterthan 30 minutes. However, because of the experimental timing error of about -4.6 minutes
(-4.\ - 0.5=-4.6 minutes), the mean age of air measured at the
return was only 28.7 minutes. The corrected one, 33.4 minutes,
agrees well withR= 1.84. Another example is test 21, whereR
=
1.98 at the return, which is close to the nominal value. Thedirect measurement method gives a mean age of air of 37.2 minutes, more than 20% higher than nominal because of the
experimental errors in timing the start. The corrected mean age
of air at return, 31.8 minutes, corrected almost all the 20% errors.
The Mean Ages of Air
The mean ages of air were calculated both by the direct
measurement approach,ApI (Sandberg and Sjoberg 1983), and
by the proposed approach (Equation 14),Ap2,in this paper. The
differences between the mean ages of air from the two methods, Ap2 - Ap \(Table I), were normally about one-half minute and
the maximum difference was about 1.3 minutes, i.e.,Ap2yielded
results close to those from Ap1. It also shows that with the
proposed method, two to three measurements can generate
results as good as real-time measurements.
SYMBOLS - Partitions '" .. ails X Mcnildnャッセ。エゥ。ョ
P
Choirs セ Furniture"&IJ
desks 24' 2 16' X 5 EXPERIMENTAL RESULTS WITH THE STEI'·UP PROCESSThe first series of tests were done in a room ventilation
simulator at a U.S. university with the step-up method. A typical rartitioned office was set up in the test room. The office was 24
by 16 ft (7.3 by 4.8 m2)with five cubicles (Figure 3). Inside each
cubicle, there was a desk and computer cabinet, a computer and monitor, a lamp, a chair, and a heated mannequin. The height of
the partitions was 1.6 m (5.24 ft). Tracer gas (SF6)was injected
and mixed in the outdoor air supply ducts. The supply diffuser is
111the center of the ceiling, and the return is on the end wall close
to the ceiling. Tracer gas concentrations were measured at four
roints-the return, the breathing zones of cubicles 2 and 4, and the center of the open region without furniture. For a detailed description of the tests, see Li et a!. (1994).
Experiment Setup
Outdoor Air Exchange Rates
The results of age of air and outdoor air change rate
measurements of the first series of tests are shown in Table
1. All the tests were done at a nominal outdoor air change rate of 2.00 ACH. The outdoor air exchange rates at the return (R) obtained by the proposed method (Equation 6) in the five tests yield an average of 1.93 ACH with a stan-dard deviation of 0.11 ACH, a 6% stanstan-dard error. This is in good agreement with the outdoor airflow rates (2.00 ACH) measured independently by a flow measurement
chamber in the outdoor air supply duct. Itshows that the
proposed method has been successfully applied to
measure outdoor air exchange rate.Itappears that the
vari-ations in the outdoor air change rates were caused mainly
by the changes in the actual outdoor airflow rate (controlled within ±5% from test to test). The accuracy of
the outdoor air exchange rate measurementsbytracer gas
is dependent on the linearity and repeatability of the
instrument, which was estimated at about ±2%.
TABLE 1 Results of Outside Airflow Rate and Age of Air
The age of air by
Corrected age of Outside air Effective start Age of air by Difference
Sandberg's
air,Ap2c change rate,R time, ts
proposed between the two
metbod,Apl
(min) (ACH) (min) metbod,Ap2 metbods
(min) (min) (min)
Test #14 (2 ACH outdoor air, low heat load, with partition, return on the ceiling)
Cubicle 2 28.83 29.5 1.94 -1.74 29.31 0.48 Door area 34.02 34.9 1.85 2.26 34.69 0.67 Return 31.57 32.3 1.92 0.77 32.09 0.52 Cubicle 4 29.63 30.3 1.95 -0.62 30.10 0.46 Average 31.01 31.8 1.92 0.17 31.55 0.54 Standard Dev. 2.00 0.04 2.08 Standard Error,% 6.46 1.95 6.59
Test 16 (2AcHoutdoor air, no heat load, without partition, return on the ceiling)
Cubicle 2 29.68 28.9 2.09 1.36 30.08 0.40 Door area 28.19 27.4 2.12 0.26 28.60 0.41 Return 30.08 29.5 2.12 2.18 30.63 0.54 Cubicle 4 29.17 28.4 2.11 1.15 29.60 0.43 Average 29.28 28.6 2.11 1.24 29.73 0.45 Standard Dev. 0.71 0.01 0.74 Standard Error,% 2.42 0.49 2.50
Test 19 (5 ACH with 2 ACH outdoor air, high heat load, with partition, return on the ceiling)
Cubicle 2 28.27 33.0 1.82 -4.88 28.35 0.08 Door area 29.10 33.8 1.83 -3.84 29.15 0.05 Return 28.66 33.4 1.84 -4.10 28.76 0.09 Cubicle 4 28.75 33.5 1.85 -3.83 28.85 0.10 Average 28.70 33.4 1.84 -4.16 28.78 0.08 Standard Dev. 0.29 0.01 0.28 Standard Error,% 1.02 0.50 0.98
Test 20 (S ACH with 2 ACH outdoor air, low heat load, with partition, return on the ceiling)
Cubicle 2 32.92 33.1 1.80 0.12 33.41 0.49 Door area 33.66 33.8 1.79 0.51 34.12 0.47 Return 33.67 34.0 1.79 0.80 34.33 0.66 Cubicle 4 33.63 34.0 1.79 0.79 34.32 0.69 Average 33.47 33.8 1.79 0.56 34.05 0.58 Standard Dev. 0.32 0.01 0.38 Standard Error,% 0.96 0.35 1.10 Test 21 (5 ACH witb 2 ACH outdoor air, bigb beat load, with partition, return on tbe wall)
Cubicle 2 36.88 31.4 1.98 6.90 38.05 1.17 Door area 37.33 31.8 1.97 7.14 38.50 1.16 Return 37.23 31.8 1.98 7.24 38.47 1.24 Cubicle 4 38.32 32.9 1.96 7.88 39.61 1.29 Average 37.44 32.0 1.97 .. 7.29 38.66 1.22 Standard Dev. 0.53 0.01 0.58 Standard Error,% 1.42 0.44 1.49
sゥオョーャゥョセ l"",ation"l.,d Iit{3. 7n.or 1,10 m, high), b (1.6n.",0.48 m,high)" (4.6[I,\If1.44m,high)
Mean Age of Air
Figure4 Configuration of the test room for step-down method.
time constant of 55.8 minutes) and a 5.38 ±D.05 ACH total air change rate. A detailed description of the test facility and exper-imental procedure can be found in Zhang et al. (1993). Table 2
summarizes the results of four repetitive tests.
CONCLUSIONS
state conditions. This means that there was already outdoor air in the room at the beginning of the decay (i.e., when the mixing fans were turned off), which would result in an under-estimation of the mean age of air. Zhang et al. (1993) found that the step-down method underestimated the mean age of air by 17% on average for the same conditions, based on II repetitive tests. This was becauseit was practically difficult to assess how much the direct method may underestimate the real mean age of air in field conditions. The negative effec-tive start time, ts'is in fact an indication of the presence of outdoor air in the room before the decay process started, which results in a possible way of correcting these errors.
The Corrected Mean Age of Air
Similar to the step-up method, the effective starting time
(ts)can be considered as consisting ofter'fo•andtt(i.e., fs == ter+to+tt)· toandtthave the same physical meaning as in the step-up method, butt" in the step-down method is due to the
initial nonuniformity of the tracer concentration and the possible disturbance of the mixing fans tothe steady room airflow pattern instead of the timing error in the step-up method. For the test conditions listed in Table 2, to was measured to be about 0.8 minutes at the return air duct;tlcan be assumed to be zero because of its negligible value. There-fore. thetsmeasured at the return air duct can be used to esti-matet" (i.e., t"=t, - 0.8 - 0.0) for each test and calculate
the corrected mean age of air as Ap2c=Ap2 - t" (note: t"<
0) for each local location.Itshould be noted that the samet"
values (calculated at the return) were used for all locations. As shown in Table 2, the corrected mean age of air (from Equation IS) at the return was 57.49 minutes on average, which is close to the nominal time constant (56.8 minutes)-a significminutes)-an t improvement in the minutes)-accurminutes)-acy of meminutes)-asuring the mean age of air. However, it should be noted that this improvement in accuracy also results in a lower repeatability, as evidenced by the larger standard deviation of Ap2e compared to the standard deviation of Ap2. This is because the error in estimating teris also added to the calculation of the mean age of air. Based on the four repetitive tests, the corrected mean ages of air (Ap2 e) had an accuracy of about +3% on average (much better than the previous 17%) and a repeatability of about ±9% based on twice the standard devi-ation. Therefore, Equation 15 did yield better accuracy of the mean age of air. More experimental results are needed to give a more accurate estimation of the accuracy and repeatability of the proposed method for calculating the corrected mean age of air.
• A technique was proposed to measure the outdoor air delivery rate to building occupants directly and accu-rately. using a few (two or three) concentration measure-ments from the tracer processes.It is a useful technique for ventilation research as well as for characterizing ventilation systems in the fields.
5> COl'lp... tel"
6, Booksheolt (O.3(hdl.96xL23 1'1)
71 FiUng Co.\)lnet (0.71:0<0,49)(1.30 I'l) 0: $O",pliI"l9 Location CUD M high)
セD
^セ
J: Po.r"tltlon5 <1,78)(9.47)(0.07 1'1) 2' Desk <O,71ltI.S4xO,76 I'l) 3: cセcャ[イG
4' Desk (0.86K1.54xO.79 f'l)
Outdoor Air Exchange Rates
As shown in Table 2, the outdoor air exchange rate(R)at the return air duct measured by the proposed method (Equation 8) was 1.06 ACH on average, which was in good agreement with the actual outdoor airflow rate of 1.075 ACH measured indepen-dently by a nozzle in the outdoor air supply ducl. The standard
deviation of the outdoor air exchange rate among the tests was
within 0.05 ACH or 5% of the outdoor air delivery rate. This means that the method formeasuring the outdoor air delivery rate has good accuracy and repeatability.
The mean average ages of air at the return air duct were 48.8 minutes and 47.0 minutes for Sandberg and Sjoberg's (1983) method (Api) and the proposed method (Ap2, Equa-tion 14), respectively. As evidenced by the standard devia-tions in Table 2, the mean age of air calculated by the proposed method has a repeatability similar to that of Sand-berg and SjoSand-berg's (1983) method. Therefore, the mean age of air obtained using this method can be equally repeatable as a relative scale for evaluating the performance of ventila-tion systems.
The averages of the mean age of air from both methods (48.8 minutes and 47.0 minutes) were less than the nominal time of the ventilation system (55.8 minutes). Both methods assume uniform initial concentration at the beginning of the decay. However, spatial nonuniformity in the initial tracer concentration is unavoidable in the actual tests since the ventilation system was operating continuously under
Locations ApI(min) Ap2 (min) R(ACH)
I
t (min)I
Ap2(min) Ap2-ApI Test 1: a 48.17 56.83 1.023 -14.17 44.48 -3.69 b 48.45 57.27 1.023 -13.73 44.92 -3.53 c 48.19 57.60 1.033 -12.83 45.25 -2.94 d 49.03 58.94 1.047 -10.72 46.59 -2.44 e 48.42 58.11 1.043 -11.77 45.76 -2.66 RA 49.62 59.45 1.023 -11.55 47.10 -2.52 Test 2: . a 46.35 56.04 1.067 -12.45 43.78 -2.57 b 48.17 58.19 1.056 -10.89 45.93 -2.24 c 47.16 56.85 1.061 -11.96 44.59 -2.57 d 48.14 58.01 1.066 . -10.54 45.75 -2.39 e 47.79 57.71 1.069 -10.68 45.45 -2.34 RA 9.16 58.94 1.032 -11.46 46.68 -2.48 Test 3: a 45.59 52.05 1.132 -8.76 44.24 -1.35 b 46.98 53.67 1.129 -7.28 45.86 -1.12 c 45.74 52.18 1.133 -8.59 44.37 -1.37 d 46.04 51.64 1.148 -8.43 43.83 -2.21 e 45.85 54.30 1.112 -7.47 46.49 0.64 RA 47.7 55.00 1.107 -7.01 47.19 -0.51 Test 4: a 44.97 52.63 1.116 -10.66 43.10 -1.87 b 46.91 54.88 1.105 -8.95 45.35 -1.56 c 46.35 54.27 1.117 -8.98 44.74 -1.61 d 45.34 52.98 1.125 -9.88 43.45 -1.89 e 46.25 53.97 1.1 15 -9.37 44.44 -1.81 RA 48.62 56.56 1.076 -8.73 47.03 -1.59 Average: a 46.27 54.39 1.085 -11.51 43.90 -2.37 b 47.63 56.00 1.078 -10.21 45.52 -2.11 c 46.86 55.22 1.086 -10.59 44.74 -2.12 d 47.14 55.39 1.097 -9.89 44.90 -2.23 e 47.08 56.02 1.085 -9.82 45.53 -1.54 RA 48.78 57.49 1.060 -9.69 47.00 -1.77 Standard deviation: a 1.39 2.40 0.049 2.33 0.61 1.01 b 0.80 2.09 0.048 . 2.77 0.47 1.05 c 1.06 2.48 0.047 2.12 0.38 0.75 d 1.73 3.62 0.048 1.04 1.50 0.25 e 1.22 2.19 0.035 1.85 0.85 1.50 RA 0.83 2.08 0.039 2.21 0.22 0.95NOTE: Outdoor air change rote: 1.08 ±O.03 ACH. Total air change rote: 5.38 ±O.QS ACH;a,b, c were inside a workstation, d and e were outside the workstation. RAstarxisfor returnair.Ap I is Sandberg and Sjoberg's method and Ap2 is the proposed method. Ap2cis the corrected age ofair.
Experimental results show that the outdoor air exchange rates calculated by this technique agreed well with the outdoor airflow rates measured independently by flow
nozzles.Itis sensitive to the actual outdoor air exchange
rate. Also, experimental errors such, as the timing of the
start of the tracer gas process, transient period, etc., have
little innuence on the calculation of the outdoor air
exchange rates.
A relationship between the outdoor air exchange rate and the mean age of air was derived. Results show that measurements of age of air can be simplified with the proposed method.
Ithas been shown that this technique can be used to
cor-rect the experimental errors and yield results more accu-rate than direct measurements of age of air. Results from
the step-up tests showed that a maximum error of 20% was successfully corrected. The underestimated ages of air in the step-down tests were also successfully
cor-rected.
REFERENCES
Anderson, R. 1988. Determination of ventilation efficiency
based upon short term tests. Effective Ventilation, 9th
AIVC Conference, Gent, Belgium, 12-15 September. ASHRAE. 1992. ASHRAE Standard 129P, Standard
meth-ods of measuring air change effectiveness (public review draft). Atlanta: American Society of Heating, Refriger-ating and Air-Conditioning Engineers, Inc.
Bauman, FS., D. Faulkner, E.A. Arens, W.I. Fisk, L.P. Johnson, P.L McNeel, D. Pih, and H. Zhang. 199\. Air
movement, comfort and ventilation in workstations.
LBL-30574. Berkeley: Center for Environmental
Design Research, University of California at Berkeley. Bearg, D.W, and WA. Turner. 1988. Determination of
out-door air quantities delivered. Building Systems: Room
Air and Air Contaminant Distribution, L.L. Christian-son, ed. Atlanta: American Society of Heating, Refriger-ating and Air-Conditioning Engineers, Inc.
Faulkner, D., W.I. Fisk, and D.P. Sullivan. 1993. Indoor air-flow and pollutant removal in a room with desktop
ven-tilation.ASHRAE Transactions 99(2).
Fisk, W.I., J. Binenboym, H. Kaboli, D.T. Grimsrud, A.W Robb, and BJ. Weber. 1985. A multi-tracer system for
measuring ventilation rates and ventilation efficiencies
in large mechanically-ventilated buildings. Ventilation
Strategies and Measurement Techniques, 6th AIVC
Conference, September 16-19, the Netherlands.
Fisk, W.I., R.J. Prill, and O. Seppanen. 1988. Commercial building ventilation measurements using multiple tracer
gases. Proceedings of the 9th AIVC Conference, 12-15
September, Belgium, vol. \, pp. 161-182.
Grimsrud, D.T., M.H. Sherman, J.E. Janssen, A.N. Pearman, and D.T. Harrje. 1980. An intercomparison of tracer
gases used for air infiltration measurements. ASHRAE
Transactions86(1): 258-267.
ASH RAETransactions: Symposia
Janssen, J.E. 1984. Ventilation stratification and air mixing. Indoor Air, vol. 5. Buildings, Ventilation and Thermal Climate, Swedish Council for Building Research.
Li,Z., L.L. Christianson, R.N. Kulp, and L.B. Sparks. 1994.
Outdoor air delivery rates and air contaminant イョッカ・セ
ment in offices.Roomvent'94, The Fourth International
Conference on Room Air Distribution.Krakow, Poland. Offermann, EJ. 1988. Ventilation effectiveness and ADPI
measurements of forced air heating system. ASHRAE
Transactions 94(1).
O'Neill, P.I. 1990. Characterizing the dynamics of a
multi-zone enclosure by identifying unknown
parame-ters using tracer gas techniques andャ・。ウエセウアオ。イ・ウ
identi-ftcation algorithms. Ph.D. Thesis. Urbana: University of Illinois at Urbana-Champaign.
Sandberg, M., and M. Sjoberg. 1983. The use of moments
for assessing air quality in ventilated rooms.Building &
Environment18(4): 9-25.
Zhang, 1.S., C.Y. Shaw, and R.I. Magee. 1993. On the accu-racy and repeatability of the pulse and step-down tracer gas methods for measuring mean ages of air. IRC!
NRCC Paper No. 360009, Canada. ASHRAE
Transac-tions 101(1).
QUESTIONS AND COMMENTS
AndrewPersily, GroupLeader,National1n5titute of Standards and Tedmology, Gaithersburg, Md.: This paper presents a
tech-nique that is mathematically identical tothe single-zone tracer gas
decay that has been around for more than 50 years, butdoesnot cite
any of these seminal references. The mass balance equation on which
it isbased, i.e., Equation I, is identical to the mass balance used to
derive the single-zonetracergas decay. Therefore, it comes as no
sur-prise that the solution (Equation 6) is also identical to thatusedin the
single-zone decay technique. However, the single-zone decay
method is restricted to situations in which thetracerconcentration is
uniform throughout the entire building being tested. It is well estab-lisbed that the application of Equation 6 in situations wbere the tracer
gasconcentration andairdistribution are not uniform (as the authors
propose) does not" yield the outdoorairdelivery rate,contradicting
this paper. Furthermore, the value ofRdetennined using Equation 6
in such a situation will be a function of time, evenifall of the airflows
in the building are constantCanthe authors comment on this?
The experimental resultsagreed very well with the independently measured airflow rates, presumably becausethe spaces that were tested appeared to be well-mixed, i.e., have uniform tracer gas concentrations.
Note the minimal variation inR ineach of the tests. (Howdoesthe
magnitude of this variation compare with the experimental
uncer-tainty?)Therefore,thisessentially single-zone technique worked well,
as it should have.Ifthe spaceshadnot been "well-mixed," then the
measurement results would not have been related to any physical
airflow rate. Can the authors comment on this?
ZhenhaiU:
321