Publisher’s version / Version de l'éditeur:
Canadian Geotechnical Journal, 27, June 3, pp. 315-319, 1990-06-01
READ THESE TERMS AND CONDITIONS CAREFULLY BEFORE USING THIS WEBSITE. https://nrc-publications.canada.ca/eng/copyright
Vous avez des questions? Nous pouvons vous aider. Pour communiquer directement avec un auteur, consultez la première page de la revue dans laquelle son article a été publié afin de trouver ses coordonnées. Si vous n’arrivez pas à les repérer, communiquez avec nous à PublicationsArchive-ArchivesPublications@nrc-cnrc.gc.ca.
Questions? Contact the NRC Publications Archive team at
PublicationsArchive-ArchivesPublications@nrc-cnrc.gc.ca. If you wish to email the authors directly, please see the first page of the publication for their contact information.
NRC Publications Archive
Archives des publications du CNRC
This publication could be one of several versions: author’s original, accepted manuscript or the publisher’s version. / La version de cette publication peut être l’une des suivantes : la version prépublication de l’auteur, la version acceptée du manuscrit ou la version de l’éditeur.
Access and use of this website and the material on it are subject to the Terms and Conditions set forth at
Thirty years of secondary consolidation in sensitive marine clay
Crawford, C. B.; Bozozuk, M.
https://publications-cnrc.canada.ca/fra/droits
L’accès à ce site Web et l’utilisation de son contenu sont assujettis aux conditions présentées dans le site LISEZ CES CONDITIONS ATTENTIVEMENT AVANT D’UTILISER CE SITE WEB.
NRC Publications Record / Notice d'Archives des publications de CNRC:
https://nrc-publications.canada.ca/eng/view/object/?id=8b0bddcc-a4d9-4a1a-aa75-f9a64acd595f https://publications-cnrc.canada.ca/fra/voir/objet/?id=8b0bddcc-a4d9-4a1a-aa75-f9a64acd595f
~ - ~ - -
Ser
TH1
National Research Conseil nationalN21d
19
I
Council Canada de recherches Canadan.
1654 c.2B L
DG.
Reprinted from
Canadian
Geotechnical
Journal
Canads
Reimpression de la
Revue
canadienne de
geotechnique
Thirty years of secondary consolidation
in
sensitive maurine
clay
C . B. CRAWFORD AND M. BOZOZUK
Volume 27 Number 3 1990
ANALYZE0
Pages 315-319
NRCC
31521
(IRC
Paper 1654)
- -L I B R A R Y
.si !Thirty years of secondary consolidation in sensitive marine clay
.C. B. CRAWFORD
Department of Civil Engineering, University of British Columbia, Vancouver, B.C., Canada V6T 1 W5
AND
M. B o z o z u ~
Geotechnical Section, Institute for Research in Construction, National Research Council of Canada, Ottawa, Ont., Canada KIA OR6
Received July 13, 1989 Accepted January 3, 1990
This case record shows that when a surface load is applied to a sensitive, normally consolidated clay, the effective stresses increase rapidly to the measured preconsolidated stresses, and remain at that level while consolidation continues for several decades. Only after more than 30 years was there an indication that the in situ effective stresses were beginning to increase to their final value. These observations have important implications with respect to the design of foundations in such areas.
Key words: consolidation, foundations, secondary consolidation, sensitive clay settlements, marine clay. Cette etude de cas dkmontre que lorsqu'une charge est appliquee
a
la surface d'une argile sensible normalement consolidke, les contraintes effectives croissent rapidement jusqu'aux contraintes de preconsolidation mesurees, et demeurent a ce niveau pendant que la consolidation se poursuit durant plusieurs decades. Ce n'est qu'aprks plus de 30 ans qu'il y avait une indicationa
I'effet que les contraintes effectives in situ commen~aient a augmenter vers leurvaleur finale. Ces observations ont des implications importantes pour la conception de fondations dans de telles regions.
Mots clPs : consolidation, fondations, consolidation secondaire, tassements dans I'argile sensible, argile marine. [Traduit par la revue] Can. Geotech. J. 27, 315-319 (1990)
Introduction
In March 1955 the National Research Council of Canada began measurement of the settlement of the new Accommo- dation Building constructed at HMCS Gloucester, a naval training station located about 20 km southeast of downtown Ottawa. The Geotechnical Section of the Institute for Research in Construction (formerly Soil Mechanics Section of the Division of Building Research) realized in this project the importance to engineering of obtaining a long-term per- formance record of a light structure o n a very compressible near normally consolidated clay soil. The resulting 33 year record showed that the consolidation of the subsoil was essentially complete and that almost all of it had occurred at constant effective stresses. The observations up to 1975 were reported in a special Laurits Bjerrum Memorial Volume published by the Norwegian Geotechnical Institute (Crawford and Burn 1976).
During the past decade there has been a rapid increase in building construction in the region south and east of Ottawa, where the soil conditions are similar to those at HMCS Gloucester. The observations at Gloucester have, therefore, become of considerable practical importance t o engineers designing similar and larger buildings in the area. This paper gives the complete history of consolidation settle- ments with some recent piezometric observations and soil tests.
The site
The site is flat and poorly drained, with the groundwater table normally at the surface during each spring period of the year. The subsoil t o a depth of 18 m is a soft, grey, sen- sitive marine clay, which lies over a harder material contain- ing fine sand and small stones. The clay was deposited in
the marine environment of the Champlain Sea at the close of the glacial period, 8000 t o 12 000 years ago. The character of the clays in the region has been reviewed by Crawford (1961) and by Penner and Burn (1978). The average natural water content is about 70070, the plasticity index is about 30%, the sensitivity ranges up to 100, and the undrained shear strength is about 35% of the preconsolidation stress (Bozozuk and Leonards 1972).
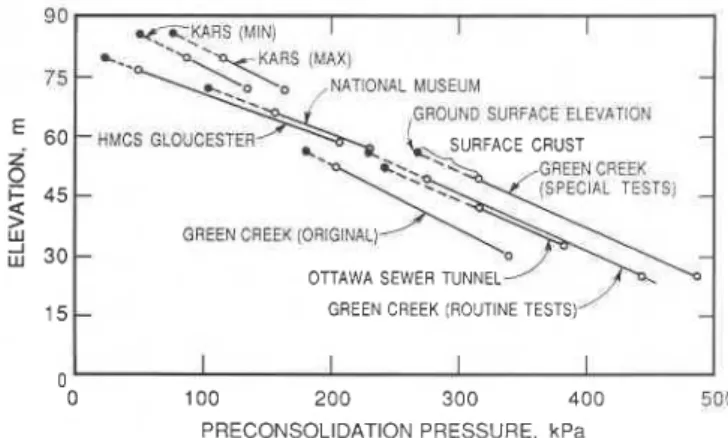
As the Champlain Sea receded much of the clay was eroded and carried away through the Ottawa - St. Lawrence river system, leaving moderately overconsolidated clays in areas near the present Ottawa River. From a study of several sites in the Ottawa region, it is clear that the natural precon- solidation stress is related to the present elevation of the sur- face, as shown in Fig. 1 (Crawford 1961). Profiles labelled Green Creek and Ottawa Sewer Tunnel were in the main channel of the postglacial Ottawa River, where it id estimated that 50-60 m of soil has been eroded, leaving an overcon- solidation of more than 300 kPa. HMCS Gloucester is t o the south of the main river channel and outside the influence of erosion. The slight overconsolidation measured at Gloucester may be due partly t o quasi preconsolidation (Leonards and Altschaeffl 1964) and (or) reserve resistance (Bjerrum 1973) and partly to periodic lowering of the groundwater table.
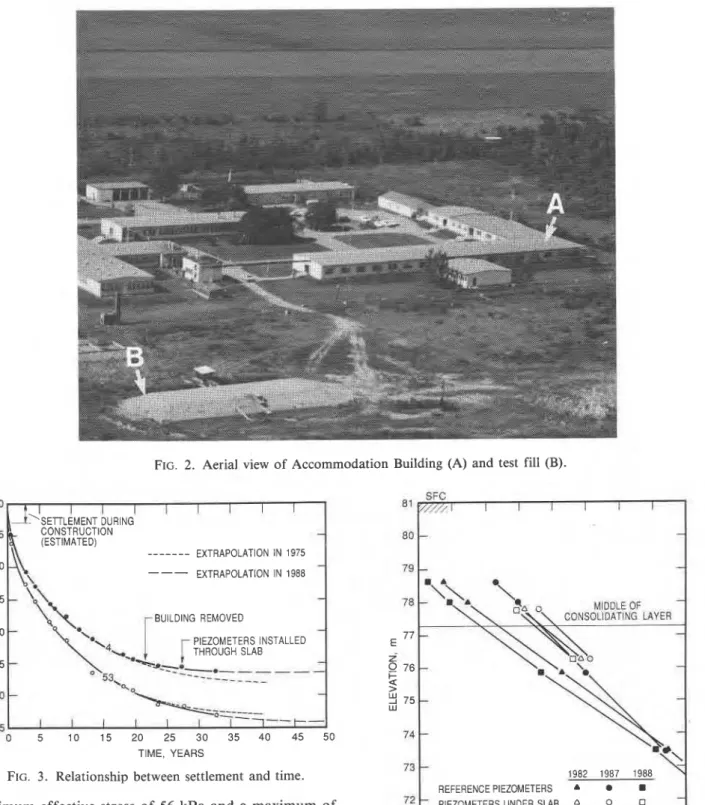
A 1968 aerial view looking west across the site is shown in Fig. 2. The Accommodation Building (A) was removed in 1976; the foundation slab was left in place and most survey points were left intact. The test fill (B) in the foreground was constructed in 1967 (Bozozuk and Leonards 1972) and has been the subject of several other publications (such as Lo et al. 1976; Law et al. 1977; Leroueil et al. 1983).
316 CAN. GEOTECH. J . VOL. 27. 1990
I I
-
HMCS GLOUCESTER-
OREEN CREEK IORIGINAt)
-
-
GREEN CREEK (ROUTINE T' - -)STSEU
0 1 0 0 2 0 0 3 0 0 4 0 0 5 0 0 PRECONSOLIDATION PRESSURE. kPa
FIG. 1. Relationship between preconsolidation stresses and elevation.
Loads and settlements
Construction of the Accommodation Building began in August 1954 with the excavation of about 1 m of surficial soils. During September and October footings were placed on original ground, foundation walls built up to slab level, and the space between filled with sand and gravel. The floor slab was then placed on a 0.2 m layer of crushed stone and the structure erected. The building was closed in by mid- December 1954. The final elevation of the floor was 1.4 m higher than the original ground surface, causing a stress increase of 33 kPa to the natural ground. The building, of very light construction, added an average of only 2 kPa pressure to the slab. The total initial increase in pressure was, therefore, 35 kPa.
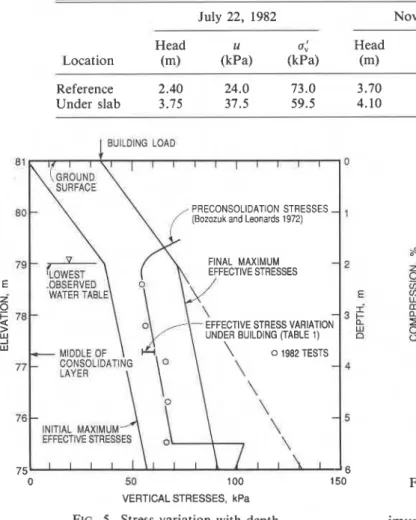
The initial level survey, carried out on March 3, 1955, and all subsequent surveys have been referenced to a nearby deep bench mark set on bedrock. Survey points established around the exterior of the building and in a grid on the floor slab have given a complete record of settlements, ranging from a maximum of 33 cm at the centre to 26 cm at the edge. Two typical time-settlement curves are shown in Fig. 3 at locations 15 m from the end of the south wing (to the left in Fig. 2). Point 53 is located on the slab 5 m from the west wall and 10 m from the east wall. Point 4 is on the outside of the west wall.
From observations on the first-stage loading of the well- instrumented Gloucester test fill where the loading is similar (Bozozuk and Leonards 1972), it was estimated that a settle- ment of 2 cm had occurred during the construction period. By back extrapolation it is evident that about 3 cm of con- solidation settlement occurred under the Accommodation Building before the initial survey. Portions of the curves in Fig. 3 were published by Crawford and Burn (1976) after 20 years of observations, with extrapolations to 40 years. The solid curves from 20-33 years show observed settlements since that time. Point 53 has settled slightly more than the extrapolated curve but point 4 has shown a decrease in the rate of settlement. This decrease is attributed to the removal of the building in 1976. Although the average pressure due to the weight of the building was only 2 kPa, almost all of the load was concentrated on the side walls because the roof was carried on full-span trusses. Based on the more extensive observations on the test fill it is concluded that most of the consolidation of the subsoil has occurred in a 3.6 m layer located from 1.9 to 5.5 m below the original surface eleva- tion at 81.0 m.
Piezometric observations
In 1965 four vertical piezometers were installed 4 m east of the building and two were pushed at an angle into the consolidating layer beneath the building. In 1967 several ref- erence piezometers were installed in the field about 100 m east of the building near the special test fill but outside the influence of any loads. It is considered that these reference piezometers give reasonable values for seasonal pore-water- pressure variations adjacent to the building. The observations up to 1975 showed that the piezometric levels in the con- solidating layer under the building were slightly greater than those adjacent to the building and averaged about 1 m higher than the values at the reference piezometers in the field.
Although the original piezometers were not installed until 10 years after the building was constructed, the pore pressures during that early period were estimated from observations made under the test fill during its first 10 years of existence (Leroueil et al. 1983). The soil conditions under
the test fill are considered to be almost identical to those under the building and the applied stress was just slightly greater under the fill. Pore pressures under the fill reached a maximum about 10 days after construction was finished. Near the top of the consolidating layer (depth 3 m) the max- imum head was about 0.6 m above original ground level and within 6 months it had dropped to about 0.1 m above. It remained at or just below this value during the following 10 years. Near the bottom of the consolidating layer (depth
5.5 m) the maximum head was about 1.6 in above original
ground level and after 6 months it was about 0.6 m above. After 1 year the head was about 0.4 m above and during the next 10 years it decreased to original ground level. From
these observations it is concluded that the ~iezometric head
under the building was just above original ground level (elevation 81 m) 6 months after the end of construction and remained at about ground level during the following decade. Once the building was removed it was possible to install vertical piezometers below the slab and this was done in 1982. Two piezometers were installed, at elevations 77.7 and 76.3 m, just above and below the middle of the consolidating soil layer. Three sets of readings under the slab and at the reference piezometers (located 100 m to the east) are shown in Fig. 4. The first set of readings was made in 1982 and the last two sets were made in November 1987 and in August 1988. Readings have been made periodically but the last two sets of readings shown are extreme, maximum and minimum, values observed since 1982. Interpolated values for piezo- metric heads at the middle of the consolidating layer at the two locations are recorded in Table 1 and these are converted to pore pressures and effective stresses for the three sets of readings.
Stress profiles
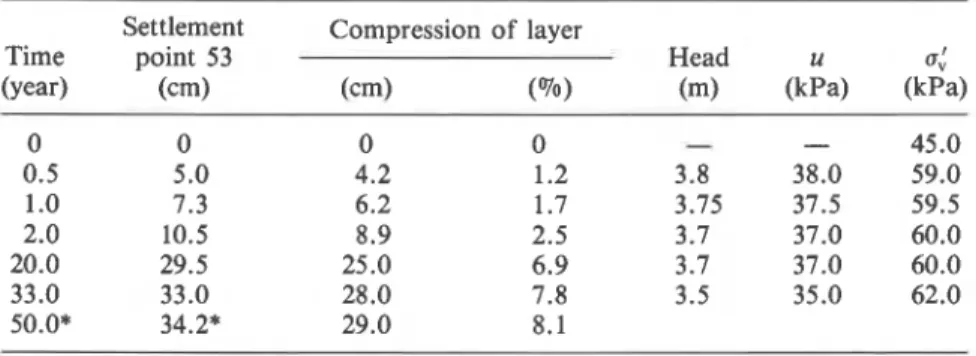
The stress profiles in Fig. 5 show initial maximum effec- tive stresses and the additional stresses caused by the building construction. The preconsolidation stresses are those reported by Bozozuk and Leonards (1972) and confirmed by additional tests reported by Leroueil et al. (1983). The initial effective stresses were calculated using the lowest observed groundwater level and the final maximum stresses that would occur under the building if all excess pore pressures were dissipated.
Piezometric observations under the building since 1982, interpolated to the middle of the consolidating layer, show
CRAWFORD AND BOZOZUK 317
FIG. 2. Aerial view of Accommodation Building (A) and test fill (B).
'SETLEMENT DURING - - -
-
- - - EXTRAPOLATION IN 1975 106
EXTRAPOLATION IN 1988-
BUILDING REMOVED-
PIEZOMETERS INSTALLED V) THROUGH SLAB 25-
30 --
I I -+-
35 0 5 10 15 20 25 30 35 40 45 50 TIME, YEARSFIG. 3 . Relationship between settlement and time.
a minimum effective stress of 56 kPa and a maximum of
62 kPa, the latter value being about equal to the precon- solidation stress at that level. Leroueil et al. (1983) estimated that the in situ preconsolidation pressure at a depth of 3 m was between 55 and 60 kPa. Both the original ground surface and the middle of the consolidating layer have settled since
1955 but this has not significantly affected the stress pro- files shown in Fig. 5.
According to Table 1, the piezometric head under the slab is always greater than the head at the reference piezometers. In a dry year (1988) the difference was 1.7 m and in a wet year (1987) it was 0.4 m. The average difference is about 1 m and this reduces the average vertical effective stress in the middle of the compressible layer below the slab by about
10 kPa. The "final maximum effective stress" shown in
71 1 I I I I I I
I
0 1 2 3 4 5 6 7 8
PlEZOMETRlC HEAD, rn
FIG. 4. Relationship between piezometric head and elevation in 1982, 1987, and 1988.
Fig. 5 is almost 20 kPa greater than the present effective stress at the middle of the compressible layer. This maximum will probably not be completely achieved because the low piezometric levels are transitory and the slab inhibits sur- face evapotranspiration.
In 1982 a borehole was made through the slab near obser- vation point 53 and soil samples were obtained to assess the
318 CAN. GEOTECH. J. VOL. 27, 1990
TABLE 1. Effective stresses at middle of consolidating layer
July 22, 1982 Nov. 10, 1987 Aug. 29, 1988
Head u 4 Head u
4
Head u a:Location (m) (kPa) (kPa) (m) (kPa) (kPa) (m) (kPa) (kPa)
Reference 2.40 24.0 73.0 3.70 37.0 60.0 1.80 18.0 79.0
Under slab 3.75 37.5 59.5 4.10 41 .O 56.0 3.50 35.0 62.0
I BUILDING LOAD
PRECONSOLIDATION STRESSES
-
(Bozozuk and Leonards 1972)
FINAL MAXIMUM
-
EFFECTIVE STRESSES-
EFFECTIVE STRESS VARIATION UNDER BUILDING (TABLE 1)76
-
75 1 I
0 50 100 150
VERTICAL STRESSES, kPa FIG. 5. Stress variation with depth.
influence of long-term loading on the subsoil. Two incre- mentally loaded consolidation tests were made on adjacent specimens at five levels within the compressible layer and the averages of measured preconsolidation stresses at each level are plotted as open circles in Fig. 5. These tests con- firm that the originally measured preconsolidation stresses in the compressible layer have not been increased by the building loads. At three additional levels between elevations 75 and 73 m the average measured preconsolidation stress was about 77 kPa, slightly less than the values reported by Leroueil et al. (1983). There is no apparent explanation for these lower values.
Secondary consolidation
The analysis of settlements at various depths under the test fill by Leroueil et al. (1983) indicates that about 85% of the total compression occurs within the strata from eleva- tion 75.5 to 79.1 m. The compression of the layer shown in Table 2 is, therefore, equal to 85% of the settlements observed at point 53. Table 2 also includes calculated effective stresses based on piezometric observations. The values dur- ing the first 2 years are inferred from observations at the test fill and those for 20 years and 33 years, from observa- tions under the building.
Figure 6 shows the relationship between the maximum ver- tical effective stresses and percent compression. Values at the middle of the compressible layer are recorded in Table 2. Only a single compression curve is shown, although the max-
I -
-
VARIATION 1982 - 1988 f I I 1 10 0 20 40 60 80 100VERTICAL EFFECTIVE STRESSES, kPa
FIG. 6. Stress-compression in field and laboratory.
imum vertical effective stresses are as much as 6 kPa greater than the minimum values, depending on the season and year. The average curve of compression under incremental increases of stress in laboratory tests shown in Fig. 6 is clearly quite different from the curve measured in the field. Almost from the beginning, and certainly after the first year, consolidation has occurred essentially at a constant vertical effective stress equal to the measured preconsolidation stress. This stress appears to be a threshold value that cannot be exceeded until consolidation is essentially finished. Dur- ing this long period of secondary-type consolidation, pore pressures appear to be generated by the collapsing clay struc- ture at a rate. equivalent to their dissipation by drainage.
An alternative interpretation would suggest that primary consolidation was finished after 1 or 2 years, and that no further increases in effective stresses are to be expected. Part of the difference between present effective stresses and final maximum effective stresses shown in Fig. 5 may be explained in this way, but it seems unlikely that this will account for the entire difference. The final result will not be known for several years. The earlier paper (Crawford and Burn 1976) describes other examples of long-term consolidation under constant effective stresses.
Practical considerations
This long-term research project has demonstrated that the sensitive marine clays occurring at the higher elevations around Ottawa may consolidate for several decades under rather small construction loads. As designers never have the benefit of extensive sampling and testing such as that at
CRAWFORD AND BOZOZUK
TABLE 2. Relationship between time, compression, and effective stresses at the
middle of the layer
Settlement Compression of layer
Time point 53 Head u
4
(year) (cm) (cm) (yo) (m) (kPa)
'Extrapolated value shown in Fig. 3.
Gloucester, extreme caution must be exercised. The use of
fill to raise building grades must be done carefully because
a metre of sand o r gravel fill may often cause more stress
than the building itself. If fill is used it should extend well beyond the structure so that settlements will be reasonably uniform. If piles are used t o support the structure only, then floor slabs must be free t o move independently and measures taken t o accommodate differential movements.
Mat foundations may be used t o spread the loads and
reduce differential movements. Preloading may also be a
useful technique if time permits. The reduction in settlement
of point 4 after the building was removed suggests that even
small load reductions are useful in arresting movements.
1
ConclusionsThe purpose of this project was t o observe the response of a sensitive, highly structured clay under full-scale loading t o stresses just beyond the laboratory measured precon- solidation stress. The study has shown that under these con- ditions almost all of the consolidation has been of the "secondary type." Extrapolation of the time-settlement curves indicates that the consolidation is essentially finished
after 33 years and the rate is now only about 1 mm/year.
When surface loads were applied to this soil, the effective stresses in the ground increased rapidly to the preconsolida- tion stress level and remained constant until recently, when they appeared to begin increasing. This unusual behaviour creates difficulties in the prediction of consolidation settle- ments from laboratory tests. It is also evident that even small decreases in groundwater level can have a n important influence o n surface movements.
These long-term observations should be especially useful
at this time when the region around Gloucester is being
developed at a n increasing rate. Some settlements have already been observed, but the application of the knowledge gained at this.site should decrease the risk of similar prob- lems in the future.
Acknowledgements
The authors are grateful t o Gordon McRostie for suggest- ing this research project and to many of their colleagues at the National Research Council who assisted with the measurements over many years.
BJERRUM. L. 1973. Problems of soil mechanics and construction
on soft clays. Proceedings, 8th International Conference on Soil Mechanics and Foundation Engineering, Moscow, vol. 3, pp. 111-159.
B o z o z u ~ , M., and LEONARDS, G.A. 1972. The Gloucester test
fill. Proceedings, ASCE Specialty Conference on Performance of Earth and Earth-supported Structures, Purdue University, vol. 1, part 1, pp. 299-317.
CRAWFORD, C.B. 1961. Engineering studies of Leda clay. I n Soils
in Canada-geological pedological and engineering studies. Royal Society of Canada. Special Publication 3, pp. 200-217.
CRAWFORD, C.B., and BURN, K.N. 1976. Long-term settlements
on sensitive clay. I n Laurits Bjerrum Memorial Volume.
Norwegian Geotechnical Institute, Oslo, pp. 1 17-124.
LAW, K.T., BOZOZUK, M., and EDEN, W.J. 1977. Measured
strengths under fills on sensitive clay. Proceedings, 9th Interna- tional Conference on Soil Mechanics and Foundation Engineer- ing, Tokyo, vol. 1, pp. 187-192.
LEONARDS, G.A., and ALTSCHAEFFL, A. G. 1964. Compressibility
of clay. ASCE Journal of the Soil Mechanics and Foundations Division, 90(SM5): 133-155.
LEROUEIL, S., SAMSON, L, and B o z o z u ~ , M. 1983. Laboratory
and field determination of preconsolidation pressures at Gloucester. Canadian Geotechnical Journal, 20: 477-490.
Lo, K.Y ., Bozozu~, M., and LAW, K.T. 1976. Settlement analysis
of the Gloucester test fill. Canadian Geotechnical Journal, 13: 339-354.
PENNER, E., and BURN, K.N. 1978. Review of engineering
behaviour of marine clays in Eastern Canada. Canadian