Publisher’s version / Version de l'éditeur:
Vous avez des questions? Nous pouvons vous aider. Pour communiquer directement avec un auteur, consultez la première page de la revue dans laquelle son article a été publié afin de trouver ses coordonnées. Si vous n’arrivez pas à les repérer, communiquez avec nous à PublicationsArchive-ArchivesPublications@nrc-cnrc.gc.ca.
Questions? Contact the NRC Publications Archive team at
PublicationsArchive-ArchivesPublications@nrc-cnrc.gc.ca. If you wish to email the authors directly, please see the first page of the publication for their contact information.
https://publications-cnrc.canada.ca/fra/droits
L’accès à ce site Web et l’utilisation de son contenu sont assujettis aux conditions présentées dans le site LISEZ CES CONDITIONS ATTENTIVEMENT AVANT D’UTILISER CE SITE WEB.
Internal Report (National Research Council of Canada. Institute for Research in Construction), 1991-03
READ THESE TERMS AND CONDITIONS CAREFULLY BEFORE USING THIS WEBSITE. https://nrc-publications.canada.ca/eng/copyright
NRC Publications Archive Record / Notice des Archives des publications du CNRC :
https://nrc-publications.canada.ca/eng/view/object/?id=0ba34637-e6c4-483c-b0c4-f2a8fbc57918 https://publications-cnrc.canada.ca/fra/voir/objet/?id=0ba34637-e6c4-483c-b0c4-f2a8fbc57918
NRC Publications Archive
Archives des publications du CNRC
For the publisher’s version, please access the DOI link below./ Pour consulter la version de l’éditeur, utilisez le lien DOI ci-dessous.
https://doi.org/10.4224/20358560
Access and use of this website and the material on it are subject to the Terms and Conditions set forth at Full-scale and Small-scale Tests of Room Lining Materials
R 4 2 7 CwndlCannda n o . 606 1 lnstitute for . . . . i -Besearch in ionstruction de rechercher Canada lnstitut de recherche en construction LRC PUB
f
ull-Scale and Small-Scale Tests of Room
Lining Materials
Andrew Kim and Trevor DvckInternal Report No. 606
Date of issue: March 1991
7
L I B R A R Y
e21
Thl8 is an internal report of the lnstitute for Research in Construction. Although not ~ntended for general distribution, it may be cited as a reference in other publications
FULL-SCALE AND SMALL-SCALE TESTS OF ROOM LINING MATERIALS
by
Andrew Kim and Trevor Dyck
INTRODUCTION
Large fires usually start as small fires in a room igniting other combustibles that contribute to fire growth and often result in flashover. At flashover, the fire has the energy
to spread beyond the room of origin and thus poses a signiiicant danger. The rate at which the fire grows and its eventual size depend on the quantity and type of combustible
materials in a room. Obviously, then, one method to conml fire growth is to control the properiies of those materials.
There are several small-scale test methods which can be used to evaluate the fire performance of various room contents, including lining materials. While small-scale tests may have the benefit of lower cost, they may not always give a true picture of real fire performance. For that reason, a full-scale room burn test is proposed as the standard test to
determine the hazard of room lining materials.
This paper will compare small-scale test
data
with those of full-scale tests. Each small-scale test method will be examined carefully to evaluate its appropriateness for predicting the full-scale fire performance of various combustible materials. The paper will also list data on the fire properties of some common building materials.TEST METHODS
Seven lining materials were evaluated using three small-scale standard test methods; the International Marine Organization (IMO) test method
and
the International Standards Organization (ISO) test melhod using the ~bbertson apparatus (radiant panel apparatus), and the ASTM E906 test method using the Ohio State University Calorimeter (OSU). The same seven lining materials were alsockvaluated in full-scale m6m bum tests.The International Marine Organization (TMO) test method is based on IMO Resolution A.564(14)
"Fi
Test Procedures for Surface Flammab'ility of Bulkhead and Deck Finish Materials"1. It is similar to ASTM El317 "Standard Test Method forFlammability of Marine Surface FinishesM2. The IMO test method involves the use of the Robertson apparatus and yields the following data either directly or through calculation:
1. Heat release rate
2. Total heat release
3. Heat for sustained burning 4. Heat for ignition
5. Critical flux for extinguishment
The Robertson apparatus consists of two main assemblies, a radiant panel assembly and a specimen holder assembly. The panel is at an angle to the specimen holder so as to provide a decreasing flux field along a specimen. A pilot flame is located in front of the specimen to ignite the flammable gases that are created when the heat from the radiant panel
the temperature rise from the burning sample.
In the test, the pilot is ignited and the sample is inserted into the specimen holder. Records are made of the time to ignition, the flame front progression along the sample and the heat release from the burning material. The test is considered complete when three minutes have elapsed after the last visible flame i h m the sample surface. Based upon the m r d s kept during the test, all the parameters described in the IMO test method can be
calculated.
.
.
International Standards O r e m z a Test Method
The International Standards Organization (ISO) test method is based on the "Lateral Ignition and Flame Spread Test (LIlT) Methf13, also using the Robenson apparatus and yields the following data either directly or through calculation:
1. Critical flux for ignition 2. Surface tempe.ratuTe at ignition 3. Thermal inertiavalue
4. Flame heating parameters 5.
Flame
front velocitiesThe IS0 method consists of two procedures, one for ignition and one for flame spread. The flame spread test depends on the data from the ignition procedure.
In the ignition test, a 155 mm x 155 mm sample is used. The sample is inserted into the flux field and the time to ignition noted. Ignition is induced by a pilot flame located above the specimen holder. By adjusting the flux, an ignition time-flux profile is obtained. From the ignition time-flux profile, two parameters; viz., the critical flux for ignition and the preheat time, are calculated.
For flame spread testing, an 800 mm x 155 mm sample is used. The sample is placed in the flux field for a
certain
preheat time. The flux level is set at 10 kW/m2 greater than the minimum flux for ignition of the sample. The horizontal pilot is ignited once the preheat time has elapsed and the flame spread along the specimen is tracked. Three specimens are tested for each material.ASTM E906 Test Method
The American Society for Testing and Materials (ASTM) E906 method4, which is based upon the ASTM E906-83 "Standard Test Method for Heat
and
Visible Smoke Release Rates for Materialsand
R o d ~ c t s " ~ , involves the use of the OSU apparatus a d yields the following data through calculation:1. Heat release rate (thermopile and oxygen depletion methods) 2. Total heat release (thermo~ile
-
and oxygen de~letion-
-
methods)3. smoke release E&
-
The ASTM E-906 method uses only the thermopile method to measure the heat release rate. The apparatus was modified so that the oxygen depletion method could be used as well for this test series. Unlike the Robertson apparatus, all burning in the OSU
apparatus
is contained within its enclosure. A predetermined flow of air into the
OSU
chamber provides the oxygen needed for the sample to b m . A pilot flame is used to ignite the sample exposed to thermal radiation. Heat release data is measured in two ways. The first is similar to the Robertson apparatus in that a thermopile, located above the burning sample, measures the temperature rise. The second, which is not part of the standard, uses
a
probe, located in the chamber, to measure the quantity of C@ produced and @ depleted by the burning of the sample. Located in a duct above the chamber, a smoke monitor measures the smoke wncenuation by means of a photometer.The test consists of a 60 second preheat period in the OSU hold chamber to allow conditions to stabilize. The sample is then d e d into the chamber and is exposed to a certain thermal radiation for 10 minutes,
after
which the test is terminated.Three specimens of each material are tested in the apparatus. For this test series, only the vertical orientation was used and each of the seven materials was exposed to flux levels of 30 kWlmz and 50 kW1mz.
e Room
Burn
Test M aThis method, which is based upon the. ASTM "Proposed Method for Room Fire Test of Wall and Ceiling Materials and Assemblies"s, involves the use of a full-scale room
and
yields the following data either directly or by calculation: 1. Heat release rate (oxygen depletion method) 2. Temperature measurements in theroom
3. Smoke re.1ease rate4. Flashover time
The full-scale test is performed in a 2.4 m x 3.7 m room which contains one opening to simulate a doorway. A propane sand burner is located in a comer, opposite the doorway, and provides the s o m e for ignition in the test. Gases and smoke from the burning
nunn
aw
drawn into a hood located outside the room above the doorway.Concentrations of CO,
C@
and @, gas temperatureand
optical density are measured in the exhaust duct as well as the flow rate of the gases. Thermocouples are located inside the room at various positions on the ceiling. Two floor-mounted radiometers and one wall- mounted radiometer monitor the fluxcreated
by the burning material.The sample material is attached to three walls in the mom. The wall containing the door is excluded. The pilot for the sandburner is ignited and the propane gas flow adjusted to produce 40 kW. Five minutes later the flow is increased to produce 160 kW. Nonnally the burner is extinguished
after
15 &utes at which time the test is terminated, however, for some materials that reach flashover, the test may be terminated sooner.TEST MATERIALS
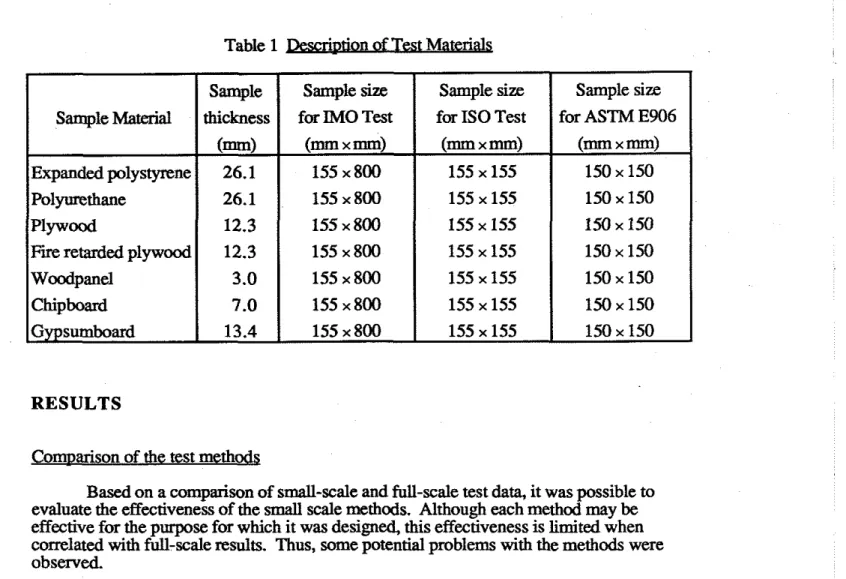
Seven typical construction materials were tested in the full-scale and small-scale tests. The seven materials are: expanded polystyrene, rigid polyurethane, plywood, fire retarded plywood, laminated woodpanel, chipboard and gypsum wallboard. The thickness of each material and the sample sizs for each test method are listed in Table 1.
Table 1
. .
Mate rialsRESULTS
Based on a comparison of small-scale and full-scale test data, it
was
possible toevaluate the effectiveness of the small scale methods. Although each method may be effective for the purpose for which it was designed, this effectiveness is limited when correlated with full-scale results. Thus, some potential problems with the methods were observed
Sample size for ASTM E906
(mm x
mm)
150 x 150 150 x 150 150 x 150 150 x 150 150 x 150 150 x 150 150 x 150IMO Test Methd - The observations
and
data for the IMO tests are summarized in Appendix A. Concerningthe
IMO test method, two important observations were made that may have a significant effect on data collected. The first observation deals with theconfiguration of the hood for obtaining heat release data. During the burning of samples that emit a great deal of flame, such as chipboard, some flames were observed outside the hood. This will affect the estimates for such parameters as Peak Heat Release Rate (PHR) and Total Heat Release (THR). The second potentiat problem concerns the stack
calibration for the Robertson apparatus. The apparatus was calibrated with the radiant panel on
and
the pilotflame
off. This flame is capable of inducing a signiticant rise in the thennopile and could be mistakenly anributed to the heat release of the specimen, especially for materials that do not bum well.Sample size
for IS0 Test (mm x m) 155 x 155 155 x 155 155 x 155 155 x 155 155 x 155 155 x 155 155 x 155 Sample Material Expanded polystyrene Polyurethane Plywood
fire retarded plywood Woodpanel
Chipboard Gypsumboard
Based on the observations noted in Appendix A, it is apparent that this method is better suited to samples that do not melt, such
as
chipboard and plywood. In those materials, the flame spread along the specimen andwas
easily observable because the sample continued to burn until all combustibles were consumed. For melting materials, suchas
polystyrene, ignition times became =cult to reproduce since the sample was no longer receiving direct heat flux. The sample was puddled in the base of the specimen holder and ignited only after the liquid became hot enough to decompose rapidly. Moreover, the ability to observe fire behaviour over different levels offlux
became impossible since, the only flaming that did occur, was at the base of the specimen holder.Sample thickness (m) 26.1 26.1 12.3 12.3 3.0 7.0 13.4 Sample size
for IMO Test
(mmx-1 155 x 800 155 x 800 155 x 800 155 x 800 155 x 800 155 x 800 155 x 800
fi0
TestM
M
-The
observations and data for the IS0 tests are summarized inAppendix B. Problems involving the IS0 test method deal mainly with the interwetation of thkkdata. Some samples posed p&cula~ difficulty for the meth& to yield realis&
calculations. For example, gypsum wallboard required a preheat time of 151 seconds according to the method. Yet this time was far too long when evaluating the paper and too short for the plaster beneath. Polyurethane presented a similar problem where parameters calculated from the data suggest a preheat time of 12 seconds. Realistically, this time is much too short for thermal equilibrium to be reached. It was observed that the data from the IS0 test method did not match well with the full-scale
room
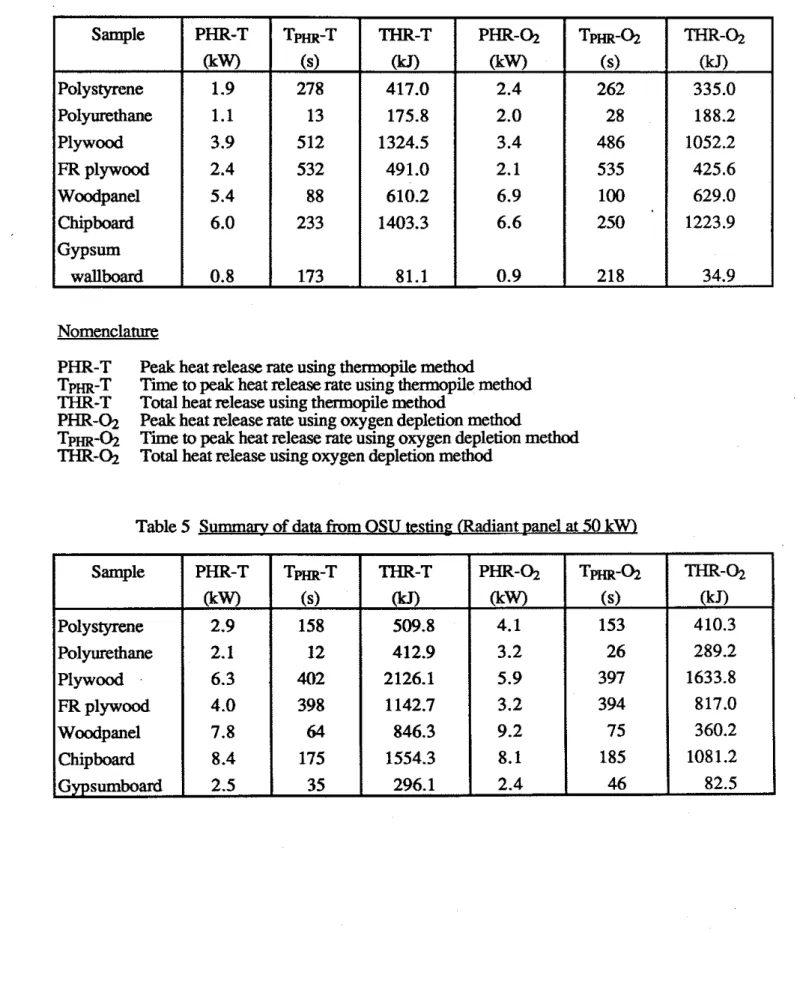
bum data.QSU Test Method -The observations and data for the OSU test are summarized in
Appendix C. Based on observations made during the test, the OSU test did not reflect any problems that might provide an obstacle in comparing data with the full-scale test results. The data available
from
tests, using both the oxygen depletion and thermopile methods, seemed to provide good correlation with full-scale results. However, it should be noted, as shown in Tables 4 and 5, that the PHR andTHR
obtained with the 50 kW exposureshowed a larger difference between materials than with 30 kW. This fact is important in the establishment of reference values.
Polystyrene burned wmpletely at both 30 kW/m2 and 50 kW/m2, but melted before ignition. Pol
F
thane ignited immediately at both fluxes but bumed better at 50 kW/m2. At 50 kW/m,
plywood bumed completely. At 30 kW/m2, charcoal remained and was burning after the test was terminated.Fii
retarded plywood bumed rather well at both fluxes, except that a sizable amount of charcoal remained after both tests. The woodpanel, beiig thin, bumed completely at 30 kW/m2 and 50 kW/m2 and displayed a sharp rise in heat release after ignition. Chipboard burned wmpletely at both 30 kW/m2 and 50 kW/m2 with only a small amount of charcoal left The paper covering on the gypsum wallboard samples quickly burned off at both fluxes and released very little heat.Test
M
M
- The observations and data from the full-scale tests aresummarized in Appendix D. In the full-scale
mom burn test, the materials that reached
flashover were p6iyurethane, plywood and chipboard. polyktyrene melted around the burner flame thus preventing flame attachment. Fire retarded plywoodrequired
seven minutes to ignite and was not able to sustain flaming. The woodpanel bumed through in the corner before reaching flashover.Summary of data
The results of each test for the seven materials are given in Appendices A, B, C and D. Each test method yields results for a large variety of parameters. To determine the correlation between the various test methods, however, it is necessary to examine
parameters that are comparable. Summary data for these parameters are given in Tables 2 to 6.
Table 2 ofm from0 W i g
Nomenclature
PHR Peak heat release rate
TPHR Time to
peak
heat release rate THR Total heat release-43
T i
to ignition Tig 6 ) 412 2 49 169 54 39 45Table 3 Surnmarv of data
from
IS0 testing Sample MaterialExpanded p0l~stYrene Polyurethane
Plywood
Fire retarded plywood Woodpanel Chipboard Gypsum
wallboard
T m6)
425 14607
560 86 256 50 PHR0
1.0 2.2 6.3 2.9 9.2 10.5 2.9go,"
Critical flux for ignition Flame heating parameterTHR
0
364.9 98.5 4454.7 1570.2 1089.4 3578.8 128.0 A E (kW/m)2h----
72.2----
15.7 33.8----
-
Sample Polystyrene Polyurethane PlywoodFR
P ~ Y w O O ~ Woodpanel Chipboard Gypsumwallboard
4*
0%.
(kwh2) 23.0 25.0 21.3 26.3 20.5 16.9 27.47
Table 4 m a w of OSU testin-el at 30
kW)
Nomenclature Sample Polystyrene Polyurethane Plywood
FR
P ~ Y w O O ~ Woodpanel Chipboard Gypsum wallboardPHR-T Peak heat release rate using thermopile method
Tpm-T Time to peak heat release rate using thermopile method THR-T Total heat release using thermopile method
PHR-02 Peak heat release rate using oxygen depletion method
TPHR'Q Time to peak heat release rate using oxygen depletion method THR-02 Total heat release using oxygen depletion method
Table 5 Summarv of data from OSU testing (Radiant panel at 50
kUrl
PHR-T0
1.9 1.1 3.9 2.4 5.4 6.0 0.8 T p m T (s) 278 13 512 532 88 233 173=-a
410.3 289.2 1633.8 817.0 360.2 1081.2 82.5 THR-T(W
417.0 175.8 1324.5 491.0 610.2 1403.3 81.1 Sample Polystyrene Polyurethane PlywoodFR
plywood Woodpanel Chipboard Gypsumboard PHR-Q OrW) 4.1 3.2 5.9 3.2 9.2 8.1 2.4 PHR-02 (kw) 2.4 2.0 3.4 2.1 6.9 6.6 0.9 Tm-02 (s) 153 26 397 394 75 185 46 PHR-T &w) 2.9 2.1 6.3 4.0 7.8 8.4 2.5 TPHR-02 6 ) 262 28 486 535 100 250 218 T m - T (s) 158 12 402 398 64 175 35=-%
(kJ) 335.0 188.2 1052.2 425.6 629.0 1223.9 34.9 m - T (kJ) 509.8 412.9 2126.1 1142.7 846.3 1554.3 296.1Table 6 Room bum testing
Nomenclature
Tflssh Time to flashover
COMPARISON OF THE DATA
Tflash (s) No flashover 385 372 No flashover No flashover 252 No flashover
The data
from
all tests were examined to determine patterns of correlation between the small-scale and full-scale results. The process of finding a pattern was initiated by compiling the room bum data in order based on Peak Heat release Rate (PHR).T F ~ R (s) 438 385 372 960 246 252 594 Sample Polystyrene Polyurethane Plywood P ~ Y w O O ~ Woodpanel Chipboard Gypsum wallboard
Table 7 shows the materials ranked based on PHR values in the room bum test with the Total Heat release Rate (THR) values from the other test methods shown. Table 7 shows that the ranking of materials based on PHR in the full-scale room burn test is the same as the ranking based on the THR values
from
two small-scale tests, the IMO and the OSU at 50 kW. Also, in the full-scale tests, the two materials with PHR values higher than 600 kW (i.e. chipboard and plywood) reached flashover whereas those with PHR values below 600 kW did not This seems to indicate that ranking based on PHR gives a relative indication of "fire hazard".PHR &w) 235.4 619.3 830.0 411.4 311.2 746.6 205.2
Studying the room data carefully, however, one observes that materials that reached flashover fell into two categories. The first category represents materials, such as
chipbard, that are extremely hazardous because they reach flashover with only a small (40 kW) ignition flame. The second category involves materials that require a larger (160 kW) ignition flame to reach flashover. Plywood falls into this category.
Materials that did not reach flashover in the full-scale room test also fell into two categories. The first category includes materials that do not pose a fire hazard in a room because they cannot sustain burning, such as gypsumbard and polystyrene. For gypsumboard, only the surface paper bums. The polystyrene melted away from the ignition fire and did not provide a s o m e of fuel for the flames to advance. The second category involves materials which almost reached flashover; for example, woodpanel. This material ignited easily
and
burned very well early in the test, however, due to the thickness of the sample, quickly burned through and almost went to flashover. The flames were near the doorway and would have emerged had the material been thicker (i.e., more fuel). The heat release curve for woodpanel is identical to chipboard for the first four minutes, thus confirming the observations that fire progression was rapid and stopped only because the material burned through.Based on this obserdon, another ranking of materials was made
-
based on flashover potential. Table 8 shows the ranking of materials based on flashover potential in the full-scale room burn test. This ranking does not match the ranking based on theTHR
from the small-scale tests, however, it has a promising pattern when compared with PHR from the small-scale tests.
Table 9 shows the same ranking of mate.rials as in Table 8, but with THR and PHR values
from
the small-scale tests. Therg would appear to be a promising relationship between the PHRs from the small scale tests and the PHR from the room burn test in most cases. As shown in Table 5, the data &om the OSU at 50 kW shows that chipboard, plywood and woodpanel, all have high PHR-02 values. Plywood had the lowest PHR-O;? value among the three with 5.9 kW. Therefore, a reference value of 5.5 kW could be chosen, based on this limited data, as a critical value to predict materials which would reach flashover in the room fkscenario. Itwdd
be said that a material which produces a PHR value above 5.5 kW in the OSU test w i l l reach flashover in the room burn test. Woodpanel does not, however, fit into this gen-tion. This material did not flashover, yetdisplayed the highest PHR in the small-scale methods. The small-scale data suggests extreme flammability which corresponds well to the visual observations h m the room burn test. The absence of flashover for this material is a remarkable exception and the material is still considered dangerous because it ignites with a low ignition flame and spreads fire rapidly. Therefore, for the same thickness of lining materials, PHR from the small-scale test can be used to determine whether most materials will reach flashover or not.
To effectively evaluate
a
material for fire hazard, one has to consider its behaviour in a room fire condition. The observationsfrom
the full-scale tests indicate that materials with high flammability cause flashover when ignited, provided there is sufficient material tosustain the fire. In the small-scale tests, a material with high flammability is distinguished by a high PHR value, whereas the THR value in a small-scale test involves high
flammability as well as a higher quantity of combustible materials in the sample. To evaluate materials for fire hazard in a room
fire
scenario, therefore, small-scale tests can be used but one must examine both the PHR and THR values. Materials with a PHR value above 5.5 kW and aTHR
value above 1500kJ
(based on the value for plywood in Table 9) seem to cause flashover in a room fire scenario. In the tests, chipboard was the most hazardous material as shown by high PHR and THR values in the small-scale tests.Table 7 Ranking on
Room
Test PHRSample Gypsum wallboard Polystyrene Woodpanel
FR
Plywood Chipboard Plywood THR@lo)
(kJ) 128 364 1089 1570 3579 4454 PHR (room) &w) 205 235 311 41 1 747 830 THR-T (OSU-5OkW)(W
296 509 846 1143 1554 2126Table 8
&&&& "Fi
Hazard t. m Full-gaEkit.
Table 9 Sample data for establishment of reference values Required ignition
0
NIA NIA 160 40 160 40In comparing the PHR of the m bum test to the small-scale data,
an exception
was made.This
exception for polyurethane recognizes the markedly different behaviom that polyurethane displayed in the small-scale and full-scale tests. In the small-scale tests, the samples ignited immediately and had a PHR early in the test Flaming on the sample surface was completed within 30 seconds and the remaining material was mostly char. In the full-scale test, with the exposure of the 40 kW ignition burner, the sample charred considerably. Yet, when the heat output of the burner was increased to 160 kW, the sample soon flashed over. Polyurethane obviously requires a large heat flux to release its volatile gases through the charred layer. Since the heat fluxes generated by the small-scale apparati are far below that of t h e m , the small scale methods used are not adequate in predictingfull
scale performance for all materials. Polyurethane data was, therefore, omitted from the comparison.Flashover No No Almost Almost Yes Yes Sample Gypro~ Polystyrene
FR
~ l y ~ o o d Woodpanel Plywood Chipboard PHR (-10
205 235 41 1 311 830 747 THR @40)(kJ1
128 364 1570 1089 4454 3579 Sample Gypsum wallboard Polystyrene ~lywood Woodpanel Plywood Chipboard PHR (room) (kw) 205 235 41 1 311 830 747 PHR-T (OSU-5OkW) &w) 2.5 2.9 4.0 7.8 6.3 8.4 PHR @40)0
2.9 1 .O 2.9 9.2 6.3 10.5 THR-T (OSU-5OkW) (kJ) 296 509 1143 846 2126 1554I
I CONCLUSION
Based on the
data
provided by the seven test materials, it seems possible to predict flashover for most materials in the full-scale room burn using small-scale test results. This is based on the results given by the OSU and the IMO methods that relate the PHR and THR from the small-scale tests to the PHR from the full-scale room test. Materials with PHR values above 5.5k W
in the OSU test and IMO test and a THR value above 1500 kJin the OSU test (with 50
kW)
wiU likely reach flashover in a room fire scenario. It is, however, premature to applythis
to other combustible materials because of the small quantity ofdata
used.Comparison of
data
also
illustrated problems inherent in the small-scale test methods. The IS0 method has major problems in the interpretation of the data. Several materials prcduced data which do not seem to be realistic. The IMO method works well for wood products but has problems with melting materials. The OSU method did not exhibit problems with the materials tested and seems to produce the most promising results whencompared with full-scale data.
The large quantity of data from this series
w
i
l
l
beuseful
to enable an understanding of small-scale and full-scale fire test behaviour. It is, however, necessary to conduct more tests with other materials to establish the validity of the method over a complete range of materials. More testing is also necessary to verify the interpretations made based on the-
limited dataREFERENCES
1. "Revised Recommendation on FireTest Procedures for Surface Flammability of
Bulkhead and Deck F i s h Materials", Resolution A.564(14), International Maritime Organization, London, January 16, 1986.
2. "Standard Test Method for Flammability of Marine Surface Finishes", ASTM Standard E1317,1990 Annual Book ofASTM Stan-, American Society for Testing and Materials, Philadelphia, 1990.
3. "Standard Test Method for Deteminkg Material Ignition and Flame Spread F'nmdes". ASTM Standard E1321.1990 Annual Book of ASTM Standards.
can
society for Testing and hiaterials, Philadelphia, 1990.4. "Standard Test Method for Heat and Visible Smoke Release Rates for Materials and Products", ASTM Standard
E906,
pp 905-925,1983 Annual Book of ASTM Standards, American Society for Testing and Materials, Philadelphia, 1983.5 . "Reposed Method for
Room
Fire Test of Wall and Ceiling Materials and Assemblies", pp 1618-1638.1982 Annual Book of ASTM Standards, Part 18, American Society for Testing and Materials, Philadelphia, 1982.TABLE A-1
N
O
-
FOR IMOTEST
% Diffemm 0.0 1.7 4.6 3.2 2.9 0.0 0.4 0.1 3.1 5.3 10.6 13.7 17.5 30.0-
Distance from exposed end (mm) 50 100 150200
300 350 400 450 500 550 600 650 700 750 Measlned Flux(W
50.5 48.8 45.0 41.8 30.1 23.9 18.1 13.2 8.9 6.5 4.8 3.6 2.7 2.1 Standard Flux(kW)
50.5 49.5 47.1 43.1 30.9 23.9 18.2 13.2 9.2 6.2 4.3 3.1 2.2 1.5IMO TEST REPORT
-
SAMPLE BEHAVIOURMATERIAL
QBSERVATIONSPOLYSTYRENE All samples melted under radiant exposure to form a puddle of liquid and ignition occurred while the liquid was melting. There was a large variation in ignition times between tests. The sample r e 1 4 large quantities of thick black smoke. There was no distinguishable flame spread since melting occurred.
POLYURETHANE
The samples ignited almost immediately upon radiant exposure.Flaming occurred on the specimen surface for only a few seconds resulting in the appearance of a flash fire.
Large quantities of smoke were released but no burning or flame spread was observed.
PLYWOOD The samples burned well and displayed flame spread
Due to the thichess of the sample, flaming was maintained for 30 minutes.
Near the end of the test, chunks of charred material fell out of the specimen holder.
F. R PLYWOOD Although large quantities of smoke were released from the samples, ignition occurred only when the samples were severely charred.
There
was no flame
spread beyond the charred material and allflames were of a pale blue colour.
WOODPANEL. The sample ignited quickly and the
flame
spread along the surface.The test was of short duration because the sample was thin and quickly burned through resulting in a sharp peak heat release rate.
CHIPBOARD The test was similar to that of plywood, but the chipboard burned faster, resulting in a shorn test duration.
IMO TEST DATA
FOR
PLYWOODSAMPLE 1 SAMPLE 2 SAMPLE 3 Mean
CRITICAL
FLUX
HEAT FOR IGNITION FOR EXTINGUISHMENTk W
U/m2HEAT FOR SUSTAINED BURNING
Distance SAMPLE 1 SAMPLE2 SAMPLE3 MEAN
kJ/d
kJhn2
Ulm2u/m2
SAMPLE 1 SAMPLE2 SAMPLE 3 Mean SAMPLE 1 SAMPLE 2 SAMPLE 3 MeanTOTAL HEAT RELEASE TIME TO IGNlTION
kJ S
PEAK HEAT RELEASE TIME TO PEAK HEAT RELEASE
SAMPLE
1
SAMPLE 2 SAMPLE 3 MeanCRITICAL F%UX HEAT FOR IGNITION
FOR EXTINGUISHMENT
k W
H/m2
HEAT FOR SUSTAINED BURNING
Distance SAMPLE 1 SAMPLE 2 SAMPLE 3 MEAN
HhnZ
H M
H / d
U r n 2TOTAL HEAT RELEASE TIME TO IGNlTION
kJ S SAMPLE 1 SAMPLE2 SAMPLE 3 Mean SAMPLE 1 SAMPLE 2 SAMPLE 3 Mean
PEAK HEAT RELEASE TIME TO PEAK HEAT RELEASE
IMO TEST DATA FOR POLYURETHANE
CRITICAL FLUX HEAT FOR IGNITION FOR EXTJNGUISHMENT
k W
kJ/m' SAMPLE1
SAMPLE 2 SAMPLE 3 Mean Distance SAMPLE 1 SAMPLE 2 SAMPLE 3 Mean SAMPLE 1 SAMPLE 2 SAMPLE 3 MeanHEAT FOR SUSTAINED BURNING
SAMPLE 1 SAMPLE2 SAMPLE3 MEAN
kT/m2 kJh12 kT/m2 kJIm2
TOTAL HEAT RELEASE
TIME
TO IGNITIONkJ
SPEAK HEAT RELEASE TIME TO PEAK HEAT RELEASE
IMO TEST DATA FOR GYPSUMBOARD
CIUTICALFLUX HEAT FOR IGNITION FOR EXTINGUISHMENT SAMPLE 1 SAMPLE2 SAMPLE 3 Mean Distance 50 mm 100 mm 150 nnn 200 mm 250 mm 300 mm 350 mm mmm 450 nnn SAMPLE 1 SAMPLE 2 SAMPLE 3 Mean SAMPLE 1 SAMPLE 2 SAMPLE 3 Mean
HEAT FOR SUSTAINED BURNING
SAMPLE 1 SAMPLE 2 SAMPLE 3 MEAN
kJhnZ kJW kJ/m2 kJ/m2
TOTAL HEAT RELEASE TIME TO IGNITION
16 S
PEAK HEAT RELEASE
TIME
TO PEAK HEAT RELEASEIMO
TEST
DATA FOR CHIPBOARD SAMPLE 1 SAMPLE 2 SAMPLE 3 Mean Distance SAMPLE 1 SAMPLE2
SAMPLE 3 Mean SAMPLE 1 SAMPLE 2 SAMPLE 3 MeanCRITICAL FLUX HEAT FOR IGNlTION
FOR EXTlNGUISHMENT
k W
kJh2HEAT FOR SUSTAINED
BURNING
SAMPLE 1 SAMPLE2 SAMPLE3
kJ/m2 k J / d kJ/m2
MEAN
k J h 2
TOTAL HEAT RELEASE TIME TO IGNITION
kJ s
PEAK HEAT RELEASE TIME TO PEAK HEAT RELEASE
CRlTICAL FLUX HEAT FOR IGNITION FOR EXTINGUISHMENT
k W
kJlm2 SAMPLE 1 SAMPLE 2 SAMPLE 3 Mean Distance SAMPLE 1 SAMPLE2 SAMPLE 3 MeanHEAT FOR SUSTAINED BURNING
SAMeLE 1 SAMPLE 2
SAMPLE 3 Mean
SAMPLE1 SAMPLE2 SAMPLE3 MEAN
kJ/m2 kJ/m2 k J l d kJIrn2
TOTAL HEAT RELEASE TIME TO IGNITION
kJ S
PEAK HEAT R E U S E TIME TO PEAK HEAT RELEASE
IMO TEST DATA FOR FIRE RETARDED PLYWOOD
CRlTICALFLUX HEAT FOR IGNITION FOR EXTINGUISHMENT
k W
kThn2
SAMPLE 1 SAMPLE 2 SAMPLE 3 MeanHEAT FOR SUSTAINED
BURNING
Disraxe SAMPLE1 SAMPLE2 SAMPLE3 MEAN
H/mZ k J h 2 kJ/mZ
kThn2
SAMPLE 1 SAMPLE2 SAMPLE 3 Mean SAMPLE 1 SAMPLE2 SAMPLE 3Mean
TOTAL HEAT RELEASE TIME TO IGNITION
kJ s
PEAK HEAT RELEASE TIME TO PEAK HEAT RELEASE
I S 0 IGNITION TEST REPORT
-
SAMPLE BEHAVIOURMATERIAL
OBSERVATIONS
POLYSTYRENE The samples melted and released thick, dark smoke before ignition.
POLYURETHANE Fluxes less than 35.0 kWhn2 could not ignite the samples.
PLYWOOD The samples ignited easily.
As the flux decreased, ignition time increased.
F.
R
PLYWOOD A flux of at least 34.0 kW/m2 was necessary to produce ignition within2Q
minutes.The samples b e d
with
a pale blue flame and ignited only when severely charred.WOODPANEL At very low fluxes, the sample pyrolyzed slowly, and the thin samples decomposed without ignition. When ignition did
occur at higher fluxes, the samples burned fiercely. CHIPBOARD Overall behaviour was similar to plywood.
GYPSUMBOARD Low fluxes decomposed the paper too slowly to cause ignition The lowest flux able to cause ignition was 41.0 kWJm2.
M!!wmk&
OBSERVATIONSPOLYSTYRENE
After the preheat time had elapsed, the sample had completely melted and ignition did not occur.POLYURETHANE Since ignition test calculations yielded a preheat time of
12 seconds, the sample did not ignite. Flame spread data was not obtainable.
PLYWOOD Although the sample did ignite, ignition occurred before the preheat time elapsed. The radiation alone
was
high enough to cause ignition.F. R PLYWOOD The sample ignited 500 seconds before the preheat time had elapsed.
There
was no observable flame spread on theWOODPANEL The sample was ignited by the pilot after the designated preheat time and the flame progressed along the sample. CHIPBOARD The sample was ignited by the pilot after the preheat time and
the flame progressed along the sample.
GYPSUMBOARD After the preheat time had elapsed, the paper covering had decomposed and ignition was not possible. Flame spread data was not obtainable.
COMMENTS ON THE I S 0 TEST METHOD (IGNITION TEST)
In the ignition test procedure, polystyrene melted completely before ignition
occurred.
This material behaved erratically in that at 32.0 kW/m2, ignition o c c d at 75 seconds, and yet at 31.0 kW/m2, ignition occurred at 862 seconds. No other material displayed such a difference. The calculated results must be questioned in terms of its relation to reality. Based on the ignition results, a preheat time of 567 seconds was neededto establish thennal equilibrium for the sample. Since the sample
was
converted to a liquid after radiation exposure and remained in a pool on the base of the specimen holder, this preheat time had no meaning.Chipboard and plywood both gave predictable results. As the flux decreased, ignition time increased and the inverse relationship between ignition time and flux was
For woodpanel, long ignition times
were
not possible since, as the flux fell below the critical flux for ignition (21.6 kW/mz), pyrolysisdid
not occur fast enough for flame attachment As temperature rose and reached a point where ignition wuld occur, therewas
no longer any material undergoing thermal decomposition, so ignition did not occur.An identical situation
occurred
with gypsumboard The paper decomposed under flux exposure, and unless the fluxwas
high enourrh to cause fast decomsition, flame attachxknt did not occur. Also, gypsum&
a combsite material so the chculated results may not he realistic. A preheat time of 151 seconds can be confusing since it is too long for the paper to achieve thermal equilibriumand
too short for the plaster.Polyurethane was another sample that caused problems in interpreting the data.
Ignition of the samples at most fluxes was fast
and
violent and burning continued for only a few seconds. The lowest heat flux that produced ignition was 34.0 kW/mz and ignitionoccurred in only six seconds. Calculations yielded a critical flux for ignition of
25.0 kW/mz and a preheat time of 12 seconds, yet it is doubiful that thermal equilibrium could be established in that time ar ignition occur at that flux.
Polystyrene did not ignite after the preheat time had elapsed but remained as a molten pool of liquid on the base of the specimen holder. Polyurethane also did not ignite. The problems with the ignition test calculations canied over to the flame spread testing with this sample. A preheat time of 12 seconds was too long to allow flame attachment since all of the flammable materials on the suface were released by that time. Plywood ignited and spread flame along the sample but this ignition was not piloted and did not occur at the preheat time, instead, the radiation from the panel ignited the sample before the specified
time
had elapsed resulting in flaweddata.
Fire retarded plywood also ignited prematurely but since there was no flame advance on the sample, no data was obtainable. In alllikelihood, the preheat time of 1417 seconds was much too long as thermal equilibrium was probably established sooner.
Gypsumboard performed similar to Polyurethane. The paper covering soon decomposed, and there was no flammable material remaining after the preheat time had elapsed. This also reflects the problem evident with the ignition test calculations which produced a preheat time of 151 seconds.
OSU TEST REPORT (30 kW/m2 and 50 kW/mz)
-
SAMPLE BEHAVIOURMATERIAL,
OBSERVATIONS
POLYSTYRENE
The sample burned completely at both fluxes and released black smoke.There was melting before ignition.
POL-
The sample ignited immdiately at both fluxes and released large quantities of smoke.At 30 kW/m2, a lot of residue remained after the test, whereas, at
50
kW/m2, very little was left.There was continuous burning throughout the test.
PLYWOOD Sample bumed completely at
50
k W / d , leaving only ash. At30
kW/d, a substantial amount of charcoal remained, and the material had not finished burning at test completion.F. R.
PLYWOOD Although a lot of charcoal was left after the tests at both fluxes, the sample appeared to burn quite well at50
kW/m2. Flame colour was a green-yellow.WOODPANEL Sample burned completely at
30
W/m2 and 50 kW/m2. Burning time of the material was very short due to the thin sample.CHIPBOARD The sample bumed completely at 50 kwh12 leaving only ash. At 30 kW/m2, although no flaming was evident, after test termination there was some charcoal.
GYPSUMBOARD At both fluxes the paper quickly burned off and the remaining material released neither
flame
nor smoke.MATERIAL PHR-T TPHR-T THR-T PHR-02 TPHR-02 THR-02
0
6)
(kJ) (kw) (s) POLYSTYRENE 1.9 195 477.6 2.4 213 341.4 1.5 366 348.9 1.9 3 10 326.1 2.3 273 424.6 2.8 262 337.4 Mean 1 . 9 278 417.0 2 . 4 262 335.0 1.2 14 199.9 1.9 26 170.7 Mean 1 . 1 1 3 175.8 2 . 0 2 8 188.2 PLYWOOD 4.0 548 1318.6 3.4 3.7 546 1355.1 3.2 4.0 443 1299.8 3.7 Mean 3 . 9 512 1324.5 3.4 F.R
PLYWOOD 2.4 559 439.5 1.8 2.1 504 432.9 2.3 2.6 534 600.5 2.1 Mean 2.4 532 491.0 2 . 1 WOODPANEL 5.6 90 608.7 7.6 101 597.6 5.4 81 588.6 7.0 94 601.9 5.3 94 633.4 6.2 105 687.6 Mean 5 . 4 8 8 610.2 6 . 9 100 629.0 CHIPBOARD 6.2 230 1391.6 6.7 234 1216.5 5.4 225 1377.2 6.0 262 1147.8 6.3 244 1441.0 7.0 253 1307.3 Mean 6 . 0 233 1403.3 6 . 6 250 1223.9 GYPSUMBOARD 1.7 154 99.6 1.8 168 37.0 0.3 191 33.7 0.3 157 32.8 0.3 N/A 109.9 0.6 229 35.0 Mean 0 . 8 173 81.1 0 . 9 218 34.9OSU TEST DATA
-
50k W
MATERIAL PHR-T TPHR-T THR-T PHR-@ TPHR-@ THR-020
(9
(kJ)0
(s)06)
FQLYSlnUZNE! 3.0 128 453.3 4.6 115 352.0 2.8 162 530.4 4.0 184 417.1 2.8 184 545.8 3.7 160 461.9Mean
2 . 9 158 509.8 4 . 1 153 410.3 POLYUFXTHANE 2.4 12 533.3 3.1 27 279.9 2.1 11 346.5 3.4 27 293.6 1.9 12 358.9 3.7 25 295.1 Mean 2 . 1 1 2 412.9 3 . 2 2 6 289.2 Mean F.R
PLYWOOD Mean WOODPANEL Mean CHIPBOARD Mean GYPSUMBOARD MeanROOM BURN TEST REPORT
-
SAMPLE BEHAVIOURMA= OBSERVATIONS
POLYSTYRENE The sample melted around the flame source and burned once melted.
Flame attachment onto the solid material did not occur, therefore, flashover was not reached.
Large quantities of smoke were produced by the material that did burn.
POLYURETHANE The sandburner at 40 kW ignited the sample but was not enough to advance the flame to continuous burning. 160 kW from the burner was needed to cause flame progression along the ceilinglwall joints, and flashover occurred as a result PLYWOOD Fireprogression was rapid for the first two minutes of the test
and then receded substantially until the burner was increased to
160 kW. The fire progressed rapidly again and reached flashwer approximately one minute after the increase in heat output
F. R PLYWOOD The sample did not bum well and ignited 7 minutes after the burner was lit Charring was the main observation in the test as the material did not spread flame. Flashover was not achieved.
WOODPANEL The panelboard ignited quickly and burned well but was too
thin to allow flame to progress along the sample. The material burned through at 40
k W ,
and when the heat output was increased to 160kW,
there was little material left near the flame, so progression was not possible. Flashover was not achieved.CHIPBOARD Chipboard reached flashover before the burner was increased to 160 kW. Flame progression was steady and rapid with flashover occuning just after four minutes.
GYPSUMBOARD The
thin
layer of paper was not capable of continuous burning. Flashover did not occur as the paper quickly burned off.Material PHR