READ THESE TERMS AND CONDITIONS CAREFULLY BEFORE USING THIS WEBSITE.
https://nrc-publications.canada.ca/eng/copyright
Vous avez des questions? Nous pouvons vous aider. Pour communiquer directement avec un auteur, consultez la première page de la revue dans laquelle son article a été publié afin de trouver ses coordonnées. Si vous n’arrivez pas à les repérer, communiquez avec nous à [email protected].
Questions? Contact the NRC Publications Archive team at
[email protected]. If you wish to email the authors directly, please see the first page of the publication for their contact information.
NRC Publications Archive
Archives des publications du CNRC
This publication could be one of several versions: author’s original, accepted manuscript or the publisher’s version. / La version de cette publication peut être l’une des suivantes : la version prépublication de l’auteur, la version acceptée du manuscrit ou la version de l’éditeur.
Access and use of this website and the material on it are subject to the Terms and Conditions set forth at
Optimization of bridge maintenance management using Markovian
models
Lounis, Z.; Vanier, D. J.
https://publications-cnrc.canada.ca/fra/droits
L’accès à ce site Web et l’utilisation de son contenu sont assujettis aux conditions présentées dans le site LISEZ CES CONDITIONS ATTENTIVEMENT AVANT D’UTILISER CE SITE WEB.
NRC Publications Record / Notice d'Archives des publications de CNRC:
https://nrc-publications.canada.ca/eng/view/object/?id=7eb9cdf5-fe6d-4743-b4e6-1fc703a391fa https://publications-cnrc.canada.ca/fra/voir/objet/?id=7eb9cdf5-fe6d-4743-b4e6-1fc703a391fa
OPTIMIZATION OF BRIDGE MAINTENANCE MANAGEMENT
USING MARKOVIAN MODELS
Z. LOUNIS, and D.J. VANIER
Institute for Research in Construction, National Research Council, Ottawa, Ontario, Canada, K1A 0R6.
Originally published in the Proceedings of the International Conference on Short and Medium Span Bridges, 1998, Calgary, Alberta, pp.1045-1053, v.2
Summary
This paper presents a systematic approach for bridge maintenance management that combines a stochastic Markovian performance prediction model with a multi-objective optimization procedure to determine the optimal allocation of funds and prioritization of bridges for maintenance, repair and replacement (MR&R). The prioritization of the bridges is based on the satisfaction of several conflicting objectives simultaneously, including minimum bridge condition ratings, minimum MR&R costs, and maximum average daily traffic. The Markov chain model is a key component of this bridge management system, as it forecasts the future condition of the bridge network, thus enabling a reliable allocation of required MR&R funds. Highway bridges deteriorate with time as a result of aggressive environmental factors, increased traffic load, inadequate design, and lack of maintenance. The stochastic modeling of the bridge performance via a discrete Markov chain model captures the time-dependence, uncertainty and variability associated with condition ratings, resulting from deterioration and maintenance. The Markovian transition probability matrix can be estimated from the condition ratings data collected during the required biannual bridge inspections. The bridge maintenance management problem is formulated as a stochastic multi-objective optimization problem, where several conflicting objectives are simultaneously satisfied. The most relevant objectives include the minimization of the MR&R costs and maximization of the bridge network reliability or condition rating. Compromise programming, and specifically the minimum Euclidean distance criterion is used to determine the optimal ranking of the deteriorated bridges in terms of their priority for rehabilitation and replacement. This optimal ranking achieves a satisfactory trade-off between the competing or conflicting objectives.
Résumé
Cet article présente une approche systématique de prise de décision pour la gestion d'entretien de ponts qui combine un modèle stochastique de type Markovien pour la prévision de la
performance avec une méthode d'optimisation multi-objective pour déterminer l'attribution optimale de fonds et prioritisation des toits pour l'entretien, la réparation et le remplacement. Un modèle de produit du système de pont est employé pour fournir le cadre de données pour la collection et le traitement des données. Le prioritisation des pont est basée sur la satisfaction simultanée de plusieurs objectifs contradictoires, y compris la minimisation des coûts d'entretien et de réparation, la maximisation de la performance du réseau, et la minimisation du risque de rupture. Le problème de gestion d'entretien de ponts est formulé comme un problème d'optimisation multi-objectif et stochastique, où plusieurs objectifs contradictoires sont simultanément satisfaits. La méthode de programmation de compromis sera employée pour déterminer la classification optimale des ponts détériorés en termes de leur priorité pour la réparation et le remplacement, en réalisant un compromis satisfaisant entre les objectifs contradictoires.
1. INTRODUCTION
The high costs associated with preserving the nation’s deteriorating highway infrastructure and the limited funds available for its maintenance require the development of systematic approaches to optimize the bridge maintenance management process. These approaches should be performance-based and yield minimum life cycle cost, extended service life, and adequate levels of reliability and serviceability. Highway bridges are complex structural systems that deteriorate with time as a result of wear, fatigue, multiple aggressive environmental factors, increasing traffic loads, lack of maintenance, poor workmanship and inadequate design. Furthermore, the interaction of these degradation factors accelerates the rate of decay of bridge structures considerably. Over the last decade, one of the main research concerns was to foster improvements in the strategies by which the existing highway bridge stock is maintained and managed [1-10]. In the 16 OECD countries, there are 800,000 bridges with an estimated replacement cost of $ 500-900 per square meter of bridge [1]. In the U.S.A., 23.5% of the 577,710 bridges in the National Bridge Inventory were classified as structurally deficient, and 17.7% as functionally obsolete [11]. A functionally obsolete bridge is one on which the deck geometry, load carrying capacity, clearance, or approach roadway alignment no longer meet the usual criteria for the system of which it is an integral part. Replacement of bridges is dictated by several factors, including: (i) ratio of repair cost/replacement cost; (ii) structural deficiency, reduced load carrying capacity, functional obsolescence; (iii) increased traffic; and (iv) age of the bridge. On average, 2.1% of the actual value of each of the 16 OECD countries’ bridge stock is spent annually on maintenance, repair and strengthening of the bridges [1]. The magnitude of the problem poses great technological and economical challenges for the next decades.
In the U.S.A., the federal highway administration (FHWA) requires that all highway bridges be inspected and rated at least once every two years following the 1978 Surface Transportation Act. Bridge owners desire or expect a service life of 75-100 years for new bridges with only routine maintenance. However, it is observed that in the U.S., many of the existing bridges that are only 10-20 years old require costly and extensive rehabilitation [9, 11], with an estimated $90 billion backlog for bridge repair in 1994 [9]. An extensive study of the performance of highway bridges included in the American national bridge inventory (NBI) data was carried out by Dunker and Rabbat [11]. This study found that the percentage of bridge deficiency varied considerably from state to state with the highest deficiency percentage observed in the central and southeastern states and the lowest percentage in the southwestern states. This study indicated that the states with aggressive environments and heavy truck traffic did not necessarily have higher percentages of bridge deficiency. This considerable difference in structural deficiency between states was attributed to differences in funding, design, construction, inspection and maintenance policies [11].
The FHWA and several states have developed or initiated the development of management systems of their bridge networks due to the mandates in the Intermodal Surface Transportation Efficiency Act (ISTEA) of 1991 [2-8]. Different bridge management systems have been developed using: (i) Simplified economical models [2]; (ii) First- and second-order reliability methods [6, 8]; and (iii) Markovian decision processes [4,5,7]. The development of a practical and reliable bridge maintenance management system depends primarily on the existence of a reliable performance prediction model. Given the time-dependence and random nature of the bridge performance, a stochastic modeling is required. Furthermore, bridge maintenance management aims at improving the overall network effectiveness through the satisfaction of several and possibly conflicting objectives which include: minimization of MR&R costs; maximization of service life; maximization of reliability; minimization of bridge closures; accommodation of increased traffic, etc. Vector or multi-objective optimization techniques provide a practical tool for optimal multi-objective ranking or prioritizing of bridges for repair or replacement.
In this paper, a simplified multi-objective optimization approach for efficient decision making is combined with a discrete Markov chain model for future performance forecast to determine the optimal network-level maintenance management strategy that complies with the budgetary constraints and satisfies the above objectives. Such a solution achieves the best trade-off or compromise between cost and benefit of implementing different maintenance strategies. A numerical example illustrates the application of the proposed approach to the maintenance management of a network of steel highway bridges.
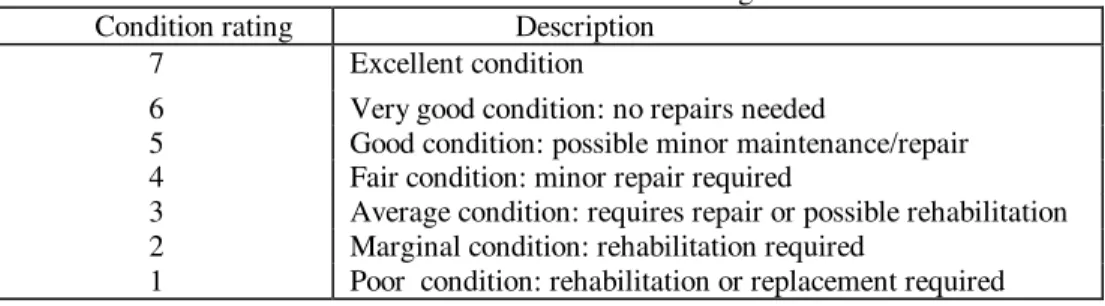
All highway bridges should be inspected biennially as in the U.S.A. The inspector rates the deck, superstructure, substructure and nonstructural elements of the bridge, and provides condition ratings for each element, whole bridge, and possibly the whole network. This rating consists of mapping the assessed condition onto a scale with 1-9 or 1-7 ranges [3,4,5,7]. For the network-level management undertaken in this study, a 1-7 rating scale, described in Table 1 is used to assess the condition of the whole network. As mentioned earlier, bridge performance deteriorates with time as a result of increased traffic loads, aggressive environmental factors, inadequate design and workmanship, and lack of maintenance. The bridge performance or condition at any given time is not a deterministic quantity, but rather presents large uncertainty and variability that, in general, increases with time. Hence, a reliable performance prediction model requires a stochastic modeling of the condition rating of the bridge network, which is presented in the following section.
Table 1. Definitions of condition ratings Condition rating Description
7 Excellent condition
6 Very good condition: no repairs needed
5 Good condition: possible minor maintenance/repair 4 Fair condition: minor repair required
3 Average condition: requires repair or possible rehabilitation 2 Marginal condition: rehabilitation required
1 Poor condition: rehabilitation or replacement required
In this paper, the time-dependent probabilistic modeling of the bridge performance is carried out using a discrete stochastic Markov chain that simultaneously takes into account the uncertainty of both deterioration and repair processes. The Markov chain is a stochastic process whose state space is finite or countable, that is described by {S(tn)=
k, k =1, 2,…., 7}, and such that the probability of a future state of the system S(tn+1)at time tn+1 is governed solely by its
present state S(tn) at time tn and not its entire history [12]. This assumption represents the first-order type of stochastic
process correlation underlying the Markovian process [12]. The transition probability pij represents the likelihood that
the bridge condition will change from state i at time tn to state j at time tn+1. The states 7, 6, 5, 4, 3, and 2 are called
transient states, whereas state 1 is called an absorbing state, which is a state that cannot be vacated, once entered if no repair is made.
The Markovian modeling of the performance requires only limited data on the network condition at two or more points in time, in order to derive the probabilities of transition from one state to other states having lower condition ratings. The performance of highway bridges is dependent on several explanatory variables, including age, environmental conditions, material and system types, traffic loading, workmanship quality and maintenance level. In this paper, a stationary stochastic process is assumed which implies the time-invariance of the transition probability matrix, and the transition time is taken as one year. Given the adopted condition rating scale and short transition time, the probability of decaying by more than one state in one year may be assumed negligible [4,5,7]. As a result, the deterioration of the bridge network is modeled using the following transition probability matrix:
= 1 .. ... 0 0 0 0 p p .. . . . . . . ... . . . . 0 .. ... 0 p p 0 0 ... ... 0 0 p p 21 22 65 66 76 77 P [1]
7
C o n d it io n r a ti n g1
2
3
4
5
6
t
n-1t
nt
n+1 Time (years)0
Mean performance curve Probability mass functions of performance
Figure 1. Bridge deterioration prediction using Markov chain model
Thus, the above transition probability matrix is greatly simplified and consists only of two terms in each row, namely: pi,i, and pij (with j=i-1 and pij=1- pii), which represent the probability of remaining at the same condition rating
and the probability of deteriorating by one condition rating, respectively. The transition probability matrix is determined as the solution that minimizes the distance from the condition rating probabilities obtained from the inspection data to those obtained using the adopted Markov chain model [4]. Once, the one-step transition probability matrix is generated, the n-step transition matrix can be obtained as follows:
P{S(tn)} = P{S(0)}Pn [2]
in which P{S(tn)} is the state probability matrix at time tn after n transitions; P{S(0)} is the initial state probability
matrix; and P is the transition probability matrix. The probabilistic prediction of the network condition using Eq.[2] is illustrated in Fig.1, which indicates the evolution with time of the probability mass function of the bridge network condition rating. In Fig.1, it is seen that at the start of the bridge service life, the probability mass is near condition rating 7, but with aging and deterioration, this probability mass shifts from states with high condition ratings to those with lower condition ratings. Ultimately, if no repairs are made, all the probability mass accumulates in the absorbing state with condition rating 1.
3. MULTI-OBJECTIVE OPTIMIZATION OF BRIDGE MAINTENANCE MANAGEMENT
The conventional approach to bridge network maintenance management was based on the consideration of single objectives in their project prioritization [2]. However, the actual maintenance problem is multi-objective in nature, since the simultaneous satisfaction of several conflicting objectives is sought, including: (i) minimization of MR&R costs; (ii) minimization of bridge closures; (iii) maximization of network reliability or condition rating; (iv) minimization of user costs; and (v) maintenance of bridges with high traffic volumes (or average daily traffic) (ADT). The solution of this maintenance management problem can be obtained using the techniques of vector or multi-objective optimization, and more specifically the compromise programming approach [13-16],which is discussed in this paper. The objective is the prioritization of bridges for repair, rehabilitation, and replacement considering simultaneously several relevant and conflicting objectives. The consideration of the most relevant objectives yields a rational assessment of the effectiveness of the adopted MR&R strategies for the entire bridge network.
3.1 Problem formulation
For single-objective optimization problems, the notion of optimality is very well defined as the minimum or maximum value of some given objective function is sought. In multi-objective (or vector) optimization problems, the notion of optimality is not that obvious because of the presence of multiple, incommensurable and conflicting objectives. In general, there is no single optimal (or superior) solution that simultaneously yields a minimum (or maximum) for all objective functions. A new concept, the Pareto optimum has been introduced as the solution to multi-objective optimization problems. A solution x* is said to be a Pareto optimum if and only if there exists no solution in the feasible domain that may yield an improvement of some objective function without worsening at least another objective function. The multi-objective maintenance management problem can be mathematically stated as follows [13]:
min f(x)= [ f1(x) f2(x) ………. fm(x) ]T x ∈Ω [3a]
Ω ={x ∈ N: Sx(t) ≤ 5} [3b]
where f = vector of objective functions; Ω= subset of the bridge network that at time t contains bridges with condition ratings (Sx) less than or equal to 5 and requiring MR&R, N= entire bridge network. The concept of Pareto optimality
mentioned above, may be stated mathematically as follows [13,16]: x* is a Pareto optimum if:
fi(x) ≤ fi(x*) , for i=1,2,…,m [4a]
In general, for a multi-objective optimization problem, there are several Pareto optimal solutions, the problem is to select the best solution that achieves the best compromise between all competing objectives. Such a solution is refereed to as “satisficing” solution in the multi-objective optimization literature [13,16]. The determination of this satisficing solution is discussed in the next section.
3.2 Optimal decision making for MR&R
In compromise programming, the “best” or satisficing solution is defined as one that minimizes the distance from the set of Pareto optima to the so-called “ideal solution”. This ideal solution is defined as the solution that yields minimum (or maximum) values for all objectives. Such a solution does not exist, but is introduced in compromise programming as a target or a goal to get close to, although impossible to reach. The criterion used in compromise programming is the minimization of the normalized deviation from the ideal solution f* measured by the family of Lp metrics defined as
follows [14,16]: p / 1 m 1 i p i i i i x p ) x ( f min ) x ( f max ) x ( f min ) x ( f min ) x ( L min − − = ∑ = Ω ∈ [5]
This family of Lp metrics indicates how close the satisficing solution is to the ideal solution, which for p=2, and p=∞
define the Euclidean distance and the maximum distance, respectively. The latter distance is the basis of the minimax criterion, and both of these criteria have been previously applied for multi-objective optimization of highway bridge design [13,14]. Another alternative to the above approach is possible through the introduction of weighting factors for the different objectives. In this paper, the criterion of minimum Euclidean distance is used to determine the satisficing solution and optimize the ranking of bridges that are in need of maintenance, rehabilitation and replacement. The selection of these bridges is based on three objectives: (i) minimum condition rating; (ii) minimum MR&R cost; and (iii) maximum average daily traffic.
4. PRACTICAL APPLICATION
The approach presented in this paper is applied for the optimal maintenance management of a network of 200 steel highway bridges with a total deck area of 103,000 m2. The present condition of this bridge network is shown in Fig.2, which shows the distribution of the deck area associated with each condition rating. The current condition of this bridge network in terms of the frequencies of the different condition ratings as a fraction of the total network area can be expressed by the following state matrix: P[S(0)]= [ 0.06 0.34 0.31 0.19 0.08 0.01 0.01]. This network condition corresponds to 12, 60, 60, 40, 16, 8, and 4 bridges at condition ratings 7, 6, 5, 4, 3, 2, and 1, respectively. In this example, four possible MR&R strategies or decisions are assumed: (i) d1= Do nothing; (ii) d2=minor repair with a unit
cost of $ 100/m2; (iii) d3= rehabilitation (or major repair) with a unit cost of $ 250/m2; and (iv) d4= replacement with
unit cost of $ 400/m2. Upon replacement, it is assumed that the bridge deck area will be increased by 30% to accommodate the increased traffic. Moreover, for safety reasons, bridges with condition rating 1 should be replaced within one year, otherwise they should be posted or closed. The cost-effectiveness of the different MR&R strategies may be evaluated in terms of their satisfaction of several objectives, including: (i) minimization of MR&R costs; (ii) minimization of bridge closures; (iii) maximization of average daily traffic (ADT); and (iv) maximization of bridge or overall network condition rating; (v) minimization of users’ costs. Given the high costs associated with bridge closure, its minimization should be adopted as the most relevant objective, with a high weight factor. In this example, only three of these objectives will be addressed.
0 5000 10000 15000 20000 25000 30000 1 2 3 4 5 6 7 Condition Rating D e ck A re a ( m 2 )
Figure 2. Current condition rating of bridge network
The condition assessment of this bridge network is carried out assuming a stationary Markov chain model with a one-year transition probability matrix having the following elements: p77=0.70, p66=0.75, p55=0.85, p44=0.90, p33=0.977,
p22=0.989, and p11=1.0. Using this Markovian stochastic model, the deterioration of this bridge network is predicted for
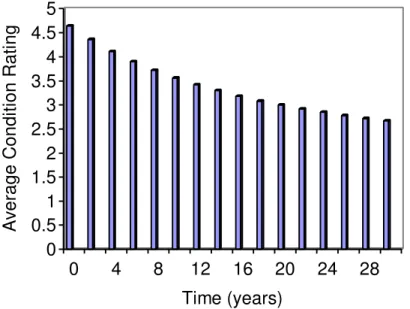
the next 30 years, and the results are shown in Fig.3, assuming no repairs are made. For example, after 30 years (30 transitions), the condition of the bridge network is P[S(t30)]=[0. 0. 0.008 0.089 0.547 0.273 0.082]. Figure 3 shows,
that if no repairs and replacements are made, the network expected mean condition rating decreases from 4.64 to 2.67 in 30 years. Assume that maintenance decisions d2, d3, and d4 are adopted for bridges with condition ratings (5,4), (3,2)
and 1, respectively. Therefore, using the above unit MR&R cost data (ignoring interest rate and inflation), and the Markov chain performance predictions, the MR&R costs increase with time as shown in Fig.4. Fig. 4 illustrates the impact of deferring maintenance on the required MR&R funds. For example, the MR&R costs would increase from $11.09 to $18.75 millions in 10 years and would reach $26.52 millions in 30 years .
Figure 3. Impact of deterioration and deferred maintenance on average condition rating of bridge network
0
0.5
1
1.5
2
2.5
3
3.5
4
4.5
5
A
ve
ra
g
e
C
o
n
d
it
io
n
R
a
ti
n
g
0
4
8
12
16
20
24
28
Time (years)
Figure 4. Impact of deterioration and deferred maintenance on network MR&R costs.
Figures 3 and 4 show that in order to maintain the condition rating of the bridge network at an acceptable level, and minimize the increase of MR&R budgets, it is necessary to reduce the amount of deferred maintenance, depending on the available budgets for each year in the planning horizon.
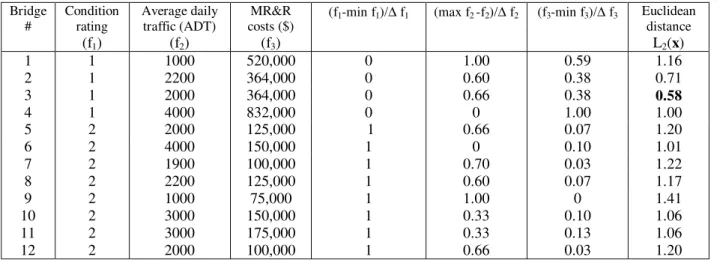
To illustrate the application of the proposed optimization approach, assume a $ 1.1 million budget for the current year, with maintenance being limited to those bridges with condition ratings 1 and 2 (critical bridges). The maintenance management optimization seeks the optimal selection of highway bridges for repair and replacement. In this example, a simplified cost model with no objective weighting is used in order to illustrate the practical application of the proposed approach. The ranking of the bridge projects for MR&R should satisfy the following three objectives: (i) minimum condition rating; (ii) minimum MR&R cost; and (iii) maximum average daily traffic. The values of the three objectives, and corresponding Euclidean distance from the ideal bridge are summarized in Table 2, for the 12 bridges in the network with condition ratings 1 and 2, only.
Table 2. Objective function and Euclidean distance values for deteriorated bridges
Bridge # Condition rating (f1) Average daily traffic (ADT) (f2) MR&R costs ($) (f3)
(f1-min f1)/∆ f1 (max f2 -f2)/∆ f2 (f3-min f3)/∆ f3 Euclidean
distance L2(x) 1 1 1000 520,000 0 1.00 0.59 1.16 2 1 2200 364,000 0 0.60 0.38 0.71 3 1 2000 364,000 0 0.66 0.38 0.58 4 1 4000 832,000 0 0 1.00 1.00 5 2 2000 125,000 1 0.66 0.07 1.20 6 2 4000 150,000 1 0 0.10 1.01 7 2 1900 100,000 1 0.70 0.03 1.22 8 2 2200 125,000 1 0.60 0.07 1.17 9 2 1000 75,000 1 1.00 0 1.41 10 2 3000 150,000 1 0.33 0.10 1.06 11 2 3000 175,000 1 0.33 0.13 1.06 12 2 2000 100,000 1 0.66 0.03 1.20
The total MR&R costs for these 12 bridges are $3.080 millions, which is well in excess of the available budget of $ 1.1 million. In Table 2, ∆fi =max fi – min fi, represents the difference between the maximum and minimum values for
objective fi, and is used for normalization purposes, only. From Table 2, the “ideal” (but non-existing) bridge for
MR&R is associated with the following “ideal” objective vector f*=[f1min f2max f3min]T= [1 4000 75,000]T. Using the
0 5 10 15 20 25 30 M R & R C o st s ($ M ill io n s) 0 2 4 6 8 10 12 14 16 18 20 22 24 26 28 30 Time (years)
minimum distance criterion and the data from table 2, the satisficing solution is found to be bridge # 3, which has the minimum distance to this ideal bridge. The optimal ranking of bridges in terms of priority for repair and replacement is as follows: bridge # 3, 2, 4, 6, 10, 11 ,1, 8, 12, 5, 7, 9, i.e. bridge #1 and bridge # 9 have the highest priority, and lowest priority, respectively. Hence, with a budget of $ 1.1 million for the current year, bridges # 3, and #2 should be scheduled for replacement, while bridges # 6, and #10 should be scheduled for rehabilitation with a total MR&R costs of $1.028 millions. However, if these three objectives are weighted by different factors, a different satisficing solution and optimal ranking can be obtained.
The proposed optimization approach represents the first step towards the development of a comprehensive bridge management system. The next step is the optimization of MR&R strategies within a finite or short term planning horizon, followed by an optimization within a longer planning horizon for both network and project level management. This task could be achieved through the combination of the dynamic programming approach with the proposed multi-objective optimization approach, in addition to the Markovian performance prediction model.
5. CONCLUSIONS
The multi-objective optimization approach presented in this paper demonstrates the potential of the compromise programming technique coupled with a Markovian performance prediction model to develop a systematic bridge maintenance management procedure. The major merits of the approach are: (i) consideration of all possible (even conflicting) objective functions; (ii) stochastic modeling of the bridge performance that accounts for its time-dependence and uncertainty; and (iii) rational decision-making regarding the selection of bridge projects for rehabilitation and replacement. The prioritization of the bridges is based on the satisfaction of several conflicting objectives simultaneously, including bridge condition ratings, MR&R costs, and average daily traffic.
The Markov chain model constitutes a key component of this bridge management system, as it forecasts the future condition of the bridge network, which enables a reliable assessment of required MR&R funds. The stochastic modeling of the bridge performance via a discrete Markov chain model captures the time-dependence, uncertainty and variability associated with condition ratings, resulting from deterioration and maintenance. The Markovian transition probability matrix is estimated from the condition ratings data collected during the required biannual bridge inspections.
The bridge maintenance management problem has been formulated as a stochastic multi-objective optimization problem, where several conflicting objectives are satisfied simultaneously, including the minimization of the MR&R costs and maximization of the bridge network reliability or condition rating. Compromise programming, and specifically the minimum Euclidean distance criterion yield the optimal ranking of the deteriorated bridges in terms of their priority for rehabilitation and replacement.
6. REFERENCES
[1] OECD, Durability of concrete road bridges. Organization for Economic Co-operation and Development, 1989, Paris.
[2] Weissmann, J., Harrison, R., Burns, N.H., and Hudson, W.R., “ Selecting rehabilitation and replacement bridge projects”, ASTM STP 1100, Maupin, G.W., et al., (eds.), 1990, pp.3-17.
[3] U.S. Department of Transportation- Federal Highway Administration, Pontis Version 2 User’s Manual, 1993, Washington, D.C.
[4] Cesare, M., Santamarina, J.C., Turkstra, C.J., and Vanmarcke, E., “Risk-based bridge management”, ASCE J. of Transp. Engrg., 1993, Vol. 119, No.5, pp. 742-750.
[5] Hearn, G., and Frangopol, D.M., “ Quantitative deterioration modeling for highway bridges”, Int. Conf. on Short and Medium Span Bridges, Halifax, 1994, Vol.2, pp.397-408.
[6] Sommer, A.M., Nowak, A.S., and Thoft-Christensen, P, “Probability-based bridge inspection strategy”, ASCE J. Struct. Engrg., 1994, Vol. 119, No.12, pp. 3520-3536.
[7] Jiang, Y, and Sinha, K.C., “ Dynamic optimization for bridge management systems”, Transportation Research Record 1211, 1989, pp. 92-100.
[8] Frangopol, D.M., Lin, K.Y., and Estes, A.C.“ Life-cycle cost design of deteriorating structures”, ASCE J. of Struct. Engrg., Vol. 123, No. 10, 1997, pp. 1390-1401.
[9] Aktan, A.E., et al., “ Condition assessment for bridge management”, ASCE J. of Infrastructure Systems, Vol.2, No.3, 1996, pp.108-117.
[10] Lounis, Z., Lacasse, M.A., Siemes, A.J.M., and Moser, K., “Further steps towards a quantitative approach to durability design”, CIB World Building Congress, Sweden 1998, accepted for publication.
[11] Dunker, K.F., and Rabbat, B.G.,“ Highway bridge type and performance patterns”, ASCE J. of Performance of Constructed Facilities, 1990, Vol.4, No.3, pp.161-173.
[12] Ross, S.M., Applied Probability Models with Optimization Applications. Holden-Day Inc., San Francisco, 1970. [13] Lounis, Z., and Cohn, M.Z., “ Multiobjective optimization of prestressed concrete structures”, ASCE J. of Struct.
Engrg., 1993, Vol. 119, No.3, pp. 794-808.
[14] Lounis, Z., and Cohn, M.Z., “ An engineering approach to multicriteria optimization of bridges”, J. of Microcomputers in Civ. Engrg., 1995, Vol.10, No.4, pp. 233-238.
[15] Lounis, Z., “Reliability-based structural design by compromise programming”, Third CSCE Conf. on Computing in Civil and Building Engrg., Montreal, 1996, pp. 546-557.
[16] Koski, J., “ Multiobjective optimization in structural design”, In New Directions in Optimum Structural design, eds. Atrek et al., Wiley, New York, 1984, pp. 483-503.