HAL Id: hal-00807313
https://hal.archives-ouvertes.fr/hal-00807313
Submitted on 3 Apr 2013
HAL is a multi-disciplinary open access
archive for the deposit and dissemination of
sci-entific research documents, whether they are
pub-lished or not. The documents may come from
teaching and research institutions in France or
abroad, or from public or private research centers.
L’archive ouverte pluridisciplinaire HAL, est
destinée au dépôt et à la diffusion de documents
scientifiques de niveau recherche, publiés ou non,
émanant des établissements d’enseignement et de
recherche français ou étrangers, des laboratoires
publics ou privés.
Excited state interactions between flurbiprofen and
tryptophan in drug-protein complexes and in model
dyads. Fluorescence studies from the femtosecond to the
nanosecond time domains
I. Vayá, P. Bonancía, M. C. Jiménez, D. Markovitsi, T. Gustavsson, M. A.
Miranda
To cite this version:
I. Vayá, P. Bonancía, M. C. Jiménez, D. Markovitsi, T. Gustavsson, et al.. Excited state interactions
between flurbiprofen and tryptophan in drug-protein complexes and in model dyads. Fluorescence
studies from the femtosecond to the nanosecond time domains. Physical Chemistry Chemical Physics,
Royal Society of Chemistry, 2013, 15 (13), pp.4727-4734. �10.1039/C3CP43847C�. �hal-00807313�
PCCP
Cite this: DOI: 10.1039/c0xx00000x
www.rsc.org/pccp
Dynamic Article Links►
PAPER
Excited state interactionsbetween flurbiprofen and tryptophan in
drug/protein complexes and in model dyads.Fluorescence studies from
the femtosecond to the nanosecond time domains
Ignacio Vayá,
aPaula Bonancía,
aM. Consuelo Jiménez,
aDimitra Markovitsi,
bThomas Gustavsson
b*and
Miguel A. Miranda
a*
5Received (in XXX, XXX) Xth XXXXXXXXX 20XX, Accepted Xth XXXXXXXXX 20XX
DOI: 10.1039/c0xx00000x
We report here on the interaction dynamics between flurbiprofen (FBP) and tryptophan (Trp) covalently linked in model dyads and in a complex of FBP with human serum albumin (HSA) probed by time-resolved fluorescence spectroscopy from the femto- to the nano-second timescales.In the dyads, a rapid 10
(k> 1010 s-1) dynamic quenching of the1FBP* fluorescence is followed by a slower (k > 109 s-1) quenching of the remaining1Trp* fluorescence. Both processes display a clear stereoselectivity; the rates are 2-3 times higher for the (R,S)-dyad. In addition, a red-shifted exciplex emission is observed, rising in 100-200 ps. A similar two-step dynamic fluorescence quenching is also observed in the FBP/HSA complex, although the kinetics of the involved processes are slower. The characteristic reorientational times 15
determined for the two enantiomeric forms of FBP in the protein show that the interaction is stronger for the (R)- form. This is, to our knowledge, the first observation of stereo-selective flurbiprofen-tryptophan interaction dynamics with femtosecond time resolution.
1. Introduction
The binding of drugs to biomolecules is determinant not only 20
for drug action (both therapeutic and toxic) but also for drug transport and disposition, which are regulated by various transport proteins such as human serum albumin (HSA). The detailed understanding of drug-protein binding, both from a structural and dynamic point of view, constitutes a particularly 25
active research field today.
Actually, HSA is one of the most abundant proteins in blood and plasma and is responsible for the transport of different agents in the bloodstream, such as fatty acids, drugs, or metabolites.1,2 Therefore, the binding of ligands to HSA constitutes a key 30
process, relevant for the modulation of a number of properties (drug solubility in plasma, toxicity, susceptibility to oxidation, in vivo half-life, etc.).3,4
Flurbiprofen (FBP, Chart 1) [2-(2-fluorobiphenyl-4-yl)propanoic acid] is a nonsteroidal anti-inflammatory drug 35
(NSAID) employed for the treatment of a broad spectrum of pathophysiological conditions, including fever, headache, etc.
5-8
Moreover, FBPpresents a chiral centre, and it has been reported that mainly the (S)-form possesses pharmacological activity(cyclooxygenase inhibition).9,10 It is known that FBP
40
binds to HSA preferentially in the so-called site II following Sudlow’s classification.11
Optical spectroscopy has proven to be particularly useful in the study of drug-protein binding.12,13 The observed excited state dynamics may be interpreted in terms of fundamental processes 45
such as energy and charge transfer, depending on the specific
drug-protein binding. Characterisation of the excited statesprovides a better understanding of the molecular recognition governing the drug transport. In particular, different enantiomers may have different binding behaviour resulting in distinct 50
spectroscopic properties.
From the photophysical point of view,FBP contains a biphenyl chromophore with well-known properties.14It exhibits a non-negligible intersystem crossing yield, so both the singlet and triplet states can in principle serve to monitor its binding to a 55
protein. Indeed, previous laser flash photolysis studies on FBP/HSA complexes showed that FBP binds to both sites I and II, but with higher affinity to site II.15The triplet lifetime of FBP within the protein is similar for the two enantiomers; however, this parameter monitors triplet state protection from oxygen 60
quenching,rather than direct interaction with the protein. In fact, the fundamental processes involved in the binding dynamics occur on a much shorter time scale, a few nanoseconds or less. Fluorescence spectroscopy provides therefore a more direct means to study the early events of molecular recognition since it 65
involves the singlet excited state of the drug and its dynamics, which in most cases evolves on the nanosecond timescale. Various fluorescence techniques have been used in the past to investigate the interactions between different drugs and proteins, with special attention to HSA.In addition to steady-state 70
fluorescence quenching,16-24 time-resolved measurements 25-27
allow the characterisation of the involved dynamic processes. In particular, femtosecond emission28-32constitutes apowerful tool for determining the very fast photo-initiated processes.
Steady-state fluorescence titration and anisotropy 75
2|Journal Name, [year], [vol], 00–00 This journal is © The Royal Society of Chemistry [year] measurements have been used to probe the FBP/HSA
complex.11,14, 33,34Time-resolved techniques have been applied to characterise the singlet excited states of both FBP14 and HSA,36 but not on the FBP/HSA complex, probably because the absorption spectra of the two compounds overlap strongly, and 5
their selective excitation is not possible.
It is well established that the UVB-induced fluorescence of HSA is mainly due to Trp-214,36which canin principlefacilitate the discrimination between FBP and HSA fluorescence, needed in order to evaluate the individual quenching rates. It is 10
worthwhile to notethe high sensitivity of Trp emissionto its local microenvironment. Thus, spectral changes can be observed in response to protein conformational transitions, ligand binding or subunit association. Moreover, Trp is sensitive to collisional quenching, probably due to the capability of the excited-state of 15
indole to act as an electron donor.36
In view of the complexity of the FBP/HSA system and the potential difficulties to interpret the fluorescence properties,complementary information is necessary in order to investigate the specific interactions between FBP and Trp.To this 20
purpose, covalently linked dyads formed by FBP and (S)-TrpMe ((S)-tryptophan methyl ester) have been employed as simple models for investigation of the key phenomena occurring indrug-protein interactions.37
Related drug-amino acid dyads have already been designed 25
and studied with success in the past.21,37-40They have provided new mechanistic insight into the key processes that occur between the two chromophores (such as energy transfer, electron transfer, exciplex formation, etc.). Interestingly, the picture obtained regarding the covalently linked dyads can be usually 30
extended to the more complex drug-protein systems.
Spectroscopic studies on FBP-TrpMe dyads revealed the absence of any significant ground-state intramolecular interactions between the two chromophores.37Fluorescence
spectra recorded atexc = 266 nm (where ca. 60% of the light is
35
absorbed by the biphenyl and 40% by the indolechromophore)displayed a dramatic FBP fluorescence quenching and a residual emission (max = 340 nm) assigned to
the TrpMe unit. This highly efficient FBP fluorescence quenching was explained by energy transfer from1FBP* to 40
TrpMe,37which is in accordance with the excited state energy of FBP (99 kcal mol-1), higher than that of Trp (96 kcal mol -1
).14,41Moreover, the non-negligible spectral overlap between FBP emission and TrpMe absorption spectra would be in favour of Förster energy transfer. Concerning the nanosecond time-45
resolved measurements, the fluorescence lifetimes at em = 340
nm were much shorter in the dyads (F< 1 ns) than in (S)-TrpMe,
indicating a dynamic quenching. However, these F values were judged inaccurate, due to the limitations of the equipment. This quenching was assigned to either electron transfer or exciplex 50
formation. Both processes are thermodynamically allowed, according to the Rehm-Weller equations.42Exciplex emission was indeed detected as a broad band between 380 nm and 500 nm, especially in (R,S)-FBP-TrpMe.
With this background, it appeared interesting to reinvestigate 55
the singlet excited state interactions occurring in both FBP/HSA complexes and FBP-TrpMe model dyads (Scheme 1),using fluorescence techniques with a much higher time-resolution.
In order to overcome the abovementioned spectral overlap issue, the fluorescence decays were monitored at chosen 60
wavelengths where the emission is dominated by FBP (310nm) or Trp (340-380 nm).
65
Scheme 1 70
2. Experimental
The (S)- and enantiomers of flurbiprofen ((S)- and (R)-FBP),(S)-tryptophan methyl ester ((S)-TrpMe) and human serum albumin (HSA) were purchased from Sigma-Aldrich. Acetonitrile was of HPLC quality from Merck. The PBS buffer was prepared 75
by dissolving phosphate-buffered saline tablets (Sigma) in ultrapure water from a Millipore (Milli-Q Synthesis) system. The synthesis of the FBP-TrpMe model dyads is already reported.37 Steady-state absorption spectra were recorded with a Perkin-Elmer Lambda 900 spectrophotometer. Steady-state fluorescence 80
spectra were obtained using a SPEX Fluorolog-3 spectrofluorometer, with an excitation wavelength of 267 nm at 22 ºC. Solutions were placed into 10 mm × 10 mm quartz cells. The absorbance of the samples at the excitation wavelength was kept below 0.2. Fluorescence quantum yields were determined 85
using FBP in MeCN/air as a secondary reference, with F = 0.17
(air) or 0.21 (N2).9
Time-resolved fluorescence measurements were performed using the fluorescence upconversion (FU) and time-correlated single photon counting (TCSPC) techniques. The excitation 90
source was the third harmonic (267 nm) of a mode-locked Ti-Sapphire laser, delivering ~120 fs pulses whose repetition rate was 76 and 4.75 MHz for FU and TCSPC,respectively (in the latter case set by a pulse-picker).
For the FU measurements, a home-built setup was used. This 95
has been described in detail earlier.43,44Briefly, a 1mm type I BBO sum-frequency crystal was used, providing an instrumental response function of about 350 fs (fwhm). We judge that the time resolution of the setup is better than 100 fs after deconvolution, depending on the signal-to-noise ratio. Typical scans were 100
performed in a 200 picosecond time interval with a 1 ps step.The average excitation power used was 40 mW. The power density cannot be measured precisely within the excitation volume but we estimate it to 0.2 0.1 GW/cm2 for a 40 mW output from the tripler unit (assuming a 40 micron diameter of the focused beam). 105
Solutions (about 25 ml) were kept flowing through a 0.4 mm quartz cell, which was kept in continuous motion perpendicular to the excitation beam in order to minimise thermal effects.
For the TCSPC experiments, a Becker &Hickl GmbH PC card was used.45 A Schott WG 295 filter was placed in front of a 110
SPEX monochromator. The detector was a microchannel plate (R1564 U Hamamatsu) providing an instrumental response function of 60 ps (fwhm). The average laser power (0.1 mW) was measured with a MellesGriot broadband powermeter. The irradiated area on the surface of the cell was ca. 0.2 115
A B 0 50 100 150 0.00 0.25 0.50 0.75 1.00 F luoresc ence Int ensit y Time / ps 0 50 100 150 0.00 0.25 0.50 0.75 1.00 F luoresc ence Int ensit y
cm2corresponding to a pulse intensity of 2.4 kW/cm2. Solutions were contained in a 10 mm × 10 mm quartz cell and continuously stirred. Successive recordings with the same sample gave identical decays, which were eventually merged to improve the signal-to-noise ratio. Such a procedure allowed us to ensure that 5
the measured signals were not altered during the measurements due to a possible accumulation of photoproducts.
The time-resolved experiments were performed either at magic angle or under successive parallel (Ipar(t)) and perpendicular
(Iperp(t)) excitation/detection conditions. These were achieved by
10
controlling the polarisation of the exciting beam with a zero-order half-wave plate. From these measurements, the fluorescence anisotropy was calculated from the formula
𝑟 𝑡 = 𝐼𝑝𝑎𝑟 𝑡 − 𝑅𝐼𝑝𝑒𝑟𝑝 𝑡
𝐼𝑝𝑎𝑟 𝑡 + 2𝑅𝐼𝑝𝑒𝑟𝑝 𝑡 (1) 15
The transmission under parallel and perpendicular conditions was found to be identical so the correction factor R was put to unity.
3. Results and discussion
3.1 Studies on FBP-TrpMe model dyads
20
Due to the poor solubility of the FBP-TrpMe dyads in aqueous media, experiments were performed in acetonitrile, under aerated conditions. Steady-state absorption and fluorescence spectra of (S)-FBP, (S)-TrpMe, (S,S)-FBP-TrpMe and (R,S)-FBP-TrpMein acetonitrile/air are given in Figures SI-1 and SI-2. As previously 25
described, a dramatic fluorescence quenching (>90%) was observed for the dyads. The fluorescence quantum yields of (S,S)- and (R,S)-FBP-TrpMewere found to be0.028 and 0.015,respectively(Figure SI-2A), which are much lower than those of the individual chromophores.38From the shape and the 30
position of the fluorescence bands, it was confirmed that emission is dominated by1TrpMe*.For both dyads, a longer wavelength band (centred at 450 nm), assigned to exciplex emission, was also observed; it wasmore intense for the (R,S)- diastereomer(Figure SI-2B).
35
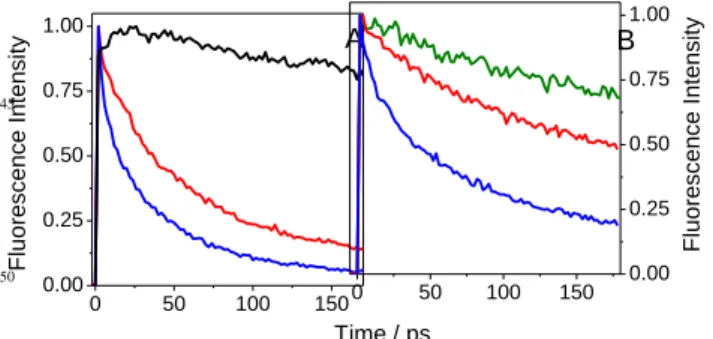
Figure 1 shows the fluorescence decays recorded by FU at both 310 and 340 nm (emission maxima of FBP andTrpMe, respectively). The decay kinetics of the dyads weremuch faster than those of FBP or TrpMe. This is in line with the relative quantum yields and clearly shows the dynamic nature of the 40
fluorescence quenching.
45
50
Figure 1.Normalised FU decays at A) (em = 310 nm ) and B) (em = 340 nm ) of (S)-FBP (black), (S)-TrpMe (green), (S,S)-FBP-TrpMe (red) and (R,S)-FBP-TrpMe (blue).
55
At 310 nm, where FBP emission is dominating, the most striking feature was the very rapid decay of the dyads, on the picosecond time scale (Figure 1A). In addition, a significant stereo-differentiation was noticed; the (R,S)- dyad emission decayed faster than that of the (S,S)-diastereomer. The 60
fluorescence decays were highly non-exponential, but the “average” characteristic times estimated at the 1/e level were62 and 28 ps for (S,S)- and (R,S)-FBP-TrpMe, respectively (Table 1).These times should be compared to the much longer and wavelength independent fluorescence lifetimeof FBP (1.67 ns). 65
The FBP signal at 310 nm shows a rapid rise, on the order of a few ps,46which can in principlebe assigned to a vibrational redistribution in the excited state.
Based on the average lifetimesvalues given above, the corresponding rate constants (kQ1) were estimated (Table 1).They
70
were higher than 1010 s-1 and revealed a remarkable stereoselectivity.
Table 1.Kinetic parameters derived from the FU and TCSPC fluorescence decays of (S)-FBP, (S)-TrpMe, (S,S)-FBP-TrpMe and (R,S)-75
FBP-TrpMein acetonitrile under air at 310 and 340 nm. Uncertainties are ± 5 % if not otherwise stated.
Compound F (ps)a kQ11010 (s-1) F (ns)b,c kQ2 109 (s-1) (S)-FBP 1670 c - - (S)-TrpMe 2100 c - 1.35 (S,S)-FBP-TrpMe 62d 1.6 0.46 1.4 (R,S)-FBP-TrpMe 28d 3.5 0.23 3.6 a em = 310 nm; bem = 340 nm; cTCSPC; dFU
The FU decays at 340 nm (Figure 1B) wereslower than those observed at 310 nm.Also here, the decays were highly non-80
exponential with average characteristic times of300 and 80ps for (S,S)- and (R,S)-FBP-TrpMe, respectively. No rise in the signal, supporting the previous proposed energy transfer from 1FBP* to TrpMe, was observed.However, such a rise could be experimentally difficult to detect, taking into account the strong 85
direct excitation of TrpMe at 267 nm and the spectral overlap of FBP and TrpMe emission at this wavelength.
The fluorescence anisotropy decays of the dyads were compared to that of FBP at 310 nm (Figure SI-3A). For the latter, the anisotropy decayed with a characteristic time of about 26 ± 90
1ps, while for (S,S)- and (R,S)-FBP-TrpMe characteristic times of 42 ± 2 and 44 ± 4 ps were obtained. The FBP molecular volume of FBP is ca. 300 Å3, which in the frame of the Stokes-Einstein-Debye theory46 corresponds to a rotational time of about 27 ps, in correspondence with that observed. The total volume of the FBP-95
TrpMe dyads is about 492 Å3, giving a rotational time of about 44 ps, once again in agreement with those experimentally observed. The mono-exponential behaviour of the anisotropy decays, and in particular the lack of any fast decays at early times, shows that there is no internal rotation between the two 100
chromophores at early times. The slight difference between the (S,S)- and (R,S)- dyads is within the experimental uncertainties.
The fluorescence anisotropy decays of the dyads were also compared to that ofTrpMe at 340 nm (Figure SI-3B). The characteristic times were 24 ± 1 and 32 ± 2 ps for (S,S)- and 105
(R,S)-FBP-TrpMe respectively,faster than to those recorded at 310 nm. This is not necessarily indicative of any internal dynamics, but may only be the result of the disappearance of FBP (higher anisotropy, r0= 0.31 ± 0.01) leaving only TrpMe (lower
4|Journal Name, [year], [vol], 00–00 This journal is © The Royal Society of Chemistry [year] anisotropy, r0= 0.17 ± 0.01)at this wavelength. The zero time
fluorescence anisotropies for (S,S)- and (R,S)-FBP-TrpMe at 340 nm are 0.25 ± 0.01 and 0.22 ± 0.01, respectively,representing average values of FBP and TrpMe. As in the case of the fluorescence intensity decays, theseobservations can be 5
explainedin terms of thedirect excitation of TrpMe and the spectral overlap of the two chromophores at 340 nm.
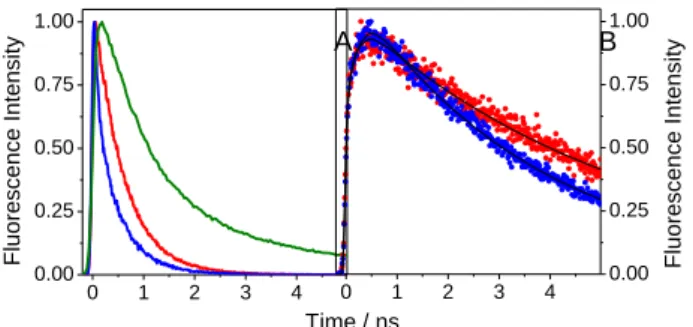
Figure 2.Normalised TCSPC decay traces at A) (em = 340 nm ), B) (em = 450 nm ) of (S)-TrpMe (green), (S,S)-FBP-TrpMe (red) and (R,S)-FBP-TrpMe (blue). Fitted curves are shown in black.
10
In order to follow the dynamics at 340 nm, it is necessary to go to longer timescales than with FU.This was achieved by means of TCSPC recorded at 340 nm(Figure 2A). The dyad signals decayed much faster than that of TrpMe, pointing to a 15
dynamic quenchingoccurring on a much slower timescale than that observedby means of FU.
What is striking is the clear difference observed in the decay traces of the (S,S)- and (R,S)- dyads. This stereo-differentiation was not detected in the previous study,37because of insufficient 20
time-resolution, and constitutes an important new element. As for FU data, (R,S)-FBP-TrpMedecayed more rapidly than (S,S)-FBP-TrpMe. Bothsignals were close to mono-exponential, with characteristic times of 460 and 230 ps for the (S,S)- and (R,S)- diastereomers, respectively (see Table 1). These times should be 25
compared to the 1.35 ns of TrpMe at this wavelength.The kQ2values of the dyads, calculated from the corresponding F
values, underline the strong stereoselectivity.
The TCSPC decays of the dyads weremuch faster at 310 nm than at 340 nm (Figure SI-4). This shouldnot be surprising in 30
view of the efficientFBP fluorescence quenching. In fact, emissionfrom FBP was not expected beyond a few tens of picoseconds, so the residual fluorescence should be ascribed to the TrpMeunit at both wavelengths. Still, the fluorescence lifetimes measured at 310 and 340 nm werevery different. 35
Actually, the Trp fluorescence is known to be very complex, with strongly wavelength dependent decay times.36This has been
assigned to the co-existence of several rotamers with different excited state dynamics,47 which may also occur in the dyads. The TCSPC profiles at 450 nm (Figure 2B)were much slower 40
than those at either 310 or 340 nm. Interestingly, these profiles are characterised by a rapid rise, 115 ± 7 and 189 ± 6ps for (S,S)- and (R,S)-, respectively, which can be assigned to the formation of an exciplex.38 Its rate is intermediate between the two quenching processes described above, so it is not possible to 45
correlate it with any of them. As already proposed in the literature, such exciplexes could serve as intermediates for full
electron transfer processes,48 consistent with the electron donor character of Trp.36 The exciplex lifetimes were 5.34 ± 0.02 and 3.63 ± 0.01 ns for the (S,S)- and (R,S)-diastereomers, 50
respectively.
3.2 Studies on FBP/HSA complexes
Steady-state UV absorption and fluorescence measurements were performed on mixtures of(S)-FBP or (R)-FBP (2.5 10-5 M) and HSA (3.6 10-5 M) in PBS. As the binding constants of FBP 55
to the binding affinity site of HSA are in the order or 106 M-1, all the drug is essentially bound to the proteinunder these conditions.11, 15
The results for (S)-FBPare shown in Figure 3. With the (R)-enantiomer, the results were basicallyidentical (data not 60
shown).A significant fluorescence quenching was observed for the complexes, even though less important and less stereoselective than for the dyads. This can be interpreted by weaker interaction in the non-covalent supramolecularcomplexes compared to the dyads. Comparison of the fluorescence spectra of 65
the drug/protein mixtures with those of isolated FBP and HSA revealed that both components contribute to the emission spectra. This is in principle not unexpected, since both chromophores absorb strongly at the excitation wavelength.
Figure 3. A) UV absorption spectra of (S)-FBP (black), HSA (green),
70
and the (S)-FBP/HSA mixture (red) in PBS. The concentration of the solutions was 2.5 × 10⁻⁵ M for FBP and 3.6 × 10⁻⁵ M for HSA; B) fluorescence spectra of (S)-FBP (black), HSA (green), and (S)-FBP/HSA (red) in PBS, under air, using isoabsorptive solutions at the excitation wavelength (267 nm). Simulated emissions, taking into account the 75
percentage of light absorbed by each subunit (dark red), and the possible quenching processes as explained in the text (violet) are also shown.
Taking into account the relative absorbances of FBP and HSA at 267 nm,and assuming independent emission, the fluorescence 80
spectrum of the mixture could in principle be calculated using the simple relation
AF(tot) = 0.18 AF(FBP) + 0.82 AF(HSA) (2)
85
where AF (FBP) and AF (HSA) are the areas under the emission
curves of the two subunits. However, thissimulatedspectrumdid not match the experimental one.Instead, an excellent reproduction of the real emission of the drug/protein system (Figure 3B) was achieved by using the relation
90 AF(tot) = 0.074 AF(FBP) + 0.746 AF(HSA) (3) 0 1 2 3 4 0.00 0.25 0.50 0.75 1.00 F luoresc ence Int ensit y Time / ns A B 0 1 2 3 4 0.00 0.25 0.50 0.75 1.00 F luoresc ence Intens it y 300 350 400 0.0 0.5 1.0 1.5 2.0 R elativ e I F / a.u. Wavelength / nm 240 270 300 330 0.0 0.5 1.0 1.5 Absorbanc e A B
0 20 40 60 80 100 0.00 0.25 0.50 0.75 1.00 F luoresc ence Intens it y Time / ps A B 0 1 2 0.00 0.25 0.50 0.75 1.00 F luoresc ence Int ensit y
where an important fluorescence quenching of FBP fluorescence and, to a lower extent, of HSA became evident.
In order to gain further insight into the excited state dynamics of these systems, FBP, HSA and the two complexes were investigated by FU and TCSPC at various wavelengths.While the 5
FBP decay in PBS solution wasmonoexponential, those of HSA and FBP/HSA were strongly non-exponential and wavelength dependent. In general, three-exponential model functions were required for a good fitting of the kinetic traces in the protein-containing samples (Table 2). In view of the complexity of the 10
fluorescence decay analysis, we also report the average lifetime (<>), which allows an easier comparison of the excited state dynamics of FBP in the presence and absence of protein. The FU measurements of FBP and the FBP/HSA systems recorded at 310 nm are shown in Figure 4. At early times, the 15
behaviour of the two complexeswas identical, showing an instantaneous rise limited by the apparatus function, followed by a constant value (Figure 4A).Interestingly, the signal of FBP in PBS did not rise as rapidly (“instantaneously”) as those of the complexes. This was also observed for FBP in acetonitrile (see 20
preceding section), and may be attributed to an intramolecular vibrational relaxation.The situation would be different in the two complexes, where FBP is tightly bound to the protein, resulting in a reduced coupling of its vibrational modes. Moreover, such a tight binding would imply a fast intermolecular vibrational 25
relaxation which could accelerate the FBP intramolecularprocess. As a consequence, it would be too fast to be detected with the available time-resolution.
30
35
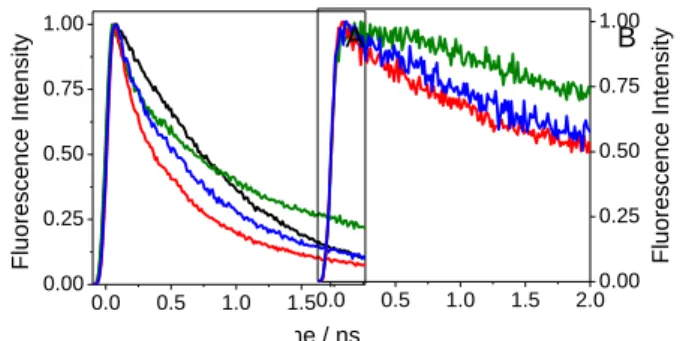
Figure 4.Normalised FU decays of (S)-FBP (black), (S)-FBP/HSA (red)
and (R)-FBP/HSA (blue) in PBS/air at 310 nm. Note the different 40
timescales used in A) and B).
Beyond a few picoseconds, the decays of the two FBP/HSA complexesbecame slightly more rapid than that of free FBP (Figure 4B). This behaviour can be explained in terms of a FBP 45
dynamic quenchingwhen bound to the protein, which is clearly configuration-dependent. The approximate characteristic decay times in the 0-120 ps time window were 180 and 250ps for (S)-FBP/HSAand (R)-FBP/HSA, respectively.
The dynamic quenching at 310 nm persisted and became even 50
more marked at longer times, as illustrated by the TCSPC traces shown in Figure 5A. While the fluorescence decay of FBP was monoexponential with a lifetime of 0.78 ns, that of HSA was more complex and can be described by an average lifetime <> = 1.22 ns. On the nanosecond timescale, the fluorescence decays of 55
the two FBP/HSA complexes decayed much faster than free FBP. This wasmore pronounced for the (S)- than for the (R)-enantiomer (<> = 0.54 ns vs. 0.70 ns, Table 2).
Figure 5.Normalised TCSPC decays of (S)-FBP (black), HSA (green),
(S)-FBP/HSA (red) and (R)-FBP/HSA (blue) in PBS at A) em = 310 nm, 60
and B) em = 380 nm.
At 380 nm (Figure 5B), where only HSA emits, the fluorescence lifetimes were shorterthan that of HSA alone (Table 2). Again, there was a clearstereoselectivityin this process. The HSA fluorescence is known to be highly non-65
exponential,36 but the actual characteristic decay times depend on both the excitation and the emission wavelengths, ranging from less than one to several nanoseconds.49-51This observation has been explained by the heterogeneity of the Trp microenvironment.49 Previous femtosecond studies on UV 70
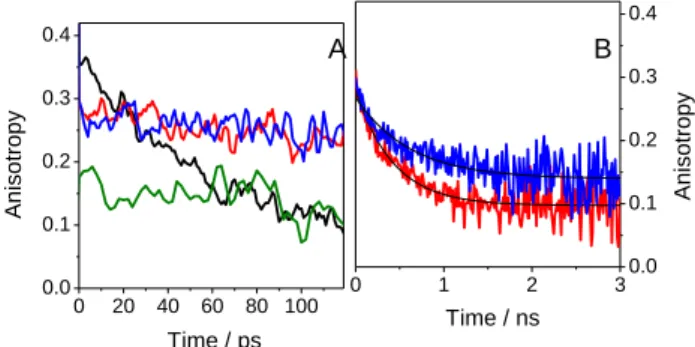
excited HSA showed that the dynamics of Trp within the protein are slowerthan in solution,52-54in line with our observations. Regarding the anisotropies recorded by FU, several interesting aspects can be noted (Figure 6A). For HSA, an initial value of about 0.18 was observed, the same as for isolated Trp. Thus, the 75
HSA fluorescence is dominated by Trp, and other residues contribute only marginally. The fluorescence anisotropy remained constant over the observed time window, in line with a slow rotational diffusion of the voluminous protein. In contrast, for FBP, the initial fluorescence anisotropy at time zero (r0) was
80
0.36 ± 0.02 and decayed with a characteristic time of 65 ± 6ps (in accordance with the rotational diffusion of FBP in water). However, in the presence of the protein, the r0 value dropped to
0.29 ± 0.02 but remained practically constant during the first hundreds of picoseconds. In principle, this can be explained by 85
encapsulation of the drug within the more constrained protein microenvironment. Since overlapping fluorescence from both FBP and HSA was observed, the resulting anisotropy value (0.29) was between those of FBP (0.36) and HSA (0.18).
Table 2.Kinetic parameters obtained from the fitting of the TCSPC 90
decays upon excitation at 267 nm in PBS under air. Uncertainties are ± 5 % unless otherwise stated.
em (nm) Parametersa HSA (S)-FBP/HSA (R)-FBP/HSA 310 1(ns)/p1 (%) 0.16/5 0.18/17 0.25/9 2 (ns)/p2 (%) 1.00/36 0.69/51 0.72/60 3 (ns)/p3 (%) 4.36/59 3.48/32 3.51/31 <> (ns) 1.22 0.54 0.70 380 1 (ns)/p1 (%) 2.94/18 0.36/3 0.53/3 2 (ns)/p2 (%) 6.93/71 2.59/25 3.08/30 3 (ns)/p3 (%) 12.8/11 7.68/72 7.95/67 <> (ns) 5.78 3.69 4.14 aObtained by a non-linear fitting/deconvolution procedure, using a three exponential function F(t) = Σaiexp(-t/i); pi = 100aii/(a11 + a22 +
a33);<>is the average lifetime, determined as a11 + a22 + a33.At 310 95 nm, F (FBP) was 0.78 ns. 0.0 0.5 1.0 1.5 0.00 0.25 0.50 0.75 1.00 F luoresc ence Int ensit y 0.0 0.5 1.0 1.5 2.00.00 0.25 0.50 0.75 1.00 Time / ns F luoresc ence Int ensit y A B
6|Journal Name, [year], [vol], 00–00 This journal is © The Royal Society of Chemistry [year] The fluorescence anisotropy decays recorded by TCSPC at em
= 310 nm (ns timescale) are shown in Figure 6B. In contrast with the pskinetics recorded by FU, a chiral discrimination was observed.For both drug/protein systems, the r0 value was ca. 0.28
± 0.02 and decreased rapidly to a constant value within the first 5
few nanoseconds. Monoexponentialfitting gave a characteristic time of0.44 ± 0.03 ns for (S)-FBP/HSA and0.62 ± 0.07 ns for (R)-FBP/HSA. The difference in lifetimes can be related to the orientation of the drug within the protein, which may restrict the degrees of freedom for conformational relaxation more 10
effectively in the case of the (R)-enantiomer.
Figure 6. Fluorescence anisotropy decays of (S)-FBP (black), HSA
(green), (S)-FBP/HSA (red) and (R)-FBP/HSA (blue) in PBS at em = 310 nm. A) FU and B) TCSPC (the best fit it is shown in black solid line). 15
Actually, it is well know that for a chromophoreattached to a proteinits motional freedom is restricted. Such restricted rotational diffusion is commonly described by the “wobbling-in-a-cone” model55 20 𝑟 𝑡 = 𝑟0 1 − 𝐴∞ 𝑒−𝑡 𝜏𝑅+ 𝐴∞ (4) 𝐴∞=𝑟𝑟∞ 0 = 1 2𝑐𝑜𝑠𝜃𝑚𝑎𝑥 1 + 𝑐𝑜𝑠 𝜃𝑚𝑎𝑥 2 (5) wheremax corresponds to the semicone angle defining the
25
restricted motion of the chromophore. Using r0 = 0.28 and r∞ =
0.10/0.14 for (S)- and (R)-FBP, values of max were calculated as
45° and 38°, respectively. Therefore,(R)-FBP will cover a smallersolid angle during its rotational diffusion than the(S)-enantiomer. This, together with the fact that its characteristic 30
reorientational time is much slower indicatesa more restricted conformation of the (R)-enantiomer within the protein.
Conclusions
The goal of the present work is to elucidate the interaction between the two enantiomers of flurbiprofen and tryptophan. To 35
this aim, we have comparedthe photophysical behaviour of the drug when covalently linked to Trp in model dyads with that of itsnon-covalent complex with human serum albumin.
A dramatic fluorescence quenching is observed in the dyads, which display only a residual emission assigned to the Trp 40
unit.According to the analysis of the FU decays, this quenching is dynamic (k > 1010 s-1) and stereoselective, with a higher rate constant for the (R,S)-diastereomer. The absence of 1FBP* fluorescence has previously been attributed to energy transfer to
Trp.38 While this explanation remains a possibility, it can neither 45
be confirmed nor discarded by the present time-resolved experiments. At longer timescales, a slower stereoselective quenching (k >109 s-1) of the1Trp* fluorescence isalso observed, together with exciplex formation.
Similar trends were observed in the drug/protein complexes, 50
although the kinetics of the involved processes are slower. Thefluorescence decayat em= 310 nm (FBP maximum)revealed
astereoselective dynamic quenching, both on the picosecond (FU) and nanosecond (TCSPC) timescales. This kinetic stereodifferentiation was still evident at longer wavelengths (380 55
nm), where only HSA is emitting. As in the dyads, the nature of thisslower quenching can be attributed to a stereoselective exciplex formation and/orelectron transfer.
Finally, theanisotropy at 310 nm recorded by TCSPC clearly showed that the protein microenvironment plays a significant role 60
in the conformational relaxation of FBP, which is more restricted in the case of the (R)-enantiomer. This stereoselectivity is possibly related to the modes of drug binding to the protein, a process of pharmacological relevance.
Comparing the behaviour of the dyads with that of the 65
complex, the same fundamental processes occur in the two systems, although on different timescales. The observed dynamic quenching rates are much lower in the latter,which can be understood in terms of the strong conformation dependence of the involved processes.
70
It should be noted that stereoelectronic effects are quite sensitive to the vector approach of the interacting partners. This is because a critical factor in stereodifferentiation is the relative spatial arrangement of the reactive sites, which is strongly influenced by the steric hindrance found in the approach 75
trajectories. Hence, the limitation of the degrees of freedom imposed by the covalent linker in the dyads is not comparable to the restrictions associated with the non-covalent, supramolecular binding existing in the protein complexes. As a consequence, the interest of the employed dyads as models is that they allow us to 80
predict the interchromophoric excited state interactions and to assess the dynamic nature of quenching, as well as to anticipate the possibility of observing stereodifferentiation in the involved processes. The magnitude of the kinetic rate constants, as well as the sign of stereodifferentiation, are expectedly difficult to 85
reproduce, also because the dyads lack the tertiary structure of proteins, whose folding generates the binding sites for complexed ligands. However, this limitation does not diminish at all the value of the dyads as well-defined chemical models to interrogate relevant interactions between photoactive drugs and the key 90
amino acids present at the protein binding sites.
Acknowledgements
Financial support from the Spanish Government (Grants CTQ2010-14882 and CTQ2009-13699, JCI-2011-09926,BES-2008-003314),the GeneralitatValenciana (Prometeo 2008/090) 95
and from the UniversitatPolitècnica de València (PAID 05-11, Ref 2766) is gratefully acknowledged.
0 20 40 60 80 100 0.0 0.1 0.2 0.3 0.4 Time / ps Anisot ropy 0 1 2 3 0.0 0.1 0.2 0.3 0.4 Anisot ropy Time / ns A B
Notes and references
aDepartamento de Química/Instituto de Tecnología Química UPV-CSIC,
UniversitatPolitècnica de València, 46022 Valencia, Spain. Fax:+34967879349; Tel: +34967877344; e-mail:mmiranda@qim.upv.es.
b CNRS, IRAMIS, SPAM, Francis Perrin Laboratoire, URA 2453, 91191 5
Gif-sur-Yvette, France. Fax: +330169087639; Tel: +330169084644; e-mail: thomas.gustavsson@cea.fr
1 T. Peters, in All About Albumin - Biochemistry, Genetics, and Medical
Applications, Academic Press, San Diego, 1995, ch. 3, pp. 76-132.
10
2D. C. Carter and J. X. Ho, Advances in Protein Chemistry, 1994, 45, 153-203.
3 U. Madsen, P. Kroogsgaard-Larsen and T. Liljefors, Textbook of Drug
Design and Discovery, Taylor and Francis, Washington DC, 2002.
4 B. Zimmermann, C. Hahnefeld and F. W. Herberg, Targets, 2002, 1, 15
66-73.
5J. Rovensky and D. Micekova, Drug Exp. Clin. Res, 2000, 26, 19-24. 6 N. Bellamy, W. G. Bensen, P. M. Ford, S. H. Huang and J. Y. Lang,
Clin. Invest. Med., 1992, 15, 427-433.
7D. S. Muckle, Am. J. Med., 1986, 80, 76-80. 20
8 M. Vetrugno, A. Maino, G. M. Quaranta and L. Cardia, Clin. Ther., 2000, 22, 719-731.
9H. A. Bae, K. W. Lee and Y. H. Lee, J. Mol. Catal. B-Enzym., 2006, 40, 24-29.
10 S. Sagdinc and H. Pir, Spectrochim. Acta A, 2009, 73, 181-194. 25
11 T. Wybranowski, M. Cyrankiewicz, B. Ziomkowska and S. Kruszewski, Biosystems, 2008, 94, 258-262.
12Y. V. Il'ichev, J. L. Perry and J. D. Simon, J. Phys. Chem. B, 2002,
106, 452-459.
13 Y. V. Il'ichev, J. L. Perry and J. D. Simon, J. Phys. Chem. B, 2002, 30
106, 460-465.
14M. C. Jimenez, M. A. Miranda, R. Tormos and I. Vaya, Photochem.
Photobiol. Sci., 2004, 3, 1038-1041.
15 I. Vaya, C. J. Bueno, M. C. Jimenez and M. A. Miranda,
ChemMedChem, 2006, 1, 1015-1020.
35
16 N. Seedher and S. Bhatia, J. Pharm. Biomed. Anal., 2005, 39, 257-262.
17 N. Seedher and S. Bhatia, Pharmacol. Res., 2006, 54, 77-84. 18 R. K. Nanda, N. Sarkar and R. Banerjee, J. Photochem. Photobiol. A, 2007, 192, 152-158.
40
19 Y. He, Y. W. Wang, L. F. Tang, H. Liu, W. Chen, Z. L. Zheng and G. L. Zou, J. Fluoresc., 2008, 18, 433-442.
20 B. Zhou, R. Li, Y. Zhang and Y. Liu, Photochem. Photobiol. Sci., 2008, 7, 453-459.
21 I. Vaya, R. Pérez-Ruiz, V. Lhiaubet-Vallet, M. C. Jiménez and M. A. 45
Miranda, Chem. Phys. Lett., 2010, 486, 147-153.
22 H. Vahedian-Movahed, M. R. Saberi and J. Chamani, J. Biomol.
Struct. Dyn., 2011, 28, 483-502.
23 B. Hemmateenejad, M. Shamsipur, F. Samari, T. Khayamian, M. Ebrahimi and Z. Rezaei, J. Pharm. Biomed. Anal., 2012, 67-68, 201-208. 50
24 U. Katrahalli, V. K. A. Kalalbandi and S. Jaldappagari, J. Pharm.
Biomed. Anal., 2012, 59, 102-108.
25 M. El-Kemary, M. Gil and A. Douhal, J. Med. Chem., 2007, 50, 2896-2902.
26 L. Tormo, J. A. Organero, B. Cohen, C. Martin, L. Santos and A. 55
Douhal, J. Phys. Chem. B, 2008, 112, 13641-13647.
27 S. Tardioli, I. Lammers, J. H. Hooijschuur, F. Ariese, G. van der Zwan and C. Gooijer, J. Phys. Chem. B, 2012, 116, 7033-7039.
28 D. P. Zhong, A. Douhal and A. H. Zewail, Proc. Natl. Acad. Sci.
U.S.A., 2000, 97, 14056-14061.
60
29 A. Douhal, M. Sanz and L. Tormo, Proc. Natl. Acad. Sci. U.S.A., 2005, 102, 18807-18812.
30 B. Cohen, J. A. Organero, L. Santos, L. R. Padial and A. Douhal, J.
Phys. Chem. B, 2010, 114, 14787-14795.
31M. Gil, Y. Wang and A. Douhal, J. Photochem. Photobiol. A, 2012, 65
234, 146-155.
32 Y. L. Wang, B. Cohen, L. Jicsinszky and A. Douhal, Langmuir, 2012, 28, 4363-4372.
33 P. G. Takla, S. G. Schulman and J. H. Perrin, J. Pharm. Biomed.
Anal., 1985, 3, 41-50.
70
34I. Lammers, V. Lhiaubet-Vallet, M. C. Jiménez, F. Ariese, M. A. Miranda and C. Gooijer, Chirality, 2012, 24, 840-846.
35 M. Amiri, K. Jankeje and J. R. Albani, J. Fluoresc., 2010, 20, 651-656.
36 J. R. Lakowicz, Principles of Fluorescence Spectroscopy, Plenum 75
Press, New York, 2006,ch. 16, 17, pp . 530-600.
37 I. Vaya, M. C. Jimenez and M. A. Miranda, J. Phys. Chem. B, 2007,
111, 9363-9371.
38 M. C. Jiménez, U. Pischel and M. A. Miranda, J. Photochem.
Photobiol. C, 2007, 8, 128-142.
80
39 S. Abad, U. Pischel and M. A. Miranda, J. Phys. Chem. A, 2005, 109, 2711-2717.
40 S. Abad, I. Vaya, M. C. Jimenez, U. Pischel and M. A. Miranda,
ChemPhysChem, 2006, 7, 2175-2183.
41 M. Montalti, A. Credi, L. Prodi and M. T. Gandolfi, Handbook of 85
Photochemistry, CRC Press, Taylor and Francis Group, Boca Raton Fl.,
2006.
42D. Rehm and.A. Weller,Isr. J. Chem. 1970, 8, 259-271.
43 T. Gustavsson, A. Sharonov and D. Markovitsi, Chem. Phys. Lett., 2002, 351, 195-200.
90
44 F. A. Miannay, T. Gustavsson, A. Banyasz and D. Markovitsi, J.
Phys. Chem. A, 2010, 114, 3256-3263.
45 D. Markovitsi, D. Onidas, F. Talbot, S. Marguet, T. Gustavsson and E. Lazzarotto, J. Photochem. Photobiol. A, 2006, 183, 1-8.
46 P. Bonancía, I. Vayá, M. J. Climent, T. Gustavsson, D. Markovitsi, 95
M. C. Jiménez and M. A. Miranda, J. Phys. Chem. A, 2012, 116, 8807– 8814.
47 J. W. Petrich, M. C. Chang, D. B. McDonald and G. R. Fleming, J.
Am. Chem. Soc., 1983, 105, 3824-3832.
48 H. Lemmetyinen, N. Tkachenko, A. Efimov and M. Niemi, J. 100
Porphyrins Phthalocyanines, 2009, 13, 1090-1097.
49 A. Siemiarczuk, C. E. Petersen, C. E. Ha, J. S. Yang and N. V. Bhagavan, Cell Biochem. Biophys., 2004, 40, 115-122.
50 J. M. Beechem and L. Brand, Annu. Rev. Biochem., 1985, 54, 43-71. 51A. Sarkar and S. C. Bhattacharya, J. Lumin., 2012, 132, 2612-2618. 105
52 W. Lu, J. Kim, W. Qiu and D. Zhong, Chem. Phys. Lett., 2004, 388, 120-126.
53 W. Qiu, L. Zhang, O. Okobiah, Y. Yang, L. Wang, D. Zhong and A. H. Zewail, J. Phys. Chem. B, 2006, 110, 10540-10549.
54 L. Zhang, Y.-T. Kao, W. Qiu, L. Wang and D. Zhong, J. Phys. Chem. 110
B, 2006, 110, 18097-18103.
55 G. F. Schroder, U. Alexiev and H. Grubmuller, Biophys. J., 2005, 89, 3757-3770.