Measuring Audience Retention in YouTube
Texte intégral
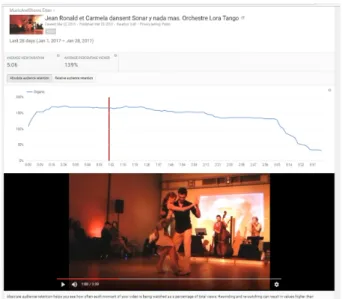
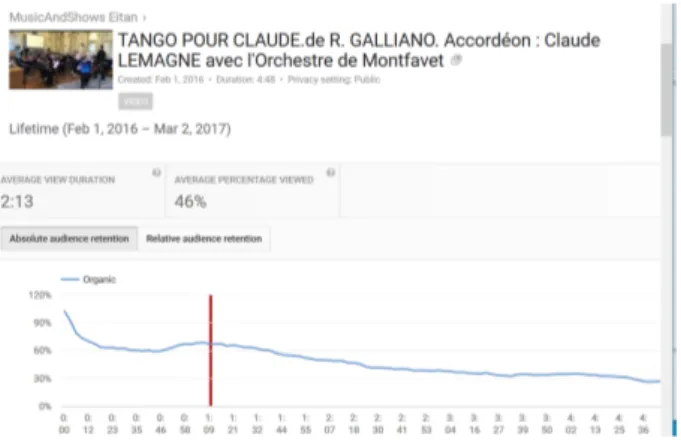
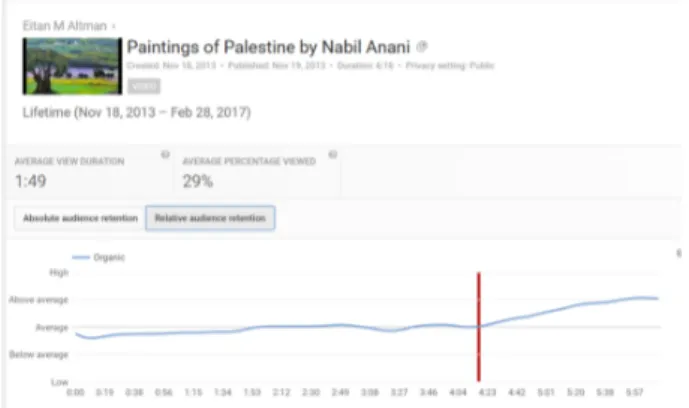
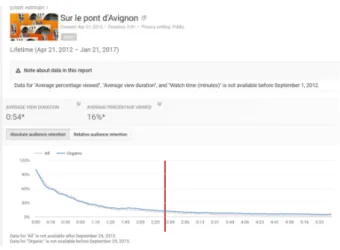
Figure
Documents relatifs
The background model adopted in the VRs is the same as in the SRs, with
For all the reasons just mentioned above, such partial inventories thus require implementing reliable numerical extrapolation procedure, so as to release as much information
[r]
tributes by laying the foundation for the construction of a YouTube clickbait corpus: (1) the YouTube 8M dataset is augmented with meta information not originally found in it,
We present an experimental study using virtual reality (VR) to investigate the effects of a real audience on social inhibition.. The study compares a multi-user application, locally
2: Screenshot of the YouTube browser extension, showing the three different event types: visual events (video shots below the video), occurrence events (contained named entities
Figure 32: Teachers' Challenges When Integrating YouTube Videos in the Classroom Question 10: Students would be more interested in learning the English language if the teacher
It is interesting to understand if the proposed approach can be successfully implemented even for new videos that have collected a right number of comments, partially addressing
