HAL Id: cea-00449251
https://hal-cea.archives-ouvertes.fr/cea-00449251
Submitted on 13 Sep 2019
HAL is a multi-disciplinary open access
archive for the deposit and dissemination of sci-entific research documents, whether they are pub-lished or not. The documents may come from teaching and research institutions in France or abroad, or from public or private research centers.
L’archive ouverte pluridisciplinaire HAL, est destinée au dépôt et à la diffusion de documents scientifiques de niveau recherche, publiés ou non, émanant des établissements d’enseignement et de recherche français ou étrangers, des laboratoires publics ou privés.
Bi-exponential decay of Eu(III) complexed by Suwannee
River humic substances: Spectroscopic evidence of two
different excited species
Pascal E. Reiller, Julien Brevet
To cite this version:
Pascal E. Reiller, Julien Brevet. Bi-exponential decay of Eu(III) complexed by Suwannee River humic substances: Spectroscopic evidence of two different excited species. Spectrochim-ica Acta Part A: Molecular and Biomolecular Spectroscopy, Elsevier, 2010, 75 (2), pp.629-636. �10.1016/j.saa.2009.11.029�. �cea-00449251�
Bi-exponential decay of Eu(III) complexed by Suwannee
River humic substances: Spectroscopic evidence of two
different excited species.
PASCAL E. REILLER* AND JULIEN BREVET
CE Saclay, CEA/DEN/DANS/DPC/SECR, Laboratoire de Spéciation des Radionucléides et des Molécules, Bâtiment 391-p.c. 33, F-91191 Gif-sur-Yvette CEDEX, France, Université d’Evry Val
d’Essonne, Laboratoire Analyse et Environnement pour la Biologie et l’Environnement, CNRS UMR 8587, Bâtiment Maupertuis, Boulevard François Mitterrand, F-91025 Evry CEDEX, France. * Corresponding author e-mail pascal.reiller@cea.fr
Spectrochimica Acta Part A: Molecular and Biomolecular Spectroscopy 75 (2), 629-636
http://doi.org/10.1016/j.saa.2009.11.029
Abstract
The bi-exponential luminescence decay of europium (III) complexed by Suwannee River fulvic acid (SRFA) and humic acid (SRHA), is studied in time-resolved luminescence spectroscopy using two different gratings at varying delay after the laser pulse, increasing accumulation time in order to obtain comparable signals. The two hypotheses found in the literature to interpret this bi-exponential decay are (i) a back transfer from the metal to the triplet state of the organic ligand, and (ii) the radiative decay of two different excited species. It is shown that evolutions of the 5D
0→7F0 and 5D0→7F2
luminescent transitions are occurring between 10 and 300 µs delay. First, the 5D
0→7F0 transition is
decreasing relative to the 5D
0→7F1 showing a slightly greater symmetry of the ‘slow’ component, and
is also slightly red-shifted. Second, a slight modification of the 5D
0→7F2 transition is also evidencing
a slightly different ligand field splitting. No significant modification of the 5D
0→7F1 magnetic dipole,
which is less susceptible to symmetry changes, is noted in line with expectations from symmetry changes. The 5D
0→7F0 transitions are adjusted with either one or two components. The use of a simple
component fit seems to be well adapted for representing an average comportment of these heterogeneous compounds, and a two-component fit constrained by the bi-exponential decay parameters and accumulation times yield in the proposition of the spectra for the fast and slow components.
1. Introduction
Humic substances (HS), mainly humic acids (HA) and fulvic acids (FA), are the main surrogate of natural organic matter (NOM) for the study of its metal complexation strength. Defined from their
alkaline extraction procedure, HS contain an important functionality inducing an important reactivity. Even if the intimate structure of HS, and thus the structure of formed complexes with metals, is still a matter of debate, a large number of complexation studies have been performed and a wide span of modelling strategies have been used. From the more “mechanistic models” it comes that different populations of sites, or different binding modes, must be accounted to monitor both the acid-base properties of NOM and the complexation isotherms [1-8]. Particularly, in the framework of lanthanides (Ln) and actinides (An) environmental chemistry, Eu(III)-HS complexes have been shown to be multidentate [6, 9-11] and involved more than one species [12-14].
The luminescence of lanthanides has been used either to study the complexation strength of HS [6, 9-12, 14-26] and to probe their chemical environment within complexes [12-14, 25-29]. In this field, a large body of work has been done in order to characterize the structure of Ln/An(III)-HS complexes including time-resolved luminescence spectroscopy (TRLS) [9-11, 13, 14, 20, 25, 26, 30], and to propose complexation ‘stability parameters’ [10, 15-19, 21-24]. Throughout these studies, a bi-exponential decay was noted for Ln/Cm(III), which was attributed either to the presence of two radiative decay processes linked to two excited species [9, 26, 30-33], probably in fast exchange, or to an energy back transfer from the excited level of the metal to the 3ππ* states of isolated organics around 19,000-25,000 cm-1 [25]. In the case of lanthanides, for thermal reasons this energy back transfer is probable for Tb3+, υ(5D4) = 20,400 cm-1, but do not seem to be possible for Eu3+, υ(5D0) =
17,257 cm-1 [34]. Nevertheless, given the available values for the average triplet state of NOM, i.e., from 14,000-15,500 to 20,500 cm-1 [35, 36], it seems that the probability for a back-transfer process, or ligand-to-metal charge transfer [37], to or through humic triplet state from 5D0 level of Eu(III) could
be favourable. It was anticipated that the apparent bi-exponential decay of Tb(III)–HS complexes was related (i) to the ‘intrisinc’ luminescence decay of the Ln(III)–HS complex and (ii) to a back-transfer from the Ln(III) to the humic chromophore introducing a diffusion parameter in the matrix of the humic aggregate [25]. Otherwise, authors proposed that two, or more, species should be taken into account [12-14, 22, 26]. Yoon et al. [12], Morgenstern et al. [22], and Rabung and Geckeis [26] proposed that the evolution of the double exponential decay vs. pH was linked to the evolution of the speciation of Eu(III)–HS and Cm(III)–HS complexes, respectively, proposing two [12], three according to Cm hydrolysis [22], and a heterogeneous distribution [26] of different species with different spectra out of a mostly continuous evolution between pH 2.8-9.6. After separation of fast dissociating complexes of Cm(III)–HA by Chelex resin, Monsallier et al. [30] did not evidence a bi-exponential decay nor a modification of the spectrum of slow dissociating Cm(III)–HA complex with delay. Rabung and Geckeis also did not note a modification of the spectra at different delay for an ‘intact’ Cm(III)–HA complex [26]. But these two latter comparisons were done after normalization with the same accumulation time and the obtained spectra at higher delay were inevitably rather noisy. More recently, Freyer et al. proposed evolutions of emission spectra of a Cm(III)–HA complex with delay in D2O (fig. 7 in [38]) and in H2O (not shown in [38]). Hence, whilst the large body of work
available, the structure and photophysics of Ln/An(III)–HS complexes are still a matter of debate. Two situations are thus possible that are not easily settled: (i) a back-transfer energy is occurring and no modification of the luminescence spectrum of Ln3+ can occur because there should be no perturbation of the ligand field; (ii) two processes from two excited species are contributing to the radiative decay and modifications of the Ln(III)–HS complexes should be observed if the ligand fields are sufficiently different; (iii) a combination of the two preceding propositions. In the latter case, modifications of the 5D0→7F0 transition, forbidden for magnetic and electric reasons [39, 40], and also
Two possibilities are offered to enhance the resolution of a luminescence spectrum in aqueous solution: first, decreasing the temperature to eliminate the non-radiative temperature dependant decay processes [29], and second, increasing the resolution of the spectrometer for the studies in solution at ambient temperature [41]. The aim of this work is to take advantage of a more resolutive grating (1800 lines mm-1) to obtain information on the possible modification(s) of Eu(III)–HS complexes luminescence spectra of Suwannee River fulvic acid (SRFA) and humic acid (SRHA) during the luminescence decay.
2. Material and Methods
SRFA and SRHA were used as received from the International Humic Substances Society. Europium (III) stock solution was obtained from the dissolution of Eu2O3 (Johnson Matthey, 99.99%)
in HClO4. The Eu(III)–HS complexes were formed in HS solutions as in ref. [10, 11], with 10-5 molEu
L-1 and 200 mgHS L-1; all of Eu(III) is then considered to be complexed by HS [10] even if the ratios
between Eu and the number of available sites are slightly different [42, 43]. The ionic strength was fixed with NaClO4 to 0.1 mol L-1 and pH was adjusted using freshly prepared NaOH and HClO4. The
pH measurements were done using a combined–glass electrode (Radiometer Analytical XC111) calibrated for its linear response with a 0.01 mol L-1 HClO4 solution, an equimolar 0.02 mol L-1
NaH2PO4/Na2HPO4 solution and an equimolar 0.02 mol L-1 Na2CO3/NaHCO3 solution, all containing
NaClO4 to keep [Na+] constant at 0.1 mol L-1 (pH = 2.0, 6.8, and 9.9 respectively). The electrode filling
solution was modified with NaClO4 0.1 mol L-1, NaCl 10-2 mol L-1 to prevent KClO4 precipitation in
the frit of the electrode.
Before measurement the pH was adjusted to 5 to minimize hydrolysis and carbonate species of Eu(III) and maximize the Eu(III)–HS complex formation. Under these conditions, 99% of Eu(III) is complexed in humic form [10, 44].
Eu(III) was used to probe its laser induced luminescence properties in contact with humic substances. The observed luminescence corresponds to the 5D0→7F0 (electric and magnetic dipole
forbidden, maximum around 580 nm), the 5D0→7F1 transition (magnetic dipole, maximum around 593
nm), and the 5D0→7F2 ‘hypersensitive’ transition (electric dipole, maximum around 615 nm). These
emission lines come from transitions of the 5D0 excited state to the ground 7Fj manifold [45].
The excitation laser beam was generated by a 355 nm tripled output of a Continuum Nd-YAG laser, coupled to an optical parametric oscillator system (Panther II, Continuum, USA). The wavelength was tuned to 394.6 nm, which corresponds to the 7F0→5L6 transition of Eu(III), providing about 1 mJ of
energy in a 5 ns pulse with a repetition rate of 10 Hz. After inner conversion the 5D1 level is transferring
energy to the 5D0 level and the transitions to the 7Fj manifold can be observed. Additionally, HS are
able to absorb the laser emission at 394.6 nm and part of the absorbed energy is transferred from the
3ππ* triplet level to the central europium ion. The time-resolved luminescence signal is collected at
90° and focused into a Acton spectrometer (slit 1 mm) using either a 600 lines mm-1 or a 1800 lines mm-1 grating. The signal is collected during a gate width W = 300 µs, after a gate delay D = 10 µs after excitation by the laser flash. The accumulation time was adjusted from the intensities obtained at the different delays in agreement with ref. [41]. Emission spectra were recorded using a CCD camera cooled at -15°C.
The absorbance values at 394 nm of SRFA and SRHA are 0.429 and 0.947, respectively; the pre-filter effect is reasonable compared to other samples [Table 3 in ref. 41], and the presented spectra did
not require any smoothing treatment. The absorbance at 591 nm is 0.017 for SRFA the post filter effect could be neglected.
3. Results and Discussions
3.1. Evolution of the spectra under comparable acquisition conditions at 600 lines mm-1.
The luminescence decays of the various Eu(III)-HS complexes can be described by a bi–exponential decay function. For our fully integrative system, it comes:
Fi =
i=1 n D D+W Foi exp – t τi dt =
i=1 n Foi i exp – D i 1 – exp – W i (1),where F is the luminescence signal, F°i and τi are the initial luminescence and the decay time of
component i, respectively, D the delay after the laser excitation and W the gate width.
First, the eventual photochemical reactions [30] of humic substances were tested. The acquisitions of the spectra reported on Figure 1A,B for Eu(III)-SRFA and Eu(III)-SRHA, respectively, were not done in a ‘classical’ way. In order to obtain spectra that can be compared with almost the same signal, the number of accumulations was corrected at each delay D, i.e., 10, 50, 100, 200, and 300 µs, using the gate width W = 300 µs, from the evolution of the bi-exponential decay obtained previously [41]. Nevertheless, this induces a decrease in the signal–to–noise ratio. These spectra indicate a strong interaction with the humic medium from the asymmetry ratio 5D
0→7F2/5D0→7F1, i.e., 3.0 and 3.9,
based on peak area, for Eu(III)-SRFA and Eu(III)-SRHA, respectively. Also one can see on Figure 2, that no loss in Eu(III) fluorescence emission can be evidenced on 5D0→7F1 nor on 5D0→7F2 transitions
based on peak area. The accumulation times and induced absorbed energies for the different delays are reported in Table 1: a negligible photo-degradation is then awaited [46]. However, a significant decrease of the 5D0→7F0 transition is evidenced on Figure 2 from the peak areas and from the 5D
0→7F1/5D0→7F0 ratio when the 5D0→7F2/5D0→7F1 ratio is constant. The use of the more resolutive
Figure 1. Luminescence spectrum of Eu(III)-SRFA (A) and Eu(III)-SRHA (B) complexes at λexc =
394.6 nm at different delays, W=300 µs, pH=5, and 600 line mm-1, increasing the number of
accumulation in order to obtain the same signal on the 5D
0→7F1 transitions; the spectra are
normalized to counterweight the slight laser energy variations.
570 580 590 600 610 620 630 640 Wavelength (nm) F ( a .u .) 10 µs 50 µs 100 µs 200 µs 300 µs 570 580 590 600 610 620 630 640 Wavelength (nm) F ( a .u .) 10 µs 50 µs 100 µs 200 µs 300 µs 10 µs 50 µs 100 µs 200 µs 300 µs 10 µs 50 µs 100 µs 200 µs 300 µs A
Table 1: Parameters of the spectra acquisition of Figures 1 and 3.
Grating 600 lines mm-1
Delay (µs) 10 50 100 200 300
Nb Acc mJ/mg Nb Acc mJ/mg Nb Acc mJ/mg Nb Acc mJ/mg Nb Acc mJ/mg SRFA 600 1.5 925 2.3 1340 3.4 2900 7.3 5000 12.5 SRHA 1000 2.5 1873 4.7 2730 6.8 5154 12.9 8740 21.9
Grating 1800 lines mm-1
Delay (µs) 10 50 100 200 300
Nb Acc mJ/mg Nb Acc mJ/mg Nb Acc mJ/mg Nb Acc mJ/mg Nb Acc mJ/mg SRFA 1000 2.5 1440 3.6 2204 5.5 4500 11.3 8400 21.0 SRHA 2000 5.0 3564 8.9 5332 13.3 9980 25.0 16867 42.2
Figure 2: Evolution of the experimental 5D
0→7F2/5D0→7F1 (diamonds) and 5D0→7F0/5D0→7F1
(squares 600 mm-1, circles 1800 mm-1) peak area ratios of Eu(III)-HS complexes at 10-5 mol
Eu L-1
and 200 mgHS L-1 on Figure 1 and Figure 3AD, for SRFA (full symbols) and SRHA (empty
symbols). 2.000 3.000 4.000 0 50 100 150 200 250 300 350 Delay (µs) 5 D 0 → 7 F 2 / 5 D 0 → 7 F 1 SRFA 7F2/7F1 600/mm SRHA 7F2/7F1 600/mm 0.080 0.112 0.144 0 50 100 150 200 250 300 350 Delay (µs) 5 D 0 → 7 F 2 / 5 D 0 → 7 F 1 SRFA 7F0/7F1 600/mm SRHA 7F0/7F1 600/mm SRFA 7F0/7F1 1800/mm SRHA 7F0/7F1 1800/mm SRFA 7F 2/7F1 600 mm-1 SRHA 7F 2/7F1 SRFA 7F 1/7F0 SRHA 7F 1/7F0 SRFA 7F 1/7F0 1800 mm-1 SRHA 7F1/7F0
3.2. Evolution of 5D
0→7F0 at 1800 line mm-1 grating.
Due to the increase in resolution and the lesser convolution with the spectrograph’s parameters, the
5D
0→7F0/5D0→7F1 and 5D0→7F2/5D0→7F1 ratios obtained hereafter are inevitably different from what
they appeared in the previous section. As for the 600 lines mm-1 grating, the accumulation times and absorbed energies are reported in Table 1; a negligible photo-degradation is awaited. A slight normalization was done in order to get rid of the laser energy variations for these particularly long integration times. The spectra for the two complexes acquired with the 1800 lines mm-1 grating are presented on Figure 3.
First, we will focus on the 5D
0→7F0 transition around 579 nm. This transition is much more intense
due to the higher resolution, and lower convolution with the spectrometer’s parameters. This results in significantly different 5D0→7F0/5D0→7F1 area ratios of 0.87 and 0.99 for Eu(III)-SRFA and
Eu(III)-SRHA, respectively. As seen previously, the non-degenerated 5D0→7F0 transition is clearly
decreasing and very slightly red shifted (Figure 3C,F). It seems that for Eu(III)-SRFA and Eu(III)-SRHA the two components proposed for other HS [12-14] can also be seen by the decrease in the 5D0→7F0/5D0→7F1 ratios on Figure 2. This decrease is linearly correlated with delay for both
extracts. There is no apparent reason for this linear correlation with delay apart from a too narrow observation window because both components already contribute more or less equally to the luminescence signal at a 10 µs delay. Knowing that the luminescence decay is (bi)exponential, one could await an exponentially dependant expression. The evolution of 5D
0→7F0/5D0→7F1 ratios for
Eu(III)-SRHA complex is very much alike the Eu(III)-SRFA one. One can note that the
5D
0→7F0/5D0→7F1 intensity ratio for SRHA is greater than the SRFA one. This reflects the fact that
when the delay is increasing, 5D
0→7F0 intensities of Eu(III)-SRFA and Eu(III)-SRHA tend to be closer
ending in the same value (±2σ) of 0.72 ± 0.02 and 0.74 ± 0.05 for Eu(III)-SRFA and Eu(III)-SRHA, respectively, at D = 300 µs.
The use of 5D0→7F0 transition was either dedicated to define the number of species involved due to
its non-degenerescence after direct 7F0→5D0 excitation or to the determination of the charge of the
complex [47-49]. Its appearance in the spectra is correlated with the lowering of the complex’s symmetry [39, 40]. The decompositions of the non-degenerated 5D0→7F0 transitions were often done
using Lorentzian-Gaussian peak [50].
Ii = Imax,i exp-0.5 λi - λ0 ,i σLG,i ² λi - λ0,i σLG,i ² + 1 (2)
Using non-linear regression, the different parameters, i.e., Imax,i the maximum intensity of the ith
peak, λ0,i its position of its maximum (nm), σLG,i its ‘standard deviation’ linked to its full-width at
mid-height w (nm), 1.46 × σLG,i = w [50], can be obtained. The associated standard deviations of the
Figure 3: Luminescence spectra of Eu(III)–SRFA (A to C) and Eu(III)–SRHA (D to F) complexes
at λexc = 394.6 nm at different delays, W=300 µs, pH=5, increasing the number of accumulation in
order to obtain the same signal on the 5D
0→7F1 transitions, in the wavelength spans 575-600 nm
(A,D), and 605-630 nm (B, E), and the magnification of the 577-581 nm wavelength span (C, F); the spectra are normalized to counterweight the slight laser energy variations.
Although fits with two components were proposed for HS [12-14], one can think that a fit by a single component would give an averaged value of the Eu(III) comportment in HS (Figure S1 and Table S1 from the Supplementary Material). The values of σLG are more or less constant giving w ≈ 1.05 that is
comparable to former determinations in direct 7F0→5D0 excitation [12-14]. Conversely, the evolutions
of Imax,i, i.e., 5D0→7F0/5D0→7F1, and λ0,i are opposed: as the delay is increasing the maximum intensity
of the 5D0→7F0/5D0→7F1 ratio is decreasing from 0.85 ± 0.01 to 0.72 ± 0.0003, and λ0 is slightly
red-shifted of 0.05 for both SRFA and SRHA. 10 µs 50 µs 100 µs 200 µs 300 µs 575 580 585 590 595 600 Wavelength (nm) F (a .u ) 5 D0→7F0 5D0→7F1 10 µs 50 µs 100 µs 200 µs 300 µs 575 580 585 590 595 600 Wavelength (nm) F ( a .u .) 5D 0→7F0 5D0→7F1 10 µs 50 µs 100 µs 200 µs 300 µs 605 610 615 620 625 630 Wavelength (nm) F ( a .u ) 5 D0→ 7 F2 10 µs 50 µs 100 µs 200 µs 300 µs 605 610 615 620 625 630 Wavelength (nm) F ( a .u .) 5 D0→7F2 10 µs 50 µs 100 µs 200 µs 300 µs 577 578 579 580 581 Wavelength (nm) F (a.u) 5 D0→ 7 F0 10 µs 50 µs 100 µs 200 µs 300 µs 577 578 579 580 581 Wavelength (nm) F ( a .u .) 5 D0→ 7 F0 A D B C F E
Here for the Eu(III)–SRFA and Eu(III)–SRHA complexes the mono component peak fits are in agreement with the maximum emission of either a EuCl2+ complex or Eu(III) in methanol directly excited in the 7F0→5D0 transition [48, 52]. This indicates the low average charge of the ‘complexing
unit’, i.e., around -0.9 and -1.3 at 10 and 300 µs delay, respectively [48]. One should note that this is not the charge of a ‘humic molecule’, which is still up to now not really defined. From the relation between the number of coordinated ligands CN and υ0 (cm-1) proposed for the 5D0→7F0 transition [49],
i.e., CN = 0.237 Δυ + 0.638, values from SRFACN = 2.0 and SRHACN = 1.6 at 10 µs delay, to SRFACN = 2.3 and SRHACN = 1.9 at 300 µs delay, are obtained; these values are not significantly different (CN ± 0.7) and are in line with the complexation of Eu(III) through a multidentate form [10]. As previously seen, the estimations from τ2 of the number of water molecules remaining in the first hydration sphere,
7 and 5 for Eu(III)–SRFA and Eu(III)–SRHA, respectively, are also indications of multidentate complexation [41]. Rabung and Geckeis proposed about the same number of remaining water molecules for Cm(III) complexed by Gorleben (Germany) HA [26]. Nevertheless, one can question the validity of CN and number of water molecules expressions for complex mixtures as humic substances. As a matter of fact quenching effect from humic chromophores may have an influence on non-radiative de-excitation pathways of the complexed metal even if not in direct contact within the humic aggregates. Moreover, these expressions have not yet been validated in this case.
The calculation for the fast decay time cannot be done for several reasons. First the proposed empirical expressions are given relative to the aqueous Eu3+, which have a decay time value circa 110 µs. Up to now, the values measured for τ1 are ranging from 20 to 60 µs [11, 41] depending on total Eu
and HA concentrations and origin of humic extracts. This means that (i) part of the luminescence of Eu is quenched within the humic structure by chromophores that may not be in direct complexation, and/or (ii) a fast exchanging process is occurring within the structure. The energy transfer could be due either to a Förster resonance energy transfer (FRET) or Dexter energy transfer, respectively [53]. FRET can be operative over distances as long as 100 nm depending on the particular donor-acceptor pair. The energy transfer according to Dexter requires an overlap of the electron orbital of the donor and the acceptor. As the distance between the ligands and Eu(III) is relatively short, the Dexter energy transfer could be favoured. So far, in the case of HA, the link between the binding sites and the chromophores engaged in the energy transfer has not been demonstrated unequivocally. Thus, the resonance phenomenon cannot be ruled out.
The decomposition in two peaks of 5D0→7F0 transitions using Equation (2) was done for the five
delays altogether and adjusting only Imax,i, λ0,I, and σLG,i: the different proportions of the two species
were fixed by the bi-exponential decays’ fits proposed otherwise [41], and the accumulation times. The obtained fits are reported on Figure S2 (A to E) for SRFA and Figure S2 (F to J) for SRHA, from Supplementary Material; the parameters of the fits and the correlation matrices are given in Table S2. The difference between the peak maximum, i.e., Δλ0 = λ0,2 – λ0,1, are of 0.10 ± 0.01 for SRFA, and
0.07 ± 0.01 nm for SRHA, which is lower than previously obtained from soil HS, i.e., Δλ0 = 0.2 nm
[13, 14]. The σLG,I values are not statistically different around 0.7 nm (wi 1–1.1 nm), not very different
from the single component fits, and both Imax,1 and λ0,1 are different from the single component fits
situation: both Imax,2 and λ0,2 correspond to the mono-exponential fits at 300 µs. This means that even
the two component situation could be the result of two different populations of environments and not two well–defined environments. This can be reconciled to the continuous description of acid-base and complexation properties of humic substances [1, 2, 4, 7].
The w values from the fits can be discussed in the light of the literature data. The full–width at mid– height of ‘simple’ complexes were found to be w = 0.2–0.5 nm; w viz. 0.2 nm for EuCH (COO)3-n
complexes (1 n 3) [54], w viz. 0.3 nm in the case of tris(2,2,6,6-tetramethyl-3,5-heptanedionato)-Eu(III) at 298 K [37], w viz. 0.4-0.5 nm can be estimated for dipicolinato-tris(2,2,6,6-tetramethyl-3,5-heptanedionato)-Eu(III) [28] and for iminodiaceto-Eu(III) [47], and a w viz. 0.2 nm can be estimated for Eu(III) complexed to the 5-fold sites of the icosahedral satellite tobacco necrosis virus [55]. For humic substances, Shin et al. [13] proposed two contributions for Eu(III) soil FA and soil HA complexes: Δλ0 ≈ 0.2 nm, and FAw viz. 0.6
nm, and HAw viz. 1.0 nm. Later, Shin and Choppin proposed two component peaks for Aldrich HA
with σLG = 10-19 cm-1 as function of Eu/HA concentration ratio [14], yielding a total HAw viz. 0.9 nm.
There seems to be an agreement between w values for dipicolinato–Eu(III) [28], iminodiaceto–Eu(III) [47], and Eu(III)–soil FA [13, 14], but not for Eu(III)–soil HA or Eu(III)–PAHA. Here, we obtain
SRFAw ≈ 1.05 ± 0.02 nm and SRHAw ≈ 1.06 ± 0.01 nm for a single component fit; as said earlier, the w
values do not result in ‘simple’ complexation environments, and should thus be the caused by two (or more) ‘populations of environments’. This is not surprising as the HS mixtures are considered as continuum of chromophores [56] or of functional groups [2, 4, 7] or of molecular compositions [57-59].
One could also remark that the spectrometer’s parameters may not be directly comparable leading to the convolution of the ‘true’ signal and the distortion of the spectrometer and thus to a broadening, and an accompanied decrease in intensity of the observed peaks, as it was observed with our 600 lines mm-1 grating, whereas literature data were obtained in 7F0→5D0 excitation [13, 14, 28, 47, 54].
Nevertheless, the good agreement between the full–width at mid–height of previous humics data and the resolution of the peaks is a strong indication of a significant difference between “simple complexant” and our results.
The 5D0→7F1 transition does not seem to undertake such evident modification for each sample, in
line with the independence of this magnetic dipole transition to the ligand field.
3.3. Evolution of the 5D
0→7F2 transition at 1800 lines mm-1.
Concerning the 5D0→7F2 hypersensitive transition, there is almost no modification of the maxima
intensity between 614.35 and 614.44 nm for SRFA and SRHA, but weak interesting and significant modifications can be seen at the shoulder around 612 nm. The average of normalized intensities of five pixels around 612.25 nm on Figure 3B,E are reported on Figure 4. The error bars (2σ) are the results of the propagation of uncertainties between Imax(7F2) and I612.25 nm, and the straight lines through
the points are given as guide to the eye. For the two Eu(III)–HS complexes, the relative fluorescence intensity of the 612 nm shoulder is decreasing. It is worthy to notice that this shoulder in 5D0→7F2 was
identified as being one of the main difference between the humic extracts from different origins analyzed in a previous work [41]. Even if it seems difficult to unambiguously ascertain the decrease of this shoulder, due to the uncertainty of this fluorescence ratio, these slight modifications could also be linked to a difference in the symmetry of the Eu(III)-HS complexes with delay through a change in the splitting of the 5D0→7F2 level. This is another indication which adds to the unambiguous decrease
in symmetry previously evidenced from changes in the 5D0→7F0 transitions. Without line narrowing
experiment at lower temperature, no assignment to point symmetry group can be done but it must be more symmetric than D2h as no splitting in the 5D0→7F1 transition can be observed [60]. Nevertheless,
it seems that a double radiative process, involving two different excited species, is involved in the bi– exponential decay.
Figure 4: Normalized fluorescence intensities at λem = 612.25 ± 0.05 nm shoulder in Eu(III)-SRFA
(full circle, from Figure 3B,) and Eu(III)-SRHA (empty square, from Figure 3E). [Eu] = 10-5 mol
L-1, pH = 5, I = 0.1 mol L-1 (NaClO
4).
3.4. Decomposition of the radiative component.
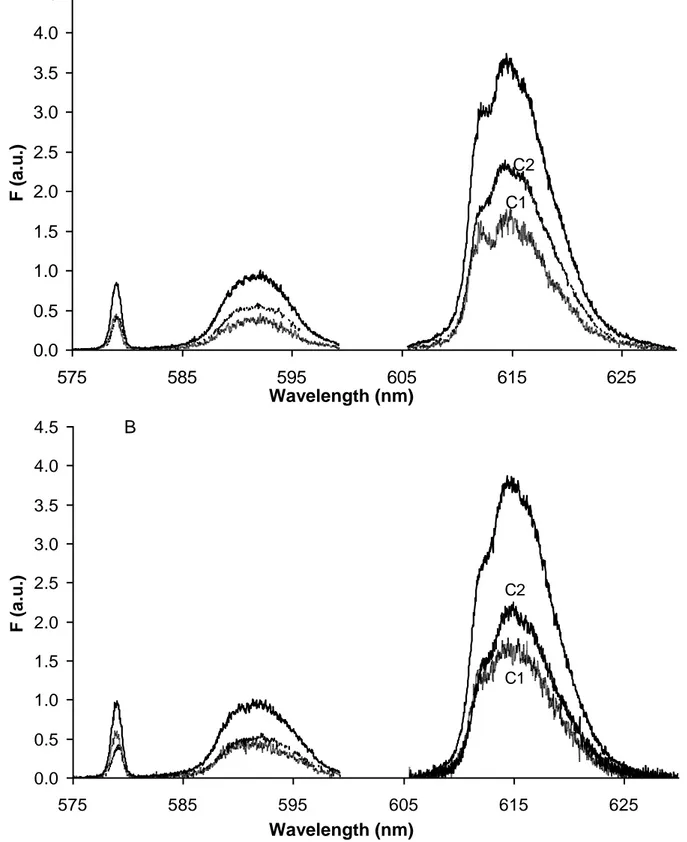
It can be postulated that two different radiative processes can be identified during the luminescence decay of Eu(III)–HS complexes using the 1800 lines mm-1 grating. From the modelled decay of Eu(III)–SRFA and Eu(III)–SRHA [41], it becomes evident that the contribution of the ‘fast’ component 1, τ1 = 41 ± 5 µs, is totally suppressed after a 300 µs delay. At this delay time, it accounts
for 0.45 ± 0.04 % of the total Eu(III)-SRFA complex luminescence; the total luminescence signal at a
300 µs delay represents 7.9 ± 0.5 % of the luminescence at 10 µs delay. The spectrum of the ‘slow’ component C2 can then be considered to be the one at D = 300 µs (dashed line on Figure 5A). Knowing the decay time of this ‘slow’ C2 [41], i.e., τ2 = 144 ± 6 µs, and that it contributes to 58.8 ± 4.0 % of
the luminescence at D = 10 µs, the normalized signal of this component 2 can be subtracted to the luminescence signal at D = 10 µs to obtain the spectrum of the ‘fast’ component C1 (dotted line on Figure 5A). It is then evident that the two contributions have different spectra. The 5D0→7F0/5D0→7F1
ratios of 1.1 and 0.8 for the ‘fast’ and ‘slow’ components, respectively, can be obtained. Similarly, the
5D
0→7F2/5D0→7F1 ratios are around 3.4 and 3.9 for the fast and slow component, respectively.
The same treatment can be done for the Eu(III)–SRHA complex. Under these conditions, τ1 = 53 ±
6 µs and τ2 = 191 ± 12 µs [41], which means that the ‘fast’ C1 component only contributes to 1.4 ±
0.3 % of the luminescence at D = 300 µs. Using the same approximation than in the case of Eu(III)-SRFA, the ‘slow’ component C2 contributes to 57.4 ± 12.4 % of the total luminescence at D = 10 µs, and the spectra can be proposed (Figure 5B). The two contributions end in different spectra:
5D
0→7F0/5D0→7F1 ratios of 1.2 and 0.7, and the 5D0→7F2/5D0→7F1 ratios are around 3.6 and 3.9 for
the ‘fast’ and ‘slow’ components, respectively. These values are less reliable than in the case of Eu(III)–SRFA due to the higher uncertainties of the parameters of the fit [41].
0.60 0.65 0.70 0.75 0.80 0.85 0.90 0 50 100 150 200 250 300 Delay (µs) F (6 1 2 .2 5 n m )/ m a x ( 5D 0 → 7F 2 )
Wavelength (nm)
Wavelength (nm)
Figure 5. Spectra of Eu(III)-HS complexes (bold plain line) at λexc = 394.6 nm, D = 10 µs, W = 300
µs, of Eu-SRFA (A) and Eu-SRHA (B) complexes, and spectra of the slow component (C2, thin plain) at D = 300 µs, W = 300 µs normalized to its relative importance at D = 10 µs; the spectrum of the fast components (C1, dotted line) are obtained subtracting C2 from the signal F at D = 10 µs.
The occurrence of a bi–exponential decay was not solely observed in the case of humic complexes. Fujiwara et al. [31], observed also a bi-exponential decay of two complexes between Eu(III) 4,4,4-trifluoro-1-(2-thienyl)-1,3-butanedione and 4,7-diphenyl-1,10-phenanthroline disulfonate at the toluene-water interface. Tsukahara et al. [32], observed that in the presence of thenoyl trifluoroacetone (TTA), EuTTA2+ complex undergone a luminescence decay with k1 = 3.6 104 s-1 (τ1 = 27.7 µs) and k2
C2 C1 0.0 0.5 1.0 1.5 2.0 2.5 3.0 3.5 4.0 4.5 575 585 595 605 615 625 Wavelength (nm) F ( a .u .) F F2 F1 5 D0→ 7 F2 5 D0→ 7 F0 5 D0→ 7 F1 C2 C1 0.0 0.5 1.0 1.5 2.0 2.5 3.0 3.5 4.0 4.5 575 585 595 605 615 625 Wavelength (nm) F (a .u .) F F2 F1 A B
= 5.78 103 s-1 (τ2 = 173 µs). The authors proposed that the Eu*-TTA2+ excited complex can undergo a
deactivation to Eu-TTA2+ and a dissociation reaction ((Eu3+)* + TTA–). The fast component, i.e., k1 =
1/τ1, being the deactivation of (Eu3+)*, after the dissociation of Eu*-TTA2+, and the slow component,
i.e., k2 = 1/τ2, being the sum of the dissociation of Eu*-TTA2+ and of its deactivation. The system of
equation was solved with the hypothesis that Eu-TTA2+ complex should have seven remaining water molecules. This reaction and deactivation scheme is difficult to be fully applied here as we do not have enough information about the hydration number of the humic complexe(s). Particularly, the influence of D2O in the particular humic mixtures is not fully clarified for Ln/An(III). Under these conditions
one could come to the conclusion, after Tsukahara et al. scheme [32], that the slow component C2 could be the spectrum of the excited complex, and fast component C1 could be the spectrum of the excited (Eu)* in the system.
Freyer et al. also proposed a fast exchange mechanism between Cm3+ and Cm(III)–HA complex [33] when pH ≤ 5.5, but comparing the results is difficult because Freyer et al. seem to detect the characteristic luminescence spectrum of Cm3+ both in D2O and H2O (λmax = 594 nm, τ1 ≈ τCm3+), while the spectrum we are obtaining at low delay is not characteristic of Eu3+ (5D0→7F2/5D0→7F1 = 0.25).
Also the reasons of the luminescence quenching (τ1 ≤ τEu3+) is not clear. As recalled earlier, either Förster resonance or Dexter energy transfer are likely in humic substances’ structure. It is thus likely that the excited (Eu)* is more efficiently quenched than (Cm)*. Regarding the 5D0→7F2/5D0→7F1
ratios and spectra, this means that only few differences exist between these species in term of symmetry because (Eu)* seem to be still be under the influence of the complexation environment [33]. Billard & Lützenkirchen [61] proposed that in the case of a fast exchange mechanism, where photochemical processes are not fast enough to fully mix the excited states, the apparent decay time values should change with the concentration of ligand. This was observed in two of our previous studies were Eu(III) was fully complexed by the same HA sample from Gorleben, Germany [11, 41], but was not put in relation until now. In Marang et al. for cEu = 7 µmol L-1 and cHA = 20 mg L-1 (I = 1
mmolNO3 L
-1, 99.2% Eu–HA, 2.86 mg
AH mol-1Eu), τ1 = 17 ± 2 µs and τ2 = 135 ± 2 µs were obtained [11],
whereas in Brevet et al. for cEu = 10 µmol L-1 and cHA = 200 mg L-1 (I = 0.1 molClO4 L
-1, 99.4% of Eu–
HA, 20 mgHA mol-1Eu), τ1 = 60 ± 6 µs and τ2 = 172 ± 11 µs were obtained [41]. Further works are in
progress to ascertain this trend.
Another likely explanation would be two populations of complexes of relatively close symmetry, as proposed between two successive glycolate complexes by Stumpf et al. [62], or by Rabung and Geckeis [26] for fast and slow dissociating Eu(III)–HA complexes after the works from Monsallier et
al. [30]. This interpretation would lead to two complexes of slightly different symmetry, as evidence
by changes in shape of 5D0→7F0 and 5D0→7F2 transitions, but comparable complexation strength from
the 5D0→7F2/5D0→7F1 ratio. It is up to now not possible to firmly discriminate between these
situations.
4. Conclusion
It is shown that the bi–exponential decay commonly observed for the luminescence of Eu(III)–HS complexes is the result of the deactivation of at least two different excited states. The main evolution of the luminescence spectra of the two decays resides in the 5D
0→7F0 transition. When increasing the
delay of observation after the laser pulse, a decrease of the 5D
0→7F0/5D0→7F1 ratio is clearly
evidenced, as well as a slight red shift of the 5D
0→7F0 transition. The 5D0→7F1 transition do not seem
to undergo any noticeable change, but the shoulder around 612 nm of the 5D
implied in the differences of luminescence spectra of Eu(III)–HS complexes of different origins [41], is submitted to a subtle decrease with delay. Both the decrease of 5D
0→7F0 transition and slight
modification of 5D
0→7F2 transition are indications of at least two species sharing a very close
symmetry. It is then possible that the fast component of the bi-exponential decay could be a dissociated excited species (Eu)*, still under the influence of the ligand field induced by the HS environment and/or a fast exchanging humic species. This fast component exhibiting a decay time shorter than the aquo Eu3+ is submitted to quenching mechanisms by the chromophores within the humic structure.
Further works are required in order to discriminate the component of the slow component, which should be composed of the eigen luminescence decay of the (Eu*)–HS excited complex, and its dissociation to Eu* + HS, to ascertain the mechanism.
Acknowledgements
We thank Drs. Thomas Vercouter (CEA), Clemens Walther (INE) and François Viala (CEA) for helpful discussions. This work was financed through the “FUNMIG project” (EC: FUNMIG- NUWASTE-2004-3.2.1.1-1), and the MRTRA project of the Risk Control Domain (CEA/DEN/DDIN) and the CHSOL project of the RdB Domain (CEA/DEN/DSOE) of CEA
5. References
[1] A.M. Posner, J. Soil Sci. 17 (1966) 65.
[2] E.M. Perdue, C.R. Lytle, Environ. Sci. Technol. 17 (1983) 654-660.
[3] G.R. Choppin, B. Allard, Complexes of actinides with naturally occurring organic compounds, in: A.J. Freeman and C. Keller (Eds.), Handbook on the Physics and Chemistry of the Actinides, Elsevier, 1985, pp. 407-429.
[4] R.S. Altmann, J. Buffle, Geochim. Cosmochim. Acta 52 (1988) 1505-1519.
[5] P. Warwick, A. Hall, D. Read, Radiochim. Acta 66/67 (1994) 133-140.
[6] H.S. Shin, B.H. Lee, H.B. Yang, S.S. Yun, H. Moon, J. Radioanal. Nucl. Chem. 209 (1996) 123-133.
[7] D.G. Kinniburgh, W.H. van Riemsdijk, L.K. Koopal, M. Borkovec, M.F. Benedetti, M.J. Avena, Colloids Surf. A 151 (1999) 147-166.
[8] E. Tipping, Aquat. Geochem. 4 (1998) 3-48. [9] J.W. Thomason, W. Susetyo, L.A. Carreira, Appl. Spectrosc. 50 (1996) 401-408.
[10] L. Marang, P.E. Reiller, S. Eidner, M.U. Kumke, M.F. Benedetti, Environ. Sci. Technol. 42 (2008) 5094-5098.
[11] L. Marang, S. Eidner, M.U. Kumke, M.F. Benedetti, P.E. Reiller, Chem. Geol. 264 (2009) 154-161.
[12] T.H. Yoon, H. Moon, Y.J. Park, K.K. Park, Environ. Sci. Technol. 28 (1994) 2139-2146.
[13] H.S. Shin, S.W. Rhee, B.H. Lee, C.H. Moon, Org. Geochem. 24 (1996) 523-529.
[14] H.S. Shin, G.R. Choppin, Radiochim. Acta 86 (1999) 167-174.
[15] J.C. Dobbs, W. Susetyo, F.E. Knight, M.A. Castles, L.A. Carreira, L.V. Azarraga, Anal. Chem. 61 (1989) 486-488.
[16] G. Bidoglio, I. Grenthe, Q. P., P. Robouch, N. Omenetto, Talanta 38 (1991) 999-1008.
[17] C. Moulin, P. Decambox, P. Mauchien, V. Moulin, M. Theyssier, Radiochim. Acta 52/53 (1991) 119-125.
[18] A. Dierckx, A. Maes, J. Vancluysen, Radiochim. Acta 66/67 (1994) 149-156.
[19] K.R. Czerwinski, J.I. Kim, D.S. Rhee, G. Buckau, Radiochim. Acta 72 (1996) 179-187.
[20] C. Moulin, J. Wei, P. van Iseghem, I. Laszak, G. Plancque, V. Moulin, Anal. Chim. Acta 396 (1999) 253-261.
[21] J.I. Kim, D.S. Rhee, G. Buckau, A. Morgenstern, Radiochim. Acta 79 (1997) 173-181.
[22] M. Morgenstern, R. Klenze, J.I. Kim, Radiochim. Acta 88 (2000) 7-16.
[23] G. Plancque, V. Moulin, P. Toulhoat, C. Moulin, Anal. Chim. Acta 478 (2003) 11-22.
[24] K.H. Chung, W. Lee, Y. Cho, G. Choi, C. Lee, Talanta 65 (2005) 389-395.
[25] M.U. Kumke, S. Eidner, T. Kruger, Environ. Sci. Technol. 39 (2005) 9528-9533.
[26] T. Rabung, H. Geckeis, Radiochim. Acta 97 (2009) 265-271.
[27] W.D. Horrocks, D.R. Sudnick, J. Am. Chem. Soc. 101 (1979) 334-340.
[28] W.D. Horrocks, D.R. Sudnick, Accounts of Chemical Research 14 (1981) 384-392.
[29] N. Sabbatini, M. Guardigli, J.-M. Lehn,
Coordination Chemistry Reviews 123 (1993) 201-228. [30] J.M. Monsallier, W. Schussler, G. Buckau, T. Rabung, J.I. Kim, D. Jones, R. Keepax, N. Bryan, Anal. Chem. 75 (2003) 3168-3174.
[31] M. Fujiwara, S. Tsukahara, H. Watarai, Phys. Chem. Chem. Phys. 1 (1999) 2949-2951.
[32] S. Tsukahara, M. Fujiwara, H. Watarai, Chemistry Letters (2000) 412-413.
[33] M. Freyer, C. Walther, T. Stumpf, G. Buckau, T. Fanghänel, Radiochim. Acta 97 (2009) 547-558. [34] B. Alpha, R. Ballardini, V. Balzani, J.-M. Lehn, S. Perathoner, N. Sabbatini, Photochem. Photobiol. 52 (1990) 299-306.
[35] A. Bruccoleri, B.C. Pant, D.K. Sharma, C.H. Langford, Environ. Sci. Technol. 27 (1993) 889-894.
[36] R.G. Zepp, P.F. Schlotzhauer, R.M. Sink, Environ. Sci. Technol. 19 (1985) 74-81.
[37] M.T. Berry, P.S. May, H. Xu, J. Phys. Chem. 100 (1996) 9216-9222.
[38] T. Stumpf, G. Buckau, T. Fanghänel, Coordination of trivalent actinides by humic acids: A TRLFS study, in: G. Buckau (Ed.), Humic substances in performance assessment of nuclear waste disposal: actinide and iodine migration in the far-field. Third technical report, FZK-INE, Report FZKA 7070,
http://bibliothek.fzk.de/zb/berichte/FZKA7070.pdf, 2005, pp. 1-8.
[39] B.R. Judd, Phys. Rev. 127 (1962) 750-761. [40] G.S. Ofelt, Journal of Chemical Physics 37 (1962) 511-520.
[41] J. Brevet, F. Claret, P.E. Reiller, Spectrochimica Acta A 74 (2009) 446-453.
[42] C.J. Milne, D.G. Kinniburgh, E. Tipping, Environ. Sci. Technol. 35 (2001) 2049-2059.
[43] J.D. Ritchie, E.M. Perdue, Geochim. Cosmochim. Acta 67 (2003) 85-96.
[44] C.J. Milne, D.G. Kinniburgh, W.H. Van Riemsdijk, E. Tipping, Environ. Sci. Technol. 37 (2003) 958-971. [45] J.C.G. Bünzli, Luminescent probes, in: J.C.G. Bünzli and G.R. Choppin (Eds.), Lanthanides probe in life, chemical and earth sciences - Theory and practice, Elsevier, 1989, pp.
[46] J.M. Monsallier, F.J. Scherbaum, G. Buckau, J.I. Kim, M.U. Kumke, C.H. Specht, F.H. Frimmel, J. Photochem. Photobiol. A 138 (2001) 55-63.
[47] S.T. Frey, W.D. Horrocks, Inorg. Chim. Acta 229 (1995) 383-390.
[48] M. Albin, W.D. Horrocks, Inorg. Chem. 24 (1985) 895-900.
[49] G.R. Choppin, Z.M. Wang, Inorg. Chem. 36 (1997) 249-252.
[50] C.W. McNemar, W.D. Horrocks, Appl. Spectrosc. 43 (1989) 816-821.
[51] R. de Levie, Advanced Excel for Scientific Data Analysis, Oxford University Press, 2005.
[52] M. Albin, B.M. Cader, W.D. Horrocks, Inorg. Chem. 23 (1984) 3045-3050.
[53] N.J. Turro, Modern molecular photochemistry, University Science Books, Sausalito, CA, USA., 1991. [54] M.F. Yeh, T. Riedener, K.L. Bray, S.B. Clark, J. Alloys Comp. 303 (2000) 37-41.
[55] S.E. Burroughs, G. Eisenman, W.D. Horrocks, Biophys. Chem. 42 (1992) 249-256.
[56] R. Del Vecchio, N.V. Blough, Environ. Sci. Technol. 38 (2004) 3885-3891.
[57] V. Moulin, P. Reiller, B. Amekraz, C. Moulin, Rapid Commun. Mass Spectrom. 15 (2001) 2488-2496. [58] P. Reiller, B. Amekraz, C. Moulin, Environ. Sci. Technol. 40 (2006) 2235-2241.
[59] A. These, M. Winkler, C. Thomas, T. Reemtsma, Rapid Commun. Mass Spectrom. 18 (2004) 1777-1786. [60] M. Albin, A.C. Goldstone, A.S. Withers, W.D. Horrocks, Inorg. Chem. 22 (1983) 3182-3184. [61] I. Billard, K. Lutzenkirchen, Radiochim. Acta 91 (2003) 285-294.
[62] T. Stumpf, T. Fanghänel, I. Grenthe, J. Chem. Soc.-Dalton Trans. (2002) 3799-3804.