HAL Id: cea-00998688
https://hal-cea.archives-ouvertes.fr/cea-00998688
Submitted on 6 Jan 2021
HAL is a multi-disciplinary open access
archive for the deposit and dissemination of
sci-entific research documents, whether they are
pub-lished or not. The documents may come from
teaching and research institutions in France or
abroad, or from public or private research centers.
L’archive ouverte pluridisciplinaire HAL, est
destinée au dépôt et à la diffusion de documents
scientifiques de niveau recherche, publiés ou non,
émanant des établissements d’enseignement et de
recherche français ou étrangers, des laboratoires
publics ou privés.
A deep search for molecular gas in two massive Lyman
break galaxies at z=3 and 4: vanishing CO-emission due
to low metallicity?
Qinghua Tan, Emanuele Daddi, Mark T. Sargent, Georgios Magdis,
Jacqueline A. Hodge, Matthieu Bethermin, Frederic Bournaud, Chris L.
Carilli, Helmut Dannerbauer, Mark Dickinson, et al.
To cite this version:
Qinghua Tan, Emanuele Daddi, Mark T. Sargent, Georgios Magdis, Jacqueline A. Hodge, et al.. A
deep search for molecular gas in two massive Lyman break galaxies at z=3 and 4: vanishing
CO-emission due to low metallicity?. The Astrophysical journal letters, Bristol : IOP Publishing, 2013,
776 (2), pp.L24. �10.1088/2041-8205/776/2/L24�. �cea-00998688�
arXiv:1309.5448v1 [astro-ph.CO] 21 Sep 2013
A deep search for molecular gas in two massive Lyman break
galaxies at z=3 and 4: vanishing CO-emission due to low
metallicity?
Q. Tan
1,2,3, E. Daddi
2, M. Sargent
2, G. Magdis
4, J. Hodge
5, M. B´
ethermin
2, F. Bournaud
2,
C. Carilli
6, H. Dannerbauer
7, M. Dickinson
8, D. Elbaz
2, Y. Gao
1, G. Morrison
9,10, F.
Owen
6, M. Pannella
2, D. Riechers
11, and F. Walter
5qhtan@pmo.ac.cn
ABSTRACT
We present deep IRAM Plateau de Bure Interferometer (PdBI) observations, searching for CO-emission toward two massive, non-lensed Lyman break galaxies (LBGs) at z = 3.216 and 4.058. With one low significance CO detection (3.5σ) and one sensitive upper limit, we find that the CO lines are &3–4 times weaker than expected based on the relation between IR and CO luminosities followed by similarly, massive galaxies at z =0–2.5. This is consistent with a scenario in which these galaxies have low metallicity, causing an increased CO-to-H2conversion
factor, i.e., weaker CO-emission for a given molecular (H2) mass. The required metallicities at
z > 3 are lower than predicted by the fundamental metallicity relation (FMR) at these redshifts, consistent with independent evidence. Unless our galaxies are atypical in this respect, detecting molecular gas in normal galaxies at z > 3 may thus remain challenging even with ALMA.
Subject headings: galaxies: evolution — galaxies: high-redshift — galaxies: star formation
1Purple Mountain Observatory & Key Laboratory for
Radio Astronomy, Chinese Academy of Science, Nanjing 210008, China
2
CEA Saclay, DSM/Irfu/Service d’Astrophysique, Orme des Merisiers, 91191 Gif-sur-Yvette Cedex, France
3
Graduate University of the Chinese Academy of Sci-ences, 19A Yuquan Road, Shijingshan District, Beijing 100049, China
4Department of Physics, University of Oxford, Keble
Road, Oxford OX1 3RH, UK
5
Max-Planck Institute for Astronomy, K¨onigstuhl 17, 69117 Heidelberg, Germany
6National Radio Astronomy Observatory, P. O. Box O,
Socorro, NM 87801, USA
7Universit¨at Wien, Institut f¨ur Astronomie
T¨urkenschanzstrasse, 171160 Wien, Austria
8
National Optical Astronomical Observatory, 950 North Cherry Avenue, Tucson, AZ 85719, USA
9Institute for Astronomy, University of Hawaii,
Hon-olulu, HI, 96822, USA
10Canada-France-Hawaii Telescope, Kamuela, HI, 96743,
USA
11
Department of Astronomy, Cornell University, 220
1. Introduction
The study of cold gas, the fuel for star for-mation, in massive galaxies across cosmic time is crucial to understanding how galaxies have converted their gas into stars (e.g., review by Carilli & Walter 2013). Thanks to sensitivity improvements of millimeter interferometers, mea-surements of molecular gas have recently be-come feasible in normal1 galaxies at z ∼0.5–2.5
(Daddi et al. 2008, 2010; Tacconi et al. 2010, 2013; Geach et al. 2011), which lie on the star-forming main-sequence (MS). Galaxies following this relation between stellar mass and star forma-tion rate (SFR) contribute ∼90% to the cosmic SFR density at these redshifts (Daddi et al. 2007; Rodighiero et al. 2011; Sargent et al. 2012). It is found that these high-z star-forming galaxies are rich in molecular gas, with gas fractions
ris-Space Sciences Building, Ithaca, NY 14853, USA
1
ing from ∼5% locally to ∼50% at z ∼2 for ob-jects with M⋆∼1011M⊙, an evolution similar to
that of their specific star formation rates (sSFRs) (Magdis et al. 2012b; Tacconi et al. 2013).
However, little is known about the gas con-tent of normal galaxies at z &3. Although CO detections have been reported in lensed Lyman break galaxies (LBGs) at &3 (Riechers et al. 2010; Livermore et al. 2012), these lenses have very low stellar masses (M⋆ .109M⊙) and high
sSFR, and thus might not be directly comparable to more massive main-sequence galaxies at those epochs. The dependence of the CO-to-H2
conver-sion factor on metallicity (e.g., Bolatto et al 2013; Carilli & Walter 2013, and references therein) may imply that CO-emission becomes weak in typ-ical massive galaxies with low metal-enrichment at z &3 (Tacconi et al. 2008; Genzel et al. 2012; Narayanan et al. 2012).
In this Letter we present new, deeper CO ob-servations of the z ∼ 3 LBG M23 (for which Magdis et al. 2012a reported a ∼ 4σ CO sig-nal), as well as of the UV-selected LBG BD29079 at z ∼ 4 (Daddi et al. 2009). These two mas-sive LBGs lie in the GOODS-North field. With the available optical and infrared data, we investi-gate their molecular gas properties and place con-straints on the evolution of the molecular gas frac-tion, in the context of our current understanding of the metallicity-evolution of galaxies at those epochs. We assume H0 = 71 km s−1 Mpc−1,
ΩM= 0.3, ΩΛ= 0.7.
2. Observations
We used the IRAM/PdBI to observe CO(4-3) emission from BD29079 and CO(3-2) from M23 (Table 1). BD29079 is in the vicinity of GN20 (separation of ∼ 16′′; Pope et al. 2005) and at
the same redshift (Daddi et al. 2009). BD29079 was observed in three configurations. The point-ing center of the AB-configuration observations lay 30′′ north of BD29079 (Daddi et al. 2009),
while the new D- and C-configuration observa-tions were centered on BD29079 and carried out under good 3mm weather conditions in June 2009 and January-April 2013. In total, the six antenna-equivalent on-source time for BD29079 is 13.8hr. For M23, new C-configuration observations were made in April 2013. The combination of C- and
D-configuration (Magdis et al. 2012a) observations give a total on-source time of 7.3hr. For observa-tions made before and after 2011, correlator band-widths are 1 GHz and 3.6 GHz (WideX), respec-tively. All observations were performed in dual polarization mode.
We reduced the data with the GILDAS soft-ware packages CLIC and MAPPING. After cor-recting for primary beam attenuation (PBA), the rms noise in a 26 km s−1channel and at an angular
resolution of ∼ 3.0′′ and ∼ 4.5′′ for BD29079 and
M23 are 0.38 and 0.72 mJy/beam, respectively. For BD29079, we also make use of CO(6-5) and CO(2-1) data from deep PdBI and JVLA ob-servations of the GN20 field originally presented in Carilli et al. (2010) and Hodge et al. (2012, 2013). To avoid over-resolving of the source, the CO(2-1) data cube was tapered to a spatial res-olution of 1.4′′ and binned to 26 km s−1
spec-tral resolution, with a corresponding noise of 0.21 mJy/beam. The sensitivity reached in the CO(6-5) data cube (0.9′′×26 km s−1) is 0.58 mJy/beam.
3. Results 3.1. BD29079
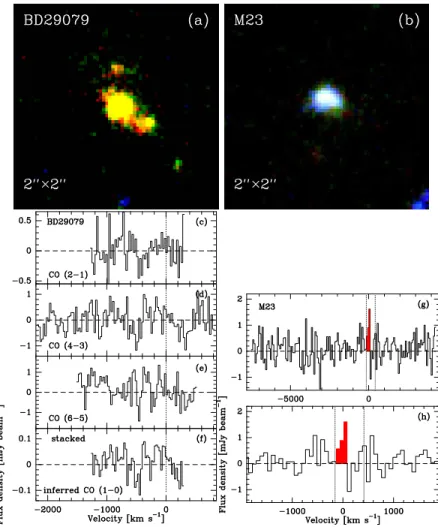
BD29079 is an UV-selected B-dropout galaxy (Figure 1) with spectroscopic redshift z = 4.058 (Daddi et al. 2009). CO measurements toward this galaxy were previously reported as upper lim-its (Carilli et al. 2011; Hodge et al. 2013). Com-bining our new, deep CO(4-3) data with those already published, we searched for CO-emission to deeper levels. Figure 1 shows CO spectra binned to 26 km s−1 at the expected frequency
of CO J=2-1, 4-3, and 6-5. No line emission from the individual CO transitions was detected.
In order to maximize sensitivity, we performed a combined stack of the spectra covering all three CO transitions. The amplitude of all spectra is rescaled to the level appropriate for a template spectral line energy distribution (SLED). We con-sider scaling factors based on observed CO SLEDs of both sBzK galaxies and SMGs (Aravena et al. 2010; Carilli et al. 2010; Daddi et al. 2013, in preparation). In the line stack each spectrum is weighted by the inverse square of the rescaled noise. Both CO-excitation models produce no de-tection of the stacked line emission and lead to a comparable flux limit. We adopt an upper 3σ
Table 1
Summary of PdBI Observations
Source R.A. Decl. Conf. Obs. Dates PBA Tinta Frequency Combined Beam rmsb Reference
(J2000) (J2000) (hr) (GHz) (µJy)
BD29079 12:37:11.52 62:21:55.6 AB 2008 Jan-Feb 2.4 2.2 91.375 2′′.98 × 2′′.27 P.A.=70◦ 29 Daddi et al. (2009)
D 2009 Jun 1.0 7.4 91.375 This work
C 2013 Jan-Apr 1.0 4.2 91.375 This work
M23 12:37:02.70 62:14:26.3 D 2011 May 1.0 2.5 82.059 4′′
.45 × 3′′
.82 P.A.=56◦
40 Magdis et al. (2012a)
C 2013 Apr 1.0 4.7 82.059 This work
aSix antenna-equivalent effective on-source integration time, corrected for PBA. bNoise per beam, averaged over full bandwidth.
CO(1-0) luminosity limit of < 8.2 × 10⁹K km s−1
pc2, derived from the flux limit of 4.1 mJy km s−1
(1σ, assuming a line width of 300 km s−1,
con-sistent with the typical line widths measured in similarly massive high-redshift star-forming galax-ies; see Daddi et al. 2010; Tacconi et al. 2010) obtained for the sBzK-excitation model2.
Us-ing SMG-like CO SLEDs or those of z & 3 lenses (Riechers et al. 2010; Coppin et al. 2007; Baker et al. 2004) would imply even deeper up-per limits.
3.2. M23
Magdis et al. (2012a) reported CO(3-2) line emission with S/N=4 toward M23. We achieved no significant line-detection in the new obser-vations, such that, in the combined dataset (threefold integration time increase relative to Magdis et al. 2012a), the overall significance de-creases to ∼ 3.5σ (Figure 1), suggesting that the flux density reported in Magdis et al. (2012a) was boosted by noise. Based on the deeper data, we still consider the line feature in M23 as tentative and revise our estimate of its CO(3-2) luminosity to (9.5 ± 2.7) × 109 K km s−1 pc2, though this
may still represent an upper limit. Assuming a correction factor of r31= 0.5 (measured in high-z
normal galaxies; e.g., Dannerbauer et al. 2009; Tacconi et al. 2010), the CO(1-0) luminosity can be determined from CO(3-2) and is listed in Ta-ble 2.
2
We adopt line temperature ratios of r61=0.10, r41=0.21,
and r21=0.70 (Aravena et al. 2010; Daddi et al. 2013, in
preparation).
4. Analysis and Discussion 4.1. Physical properties
For M23, Magdis et al. (2012a) estimate SFR = (310±110) M⊙yr−1, based on radio and 250µm
detections. After accounting for flux from a nearby (likely unrelated, compact, red) compan-ion source, we revise the stellar mass estimate for M23 to M⋆ = (1.0 ± 0.5) × 1011 M⊙, implying a
sSFR∼ 3.1 Gyr−1. This value is close to the
aver-age sSFR of equally massive galaxies on the SFR-M⋆main-sequence at z ∼3 (sSFR/sSFRMS ∼1.4),
suggesting that M23 is a normal galaxy rather than a starburst, notwithstanding its high SFR.
BD29079 has a stellar mass of M⋆ = (2.5 ±
0.5) × 1010 M
⊙, as determined by SED-fitting of
the rest-frame UV−to−near-IR broad-band pho-tometry using Bruzual & Charlot (2003) mod-els and assuming a constant star formation his-tory (SFH), a Chabrier (2003) IMF, and a Calzetti et al. (2000) extinction law. We infer an extinction-corrected 1500˚A rest-frame luminosity corresponding to SFR of 170 ± 40M⊙yr−1(see
Ta-ble 2). Complementary, independent constraints on the LIR of BD29079 follow from its JVLA and
Herschel coverage. We detect a 14µJy-signal (4σ) in the 1.4 GHz JVLA map of Owen et al. (2013, in preparation), only slightly offset from the nom-inal HST position of the source. When combin-ing this constraint with the multi-band Herschel non-detections with PACS and SPIRE, with a measurement of 0.2 ± 0.1mJy for the 2.2mm con-tinuum and an upper limit at 3.3mm in our PdBI data, we derive a combined estimate of LIR =
(2.7 ± 0.6) × 1012 L
⊙, consistent within
Fig. 1.—Top: HST+ACS color image of BD29079 (a) and M23 (b) (F435W-blue, F775W-green, and F850LP-red). The yellow color of BD29079 reflects its selection as a B-dropout. Bottom: CO spectra for BD29070 and M23. For BD29079, the frequency coverage of CO J=2-1(c), 4-3(d), 6-5(e), and of the stacked spectrum (f) is shown. (Spectral binning: 26 km s−1; zero velocity corresponds
to z=4.058). The stacked spectrum is produced by assuming a sBzK CO excitation model. For M23, we show the CO(3-2) spectrum with 75 km s−1spectral resolution over the full velocity range observed (h) and a zoom-in on the tentative line position (g). Red color
indicates where the maximum S/N ratio is found within the velocity range given by redshift uncertainties (1σ; dotted lines) in the optical spectroscopy (see Magdis et al. 2012a)
Table 2
Observed and Derived Properties
Source zKeck L′CO Mgasa αCOb SFE M⋆
c L IR sSFR (1010K km s−1pc2) (1010M ⊙) (M⊙(K km s−1pc2)−1) (L⊙(K km s−1pc−2)−1) (1010M⊙) (1012L⊙) (Gyr−1) BD29079 4.058 < 0.82d ∼16 >19 >330 2.5 ± 0.5 2.7 ± 0.6 10.8 M23 3.216 1.90±0.54 ∼18 &9.3 & 160 10 ± 5 3.1 ± 1.1 3.1
aFrom the integrated Schmidt-Kennicutt relation, M
gasvs. SFR (see text). bα
CO=Mgas/L′CO
cStellar mass from SED fitting, assuming a Chabrier IMF d3σ upper limit on CO(1-0) assuming FWHM=300 km s−1.
estimate. This corresponds formally to a sSFR-excess of ≈2–3 for BD29079, with respect to the characteristic value of an average main-sequence galaxy with identical mass and redshift, implying in principle a non-negligible starburst-probability for this source (e.g., Sargent et al. 2013a, hence-forth S13a). While we cannot rule out the pres-ence of a merger-induced starburst event, the fact that this galaxy was initially UV-selected, and the reasonable agreement between UV- and radio/FIR-derived SFR constraints (similar to the correspondence found for normal, massive star-forming galaxies at z∼2; see Daddi et al. 2007) disfavor this possibility.
4.2. CO luminosity
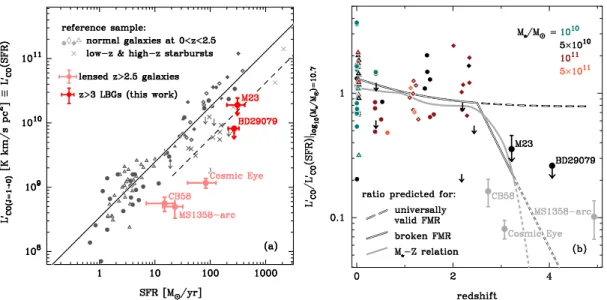
The ratio between the observables LIRand L′CO
can be used as an indication of star formation efficiency (SFE). We find values of & 160 and > 330L⊙(K km s−1pc2)−1for M23 and BD29079,
respectively. These are & 3–4 times higher than the typical values defined by normal galaxies (Fig-ure 2a), which display a dispersion of 0.21 dex (S13a), implying that both are 2–3σ outliers. We therefore find substantially weaker CO-emission in our two LBGs, compared to expectations based on their IR luminosities and SFRs.
We emphasize that, in term of their position in the LIR−L′CO plane (cf. Fig. 2a), our sources
and the lensed literature LBGs cB58 (z = 2.72), the Cosmic Eye (z = 3.07, Riechers et al. 2010), and the MS1358-arc (z = 4.93, Livermore et al. 2012) behave similarly. We caution though that the latter three are quite different sources due to their stellar masses which are ∼2 orders of magni-tude smaller than for customarily studied galaxies at z < 4. Lensed LBGs have also much higher sSFR values (∼25-60 Gyr−1). Even accounting
for a possibly sublinear slope of the MS at z = 3– 4, they still display excesses of 4.2–6.0 above the MS, which would classify them as starbursting ob-jects (Rodighiero et al. 2011). Nevertheless their CO-to-LIR ratios are still factors of 2–3 smaller,
even than those of the most powerful local star-bursting ULIRGs (Fig.2a, dashed line). Even if the properties of these lenses are harder to inter-pret, they hence appear to support evidence for weak CO emission compared to lower-z sources.
4.3. Metallicity driven CO suppression Figure 2b re-displays the same galaxies of Fig.2a, showing their CO luminosity normalized by the average L′
CO(SFR) trend of Fig.2a, and
plotted as a function of redshift. Massive z > 3 galaxies might depart from the trend of lower-z galaxies either because they have enhanced SFR to gas mass ratios (i.e. high SFEs, implying de-parture from the integrated Schmidt-Kennicutt law – S-K; SFR∝M1.2
gas), or due to high CO-to-H2
conversion factors αCO caused by low
metallici-ties. While we cannot solve the degeneracy with the available evidence, we focus on the latter effect here based on recent developments in the deter-mination of metallicity of z > 3 galaxies (e.g., Maiolino et al. 2008; Sommariva et al. 2012).
To quantitatively explore the metallicity-driven suppression of CO-emission, we calculate simple models for the CO emission of galaxies based on their physical properties. We assume that nor-mal galaxies at both z ≤ 2.5 and z > 3 follow the same S-K law and have metallicity-dependent conversion factors. To a given M⋆ and redshift,
we associate SFR- and Mgas-values appropriate
for an average main-sequence galaxy lying on the S-K law. From the M⋆ (and SFR) we can infer
the expected metallicity and thence αCOand our
predicted L′
CO(using one of three approaches
dis-cussed below), which we normalize by the aver-age L′
CO(SFR) trend for MS galaxies from Fig.2a
as for observed galaxies to display predictions in Fig.2b. A rapid decrease of metallicity, as cur-rently suggested by high-redshift measurements, would produce outliers with weak CO-emission.
We use both the mass-metallicity (M⋆ −Z)
relation and the fundamental metallicity re-lation (FMR) relating metallicity to M⋆ and
SFR to statistically assign gas-phase metallic-ities (Erb et al. 2006; Sommariva et al. 2012; Zahid et al. 2013; Mannucci et al. 2010). The metallicity-dependent αCO is assumed to scale as
∼ Z−1 (review by Bolatto et al. 2013; Sargent et al. 2013, in preparation, the latter study being based on the shape of the z=0 CO luminosity func-tion (Keres et al. 2003)). Fig.2b shows how these simple predictions accurately describe the location of galaxies at 0 < z < 2.5. The smoothly varying metallicity for most galaxies over 0 < z < 2.5 causes limited variations of αCO, which results
Fig. 2.—Left: Location of non-lensed LBGs (bright-red dots) and lensed LBGs (pale-red dots) in SFR-L′
COspace. Filled/open grey
symbols show measurements for normal galaxies and grey crosses represent starbursts at low- and high-redshift. See Sargent et al. (2013a) for references to the literature data shown (different symbol shapes correspond to different samples). Solid and dashed lines– best-fitting relation derived for main-sequence galaxies and average offset of strong starbursts, respectively. Right: Redshift-evolution of the CO luminosity of galaxies, normalized by the average L′
CO(SFR) trend for MS galaxies in panel (a). Predictions are shown for the
case of an universally valid FMR/broken FMR/evolving M⋆−Z relation at z ≥3 (dashed/solid/grey lines; the z > 3.5 extrapolations
are observationally-unconstrained). All measurements for normal galaxies (colored points) and predictions have been normalized to a common mass scale of M⋆ = 5 × 10
10M
⊙based on the expected mass dependence of L′CO/L ′
CO(SFR) ∝ M⋆0.3. Data points are
colored depending on which reference color was closest in stellar mass. No mass-dependent scaling was applied to the lensed, possibly starburst-like z > 3 sources.
in a tight L′
CO–SFR relation, and thus only weak
scatter in both Fig.2 panels. However, the system-atic decrease of αCOwith increasing M⋆ produces
small mass-dependent drifts that we correct in both data and models (see caption of Fig.2).
Figure 2b shows tracks for the case of an FMR that remains constant at all redshift, for an FMR that breaks at z=2.5, and for a M⋆−Z relation
with accelerated evolution at z > 2.5. Evidence for metallicity evolution at z > 2.5 comes from Mannucci et al. (2010) and Sommariva et al. (2012). For the scenario with a broken FMR, we interpolate linearly with redshift the metallic-ity drop of 0.6 dex reported in Mannucci et al. (2010) between z=2.5 and z=3.3 and continue this trend beyond z=3.3 to estimate high-z evo-lution (but see Hunt et al. 2012 for a non-evolutionary interpretation of the low-metallicity readings at high-redshifts). For the case of an evolving M⋆ −Z relation, a similar linear
interpolation/extrapolation is applied between z=2.2 and z=3 based on the M⋆ −Z relations
of Sommariva et al. (2012) and Zahid et al. (2013). A distinct difference among these
predic-tions is the rapid decrease of the L′
CO/L′CO(SFR)
ratio at high-z in the case of fast metallicity evo-lution at z>2.5. For the case of an universally valid FMR, the evolution of L′
CO/L′CO(SFR) is
not overly strong and almost vanishes at fixed M⋆. The scatter of the reference z < 2.5
sam-ple around the average predicted trend is 0.24 dex. M23 starts to deviate from the constant FMR track, agreeing better with the prediction assuming a rapid decline in metallicity at z ∼ 3. BD29079 displays an offset of > 2σ relative to the scenario of an universally-valid FMR.
4.4. The CO to H2 conversion factor in a
regime of evolving metallicity
Metallicity evolution with redshift would af-fect, as discussed, the CO-to-H2conversion factor,
making it challenging to infer the H2-content from
CO-measurements. The two massive LBGs stud-ied here exemplify this: under the aforementioned, different plausible scenarios, αCOcould range over
4–12 M⊙ (K km s−1pc2)−1 for M23 and 7–63 for
BD29079. Inferring αCO at z & 3 is even much
average estimate of molecular gas mass could ar-guably be derived from the SFR itself, via the inte-grated S-K relation rather than from CO-emission (though we caution that no guarantee exists that the S-K still holds unchanged at z > 3). Adopt-ing the well-established relation between Mgasand
SFR for normal galaxies as in S13a, we infer molecular gas masses Mgas ∼ 1.6 × 10¹¹M⊙ and
Mgas∼1.8 × 10¹¹M⊙ for BD29079 and M23,
re-spectively. With Mgas=αCOL′CO, the
correspond-ing αCOwould be >19 and &9.3 for BD29079 and
M23.
4.5. The evolution of molecular gas frac-tion
Recent studies reported a trend for increas-ing molecular gas fractions (fgas= Mgas/[Mgas+
M⋆]) with redshift up to z∼2.5 (Daddi et al.
2010; Geach et al. 2011; Magdis et al. 2012a; Tacconi et al. 2013; Saintonge et al. 2013), in good agreement with the redshift evolution of sSFR (Magdis et al. 2012b), suggesting that the peak epoch of cosmic star formation (z∼2) corre-sponds to an epoch when typical massive galax-ies were dominated by molecular gas. Some works have highlighted the impact of the as-sumed SFH and of nebular emission on SED-fitting and consequently on the measured sSFR-evolution beyond z∼2 (de Barros et al. 2013; Gonz´alez et al. 2013), in light of the disagreement between the observed sSFR plateau and current theoretical predictions (Neistein & Dekel 2008; Weinmann et al. 2011). Given the tight correla-tion between SFR and molecular gas content, the study of gas fractions in galaxies at z>3 might be useful to investigate the putative sSFR-plateau at z∼2–8.
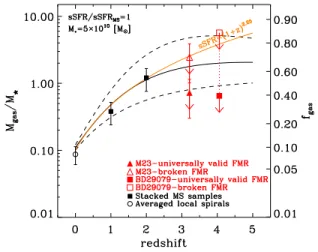
Figure 3 shows the evolution of Mgas/M⋆ for
normal galaxies with sSFR/sSFRMS=1 and M⋆=
5 × 10¹⁰M
⊙ out to z∼4. Gas fractions of galaxies
with M⋆6= 5 × 10¹⁰M⊙ were rescaled based on the
observed trends Mgas/M⋆ ∝ (sSFR/sSFRMS)0.9
and Mgas/M⋆ ∝ M⋆−0.5 (Magdis et al. 2012b).
For the case of an universally valid FMR, we infer Mgas/M⋆ of . 0.72 and <0.65 for M23
and BD29079, which in both cases is lower than expected based on the observed sSFR-evolution, i.e., an increase with (1+z)2.8 to z∼2.5, followed
by a plateau or a slow rise at even higher red-shifts. Larger gas fractions are obviously
recov-Fig. 3.— Redshift-evolution of Mgas/M⋆ and the
molecu-lar gas fraction of normal galaxies with sSFR/sSFRMS=1 and
M⋆= 5 × 10¹⁰M⊙. We compare the LBGs of this study to the
z = 0 sample of Leroy et al. (2008), and stacked samples of z ∼ 1 and z ∼ 2 normal galaxies from Magdis et al. (2012b). Gas fraction estimates for M23 and BD29079 derived assum-ing an universally valid (broken) FMR at z ≥ 3 are marked with solid (open) red symbols. Black-solid line – evolution of Mgas/M⋆ at M⋆ = 5 × 10¹⁰M⊙, predicted based on the
ob-served sSFR-evolution (S13a; dashed line – ±1σ uncertainties). The orange line traces the evolution predicted by the model of Dav´e et al. (2012).
ered if, as in the previous sections, we allow for rapidly declining metallicities. If we assume strong metallicity-evolution at z > 2.5, the gas fractions of M23 and BD29079 appear to agree with the measured sSFR-evolution, and also with some the-oretical predictions, e.g. for the case of a con-tinuously increasing sSFR∝(1+z)2.25, as expected
for accretion of pristine gas from the intergalac-tic medium (Dav´e et al. 2012). Given the low significance of our CO-detections and the large systematic uncertainties, our results can only de-limit a range for the evolution of gas fractions at z ∼ 3–4. Additional, direct metallicity estimates for high redshift galaxies would be highly benefi-cial for further exploration of the evolution of gas fractions. A larger sample of normal galaxies with CO-detections at z > 3 is also clearly needed to reach firm conclusions.
5. Conclusions
We presented evidence that the CO-emission from two z &3 massive LBG galaxies is weaker than expected based on the tight correlation be-tween IR and CO luminosities satisfied by simi-lar z ≤ 2.5 objects. A plausible explanation is
that z > 3 normal galaxies are weak in CO due to rapid metallicity-evolution at high redshift. As a result, the evolution of molecular gas fractions be-yond z ∼ 3 is fairly uncertain due to the large un-certainties on metallicity-estimates and the shape of the relation between CO-to-H2 conversion
fac-tor and metallicity. Also, the exact normalization and dispersion of the main-sequence is not well constrained at these redshifts, and their attenua-tion properties might have evolved, thus making it even harder to distinguish normal disk-like galax-ies from merger-powered sources. Our observa-tions (similarly to results of Ouchi et al. 2013) in any case start to point to the difficulty of detecting gas cooling emission lines from normal galaxies at z > 3. This might remain challenging even with the unprecedented sensitivity of ALMA if metal-licities indeed decrease rapidly for typical massive galaxies at these high redshifts.
This work was based on observations car-ried out with the IRAM PdBI, supported by INSU/CNRS (France), MPG (Germany), and IGN (Spain). We thank C. Feruglio and M. Krips for help during observations/data reduction, and the anonymous referee for valuable comments. QT, ED, MTS and MB acknowledge funding from ERC-StG grant UPGAL 240039 and ANR-08-JCJC-0008.
REFERENCES
Aravena, M., Carilli, C., Daddi, E., et al. 2010, ApJ, 718, 177
Baker, A. J., Tacconi, L. J., Genzel, R., et al. 2004, ApJ, 604, 125
Bolatto, A. D., Wolfire, M., Leroy, A. K. 2013, ARA&A, 51, 207
Bruzual, G., & Charlot, S. 2003, MNRAS, 344, 1000 Calzetti, D., Armus, L., Bohlin, R. C., et al. 2000, ApJ,
533, 682
Carilli, C. L., Daddi, E., Riechers, D., et al. 2010, ApJ, 714, 1407
Carilli, C. L., Hodge, J., Walter, F., et al. 2011, ApJ, 739, L33
Carilli, C. L., & Walter, F. 2013, ARA&A, 51, 105 Chabrier, G. 2003, PASP, 115, 763
Coppin, K. E. K., Swinbak, A. M., Neri, R., et al. 2007, ApJ, 665, 936
Daddi, E., Dickinson, M., Morrison, G., et al. 2007, ApJ, 670, 156
Daddi, E., et al. Dannerbauer, H., Elbaz, D., 2008, ApJ, 673, 21
Daddi, E., Dannerbauer, H., Stern, D., et al. 2009, ApJ, 694, 1517
Daddi, E., Bournaud, F., Walter, F., et al. 2010, ApJ, 713, 686
Dannerbauer, H., Daddi, E., Riechers, D. A., et al. 2009, ApJ, 698, 178
Dav´e, R., Finlator, K., Oppenheimer, B. D. 2012, MNRAS, 421, 98
de Barros, S., et al. 2013, arXiv: 1207, 3663
Erb, D. K., Shapley, A. E., Pettini, M., et al. 2006, ApJ, 644, 813
Geach, J. E., Smail, I., Moran, S. M., et al. 2011, ApJ, 730, 19
Genzel, R., Tacconi, L. J., Combes, F., et al. 2012, ApJ, 746, 69
Gonz´alez, V., et al. 2013, arXiv: 1208.4362
Hodge, J. A., Carilli, C. L., Walter, F., et al. 2012, ApJ, 760, 11
Hodge, J. A., et al. 2013, arXiv: 1307.4763
Hunt L., Magrini, L., Galli, D., et al., 2012, MNRAS, 427, 906
Keres, D., Yun, M. S., Young, J. S. 2003, ApJ, 582, 659 Leroy, A. K., Walter, F., Brinks, E., et al. 2008, AJ, 136,
2782
Livermore, R. C., Swinbank, A. M., Smail, I., et al. 2012, ApJ, 758, L35
Magdis, G. E., Daddi, E., Sargent, M., et al. 2012a, ApJ, 758, L9
Magdis, G. E., Daddi, E., B´ethermin, M., et al. 2012b, ApJ, 760, 6
Maiolino, R., Nagao, T., Grazian, A., et al. 2008, A&A, 488, 463
Mannucci, F., Cresci, G., Maiolino, R., et al. 2010, MN-RAS, 408, 2115
Narayanan, D., Krumholz, M. R., Ostriker, E. C., et al. 2012, MNRAS, 421, 3127
Neistein, E., & Dekel, A. 2008, MNRAS, 383, 615 Ouchi, M., Ellis, R., ONO, Y., et al. 2013, arXiv: 1306.3572 Pope, A., Borys, C., Scott, D., et al. 2005, MNRAS, 358,
149
Riechers, D. A., Carilli, C. L., Walter, F., et al. 2010, ApJ, 724, L153
Rodighiero, G., Daddi, E., Baronchelli, I., et al. 2011, ApJ, 739, 40
Saintonge, A., Lutz, D., Genzel, R., et al. 2013, arXiv: 1309.3281
Sargent, M. T., B´ethermin, M., Daddi, E., et al. 2012, ApJ, 747, L31
Sargent, M. T., Daddi, E., B´ethermin, M., et al. 2013, arXiv: 1303.4392 (S13a)
Sommariva, V., Mannucci, F., Cresci, G., et al. 2012, A&A, 539, 136
Tacconi, L. J., Genzel, R., Smail, I., et al. 2008, ApJ, 680, 246
Tacconi, L. J., Genzel, R., Neri, R., et al. 2010, Nature, 463, 781
Tacconi, L. J., Neri, R., Genzel, R., et al. 2013, ApJ, 768, 74
Weinmann, S. M., Neistein, E., Dekel, A., et al. 2011, MN-RAS, 417, 2737
Zahid, H. J., Geller, M., Kewley, L., et al. 2013, ApJ, 771, 19
This 2-column preprint was prepared with the AAS LATEX