HAL Id: hal-00317846
https://hal.archives-ouvertes.fr/hal-00317846
Submitted on 15 Sep 2005
HAL is a multi-disciplinary open access
archive for the deposit and dissemination of
sci-entific research documents, whether they are
pub-lished or not. The documents may come from
teaching and research institutions in France or
abroad, or from public or private research centers.
L’archive ouverte pluridisciplinaire HAL, est
destinée au dépôt et à la diffusion de documents
scientifiques de niveau recherche, publiés ou non,
émanant des établissements d’enseignement et de
recherche français ou étrangers, des laboratoires
publics ou privés.
Further signatures of long-term changes in atmospheric
electrical parameters observed in Europe
F. Märcz, R. G. Harrison
To cite this version:
F. Märcz, R. G. Harrison. Further signatures of long-term changes in atmospheric electrical parameters
observed in Europe. Annales Geophysicae, European Geosciences Union, 2005, 23 (6), pp.1987-1995.
�hal-00317846�
SRef-ID: 1432-0576/ag/2005-23-1987 © European Geosciences Union 2005
Annales
Geophysicae
Further signatures of long-term changes in atmospheric electrical
parameters observed in Europe
F. M¨arcz1and R. G. Harrison2
1Geodetic and Geophysical Research Institute of the Hungarian Academy of Sciences, H-9401 Sopron, POB 5, Hungary 2Department of Meteorology, The University of Reading, P.O. Box 243, Earley Gate, Reading, Berks RG6 6BB, UK
Received: 25 January 2005 – Revised: 4 May 2005 – Accepted: 23 May 2005 – Published: 15 September 2005
Abstract. Long-term decreases found recently in both the
atmospheric electrical potential gradient (PG) and the air-Earth current density (Jz), using observation series from the
UK and Hungary, have motivated studies of other European data. Two surface data series somewhat longer than a decade were available: PG data obtained at Serra do Pilar (Portu-gal), and PG, Jzand positive air conductivity measurements
at Athens (Greece). Selecting data to minimise local effects, the 1960–1971 Serra do Pilar PG values decrease at dawn and in the evening. Dawn data obtained at Athens (1967– 1977) indicate a reduction in Jz, while the simultaneous PG
values there increase (coincident air conductivity values de-crease) for the periods investigated. The Athens PG increase is attributed to local aerosol influences, typical of urban envi-ronments. Despite the urban influence, the Athens Jzshows
similarities with soundings of the ionospheric potential. The decline in Jzat Athens occurs simultaneously with a decrease
reported previously in Jz at Kew (UK), indicating that, at
least, a regional decrease in the global atmospheric electrical circuit occurred during part of the twentieth century. Simi-lar surface changes occur in European atmospheric electrical parameters, with a decrease of about 0.5% to 0.7% per year between 1920 and 1970 (possibly extending back to 1898), an annual decrease of between 2.7 and 3.4%, between 1959 and 1971 and a continued decrease of about ∼1% per year between 1967 and 1984, possibly still continuing.
Keywords. Meteorology and atmospheric dynamics
(Atmo-spheric electricity) – Geomagnetism and paleomagnetism (Time variations, secular and long term) – Atmospheric com-position and structure (Aerosols and particles)
1 Introduction
Few sets of continuous measurements of atmospheric elec-trical parameters (such as the potential gradient, PG, verti-cal air-Earth current density, Jzor ionospheric potential, VI) Correspondence to: R. G. Harrison
exist for long periods at the same observation site. However some relatively long data series have been acquired at a small number of land stations, some of which have been published. The PG measured at the surface depends on global and lo-cal effects in a complicated fashion: although the air-earth current density arises from the global atmospheric electri-cal circuit, the surface PG also depends strongly on the loelectri-cal air conductivity, which is modulated by atmospheric aerosol (e.g. Harrison and Carslaw, 2003). Consequently, the use of long PG series for detection of long-term global circuit changes is difficult, as the atmospheric electrical parameters observed at land stations are often strongly influenced by lo-cal effects, such as variability in aerosol concentrations.
One investigation of changes in long-term surface surements was described by Isra¨el (1973) using PG data mea-sured at Davos, Switzerland. It was found that the diurnal variation characteristics of the PG there changed between two periods of measurements (1909 to 1910 and 1913 to 1923/1926), corresponding to a reduction in the mean PG of about 18% from 1909–1926. Isra¨el originally suggested that the PG reduction was probably a local effect, and, as air conductivity is inversely proportional to aerosol number concentration, that the PG reduction could be attributed to a reduction of the mean aerosol content in the Davos val-ley. This was supported by the change in the diurnal cy-cle from that more typical of polluted air (a double diur-nal cycle) to less polluted air (a single diurdiur-nal cycle). In polluted air elsewhere, substantial long term PG reductions in the first half of the twentieth century were probably un-usual. This is because environmental particulate pollution was then strongly influenced by coal combustion and the associated smoke production: coal burning would have lo-cally increased the PG. Based on the PG’s response to smoke, Harrison and Aplin (2002) have shown that the PG can pro-vide a sensitive method of reconstructing past urban aerosol changes.
Unusually long data series of PG are available from mea-surements made in the UK at two sites: Eskdalemuir, Scot-land (55◦190N, 30◦120W) and Lerwick, Shetland (60◦80N, 1◦110W). Using these data, Harrison (2002) detected a
1988 F. M¨arcz and R. G. Harrison: Long-term European atmospheric electrical changes long-term decrease in PG for both sites, appearing most
strongly in annual averages from Eskdalemuir during the pe-riod 1920-1950, probably continuing until 1981 although the data classification system was changed in the 1960s (Har-rison, 2004a). Harrison (2002) suggested that such a PG decline was consistent with the twentieth century decrease in galactic cosmic rays (GCR) (Carslaw et al., 2002) caus-ing a reduction in the ionospheric potential (VI)and local
increase in the columnar resistance. Together these deter-mine the air-Earth current density, to which the PG is pro-portional. Since VI may be regarded, to a first
approxima-tion, as a global equipotential, a possible intepretation of the PG change shown by Harrison (2002) is that it results from a global geophysical change in atmospheric electricity. Meteo-rological consequences of air-Earth current density changes, which would result from variations in the ionospheric poten-tial, have been suggested through the modulation of aerosol charge on the edges of cloud layers (Tinsley 2000, Carslaw et al., 2002).
An alternative hypothesis to explain the atmospheric elec-trical change is a local change in aerosol (Williams 2003), but the direct evidence for this occurring at Eskdalemuir is limited (Harrison 2003). A global increase in aerosol from the late 1950s to the present has, however, been suggested independently from the steady reduction, apparently global, in surface solar radiation measurements (Stanhill and Cohen, 2001): such a global aerosol increase could have contributed to the atmospheric electrical changes, through increasing the columnar resistance.
Investigating whether the atmospheric electrical changes are local, regional or global requires common changes to be found at other surface stations, as, although local factors can mask global changes, the local effects will be different at sta-tions which are well-separated geographically.
Atmospheric electricity measurements have been carried out at the Geophysical Observatory in Nagycenk, Hungary (47◦380N, 16◦430E) for more than four decades. The data obtained have been used for analysing PG changes on different time scales (e.g. M¨arcz and Bencze, 1981). One study using the Nagycenk data indicated a contin-uous decline in the PG (M¨arcz et al., 1997). A recent study (M¨arcz and Harrison, 2003) compared the long-term changes appearing both in PG data of Nagycenk and in the UK data. Although the measurements carried out at Nagycenk and Eskdalemuir covered quite different periods, there was a common overlapping period. It was found that the Nagycenk PG showed a distinct reduction from 1962 to 2001, in common with the Eskdalemuir PG decline (from 1920 to 1981), and that site changes at Nagycenk could only account for a minority of the change there. In addition, direct measurements of the vertical air-Earth current density obtained using the Wilson apparatus at Kew Observatory, near London (51◦280N, 0◦190W) were analysed. A relative change of –1.4%/year was found in the air-Earth current density from 1966 to 1978, comparable with the change in PG measured at Nagycenk (–1.3%/year) at the same time.
A different analysis was perfomed using hourly PG data obtained by R. Reiter in the Bavarian Alps on Mount Wank (47◦300N, 11◦090E), between August 1972 and
Decem-ber 1983 (Harrison, 2004b). Aerosol pollution is gener-ally lower in the high mountain environment than at sur-face stations, therefore changes in the global electrical cir-cuit might be detected more effectively in data from high mountain sites than at suface stations. Using the standard global (Carnegie) variation as a data prefilter (Isra¨el, 1973), Harrison (2004a) selected individual days on which local in-fluences were likely to be small: when combined, the PG from these days showed a downward trend. Thus, in addi-tion to the previous findings showing a long-term PG decline at Eskdalemuir and at Lerwick (Harrison, 2002) as well as Nagycenk (M¨arcz and Harrison, 2003), the Bavarian Alps measurements have a decrease in the 1970s and early 1980s.
2 Data used for analyses
In the earlier studies (Harrison, 2002; M¨arcz and Harrison, 2003), long-term atmospheric electrical changes were found in measurements covering several decades. Stations yielding data for such long intervals are unfortunately rare, but, nev-ertheless, two further sites in Europe have been found where continuous atmospheric electric measurements were made. These measurement stations were at Serra do Pilar, Portu-gal (41◦080N, 8◦360W) and in Athens, Greece (37◦580N, 23◦430E). Both these stations have more southerly locations than those considered in the previous work. These further European surface measurements are compared with iono-spheric potential soundings made above Weissenau, Ger-many (47.77◦N, 9.58◦E), (M¨ulheisen, 1977), from values tabulated by Budyko (1971). Soundings simultaneous with those from Weissenau were made from the Meteor research ship in the Atlantic, in March and April 1969. These simul-taneous VI determinations showed close quantitative
agree-ment, despite their separation across Europe, and confirmed
VIas a long-distance equipotential (M¨ulheisen, 1971). In
ad-dition, the March–April 1969 VI measurements show good
agreement with coincident surface PG measurements at Ler-wick (Harrison, 2005).
For the Portuguese station, hourly PG data for the in-terval 1960–1971 are available, (in Publicacoes do Instiuto Geof´ısico da Universidade do Porto), but data for the year 1962 were missing. Using the hourly values between 03:00 and 06:00 UT, an average (effectively for “dawn”) was cal-culated for each day. (Hours with negative PG values were discarded.) The basis for the selection of the dawn hours was that the mean diurnal variation plots given in the appro-priate observatory reports for the individual years generally showed minima around these hours. (It should be pointed out that the Carnegie curve, which represents the diurnal vari-ation in the global circuit, also shows a minimum around dawn, and a maximum in the early evening, using Universal Time.) Based on the dawn averages, a mean value for each year (except 1962) was determined. In addition, two further dawn data series were derived by selecting the three highest
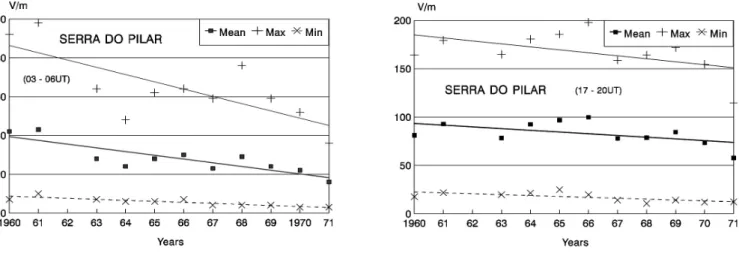
Fig. 1. Atmospheric Potential Gradient (PG) measurements obtained at Serra do Pilar (Portugal) (a) Changes in dawn values of PG (based
on data from 03:00 to 06:00 UT) between 1960 and 1971. (b) As Fig. 1a, but for evening PG values (based on data from 17:00 to 20:00 UT).
and the three lowest dawn averages for each month. Yearly means were calculated from these monthly maxima and min-ima averages. From plots of diurnal variations in the yearly observatory reports, the PG generally showed a maximum between 17:00 and 20:00 UT e.g. in the evening. Proceeding similarly to the data analysis for dawn, evening mean val-ues were derived for the years 1960–1971. As for the dawn data, evening maxima and minima were calculated using the three highest and the three lowest evening averages for each month.
The yearly reports issued by the Greek observatory in Athens (Bulletin of Atmospheric Electricity) cover a differ-ent period (between 1965 and 1977) to the Portuguese data, but there is a fortuituous overlap of seven years between the two observation periods. A feature of the Athens data is that three atmospheric electrical parameters were continu-ously reported over the full period of measurements: verti-cal air-Earth current density, PG and the positive polar air conductivity. (In addition, data on positive small ions and positive large ions are available for a somewhat shorter in-terval.) Observations of the air-Earth current density are un-usual at atmospheric electricity stations, and data on this pa-rameter, compared with PG data, are rather rare. Thus the data series from Athens are especially valuable for investi-gating changes in a characteristic parameter of the global at-mospheric electrical circuit over a quite long period. Based on the same approach to processing the data from the Por-tuguese station, values between 03:00 and 06:00 UT were used for calculating dawn averages and finally yearly means have been derived for all the three parameters. Hours with negative values have been discarded in the case of PG and air-Earth current density. (The Greek observatory reports pub-lished hourly values of the individual parameters in Eastern European Mean Time.) The three highest and three lowest dawn averages appearing in the individual months were also selected for determining yearly means, as for the Portuguese data.
3 Results
3.1 Long-term PG changes at Serra do Pilar
As described above, yearly means of the PG were first deter-mined for the dawn hours. These were augmented by two ad-ditional series of the dawn maxima and minima of each year, based on the three highest and the three lowest PG values appearing in individual months. These results from Serra do Pilar are presented in Fig. 1a. It can be seen that yearly mean values of PG at dawn show a distinct decreasing trend dur-ing the period analysed. A similar trend is displayed by the maximum values of dawn PG derived for this interval, even if the values of individual years show quite large fluctuations. The series of dawn PG minima also hints at a decline, but the absolute differences between the yearly means of minimum values are rather slight.
For comparison with the decreasing dawn PG trend found, similar series have been produced using hourly PG values appearing during the evening maximum of the diurnal vari-ation at Serra do Pilar. The yearly means, as well as the series based on the three highest and the three lowest PG values in individual months, all reveal a PG decline for the evening hours, too, as shown in Fig. 1b. Following earlier work (M¨arcz and Bencze, 1981; Harrison and Aplin, 2003), dawn values of PG are generally less disturbed by local influ-ences than for other times of the day, and may thus be most suitable for tracing global effects. Consequently the results presented in Fig. 1b confirm that, even in the evening data which might be more contaminated by local effects than the dawn values, a long-term PG decline is evident at Serra do Pilar.
3.2 Long-term changes in atmospheric electrical parame-ters at Athens
The availability of the vertical air-Earth current density (Jz)
1990 F. M¨arcz and R. G. Harrison: Long-term European atmospheric electrical changes
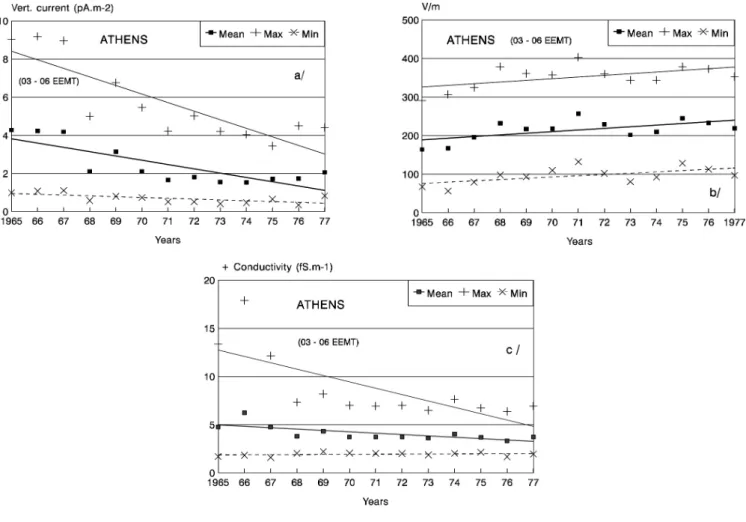
Fig. 2. (a) Changes in dawn values of air-Earth current density (based on data from 03:00 to 06:00 EEMT) derived for Athens between 1965
and 1977. (b) The same as in the case of air-Earth current density (a), but for the PG. (c) The same as in the case of (a) and (b) but for the positive conductivity.
suitable surface parameter with which to investigate changes in the atmospheric electrical global circuit. As for the Serra do Pilar data, yearly Jz means have been determined for
dawn hours (between 03:00 and 06:00 EEMT) as well as from two additional time series using the three highest and the three lowest dawn values in each month. These were found for all years 1965–1977. The results are plotted in Fig. 2a (top panel, left), where they show a distinct decrease of the vertical current density from 1965 to 1977, both for the yearly dawn means and the yearly dawn maxima. A slight decline is indicated in the series of yearly dawn minima.
A similar data selection procedure has been performed for the PG data from Athens, which is shown in Fig. 2b (top panel, right). It is clear that the yearly means determined show an increasing trend in the mean dawn PG from 1965 to 1977, also apparent in the dawn maxima and minima. Finally the positive air conductivity is presented in a similar way in Fig. 2c (bottom panel), which shows a moderate decline. Based on the selected dawn maxima, a somewhat steeper decreasing trend is detected in the positive polar conductiv-ity of the air which is strongly influenced by an extremely
high value in 1966. No trend appears in the series of dawn minima.
The Athens results seem to be in contradiction to those shown for the dawn and evening PG at Serra do Pilar in Figs. 1a and b. However a more complete analysis for Athens is possible because of the existence of data for the three pa-rameters. Air conductivity is the surface parameter most sen-sitive to local effects, and Jzthe surface parameter most
sen-sitive to global effects. The PG is, of course, a function of the both the local air conductivity and the global circuit param-eter Jz. The relatively low air conductivity indicates
consid-erable local aerosol pollution, as would be expected in a ma-jor European city. Taken in consideration with the relatively high mean values of PG, the local aerosol effects at Athens probably dominate the change in the PG. A further aspect which indicates the possibility of local effects is the large values of air conductivity at the beginning of the Athens data series, from 1965–1967. Because of surface deposition of radioactivity from nuclear weapons tests up to 1962 (Pierce, 1972), the surface layer conductivity may have been artifi-cially increased. This occurred at Eskdalemuir (Harrison,
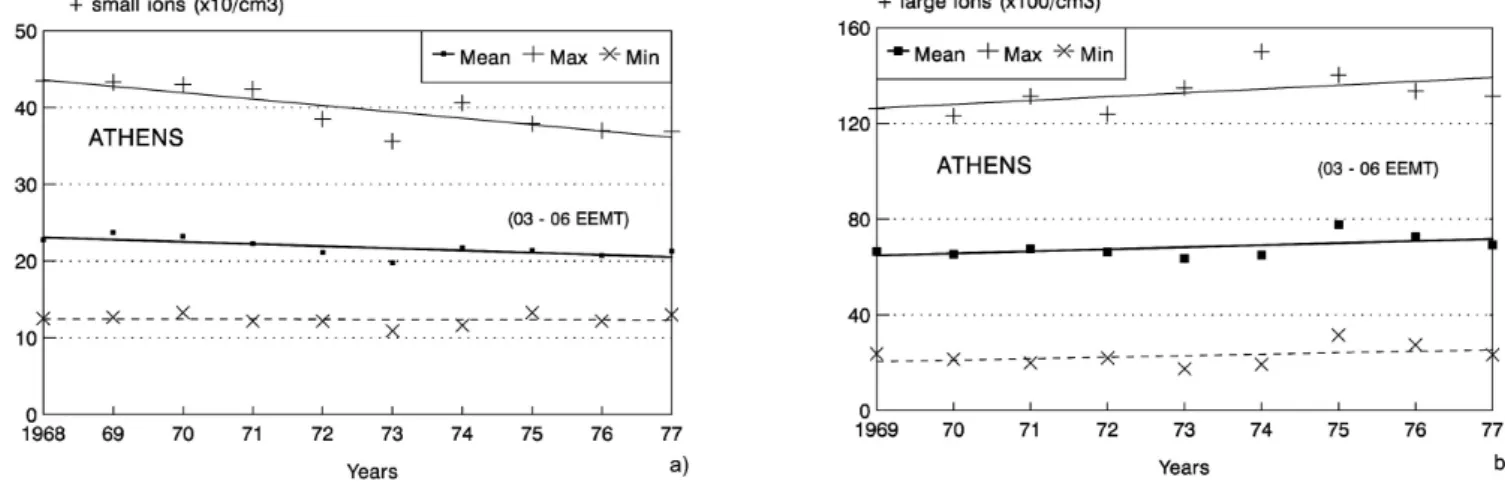
Fig. 3. (a) Changes in dawn values of the number of positive small ions (based on data from 03:00 to 06:00 EEMT) derived for Athens
between 1968 and 1977. (b) The same as in the case of small ions (a), but for positive large ions from 1969 to 1977.
2004b) affecting the site for much of the 1960s, but appar-ently not at Nagycenk, perhaps because of spatial differences in rainfall causing the surface radioactive deposition (M¨arcz and Harrison, 2003). In the case of Athens, it appears that the conductivity was increased and the PG decreased in the early part of the 1960s data, which may again result from the surface deposition of radioactivity. This could explain the reduced PG 1965–1967.
At Athens, small and large ion concentration were regu-larly obtained, a little after the beginning of the PG mea-surements. Observations of positive small ions are available from 1968 and those of positive large ions from 1969. As with the other atmospheric electric parameters, three data se-ries have been produced for the positive small and large ion data. Dawn means (between 03:00 and 06:00 EEMT) were determined for each year, and, using the three highest and three lowest ion counts in each month, yearly dawn maxima and dawn minima were also derived. These three data series are shown in Fig. 3. In the left panel (Fig. 3a), a moder-ate decreasing trend is revealed by the means determined for positive small ions and a quite distinct one by the series of dawn maxima, while no apparent trend is shown by the se-ries of dawn minima, during the interval from 1968 to 1977. In the right panel (Fig. 3b), an opposite trend exists in the positive large ions: all three series show increses in the dawn values of positive large ions between 1969 and 1977.
Both the number concentration of small ions and that of large ions play an important role in the local air conductiv-ity. Air conductivity is the product of the ion number con-centration and the ion mobility. There are great differences between the mobilities of small ions and those of large ions, with the average mobility of the large ions about 1/500 that of average small ions (Chapman, 1957). As the ion population becomes dominated by large ions, the average ion mobility reduces and the local air conductivity falls. The ion data can provide some insight into the decreasing trend in local air conductivity and increase in PG at Athens (see Fig. 2). The
decrease in small ion concentrations (Fig. 3a), and increase in large ion concentrations (Fig. 3b) shows that the compo-sition of the Athens ion population shifted to lower mobility (larger ions) from the sixties towards the seventies, reducing the conductivity. The increase in the PG may therefore result from the local reduction in the conductivity of the surface layer air.
The air-Earth current density depends on the vertically-integrated columnar resistance of the atmosphere, between the surface and the ionosphere. An increase in the surface and boundary layer component of the columnar resistance will act to increase the total columnar resistance, which is dominated by the lower atmosphere component. This, in turn, will cause the air-Earth current density to decrease. There is therefore no inconsistency in an increase in the PG coincident with a decrease in Jz, which could both arise
from an increase in lower atmosphere aerosol concentration. Linked changes in both parameters further emphasises the local effects of urban pollution on the atmospheric electrical parameters at Athens.
At a non-urban site such as Serra do Pilar, local aerosol influences will be less than at Athens. This is immediately evident from the considerably lower mean PG at Serra do Pi-lar compared with Athens, indicating air of higher conductiv-ity. The PG measurements from Serra do Pilar will therefore have a more global character than Athens: the differences in aerosol loading between urban and rural air is also likely to be the major reason for the differences in inter-annual vari-ability between the sites.
As discussed above, the Jzdecrease observed at Athens is
likely to arise from surface layer or boundary layer aerosol increases, however this does not preclude an additional re-sponse in the Athens Jzto global circuit changes. As a result,
the decreasing trend revealed in Jzin the dawn data at Athens
may include a contribution from a long-term change in the at-mospheric electrical global circuit between 1965 and 1977. Direct quantitative support for this possibility was presented
1992 F. M¨arcz and R. G. Harrison: Long-term European atmospheric electrical changes 0 100 200 300 400 500 600 700 59 60 61 62 63 64 65 66 67 68 69 70 71 Ionospheri c pot ent ia l / kV all soundings
class 1,2,3 soundings only, from Jan 1965 Linear trend (all soundings)
Linear tend (class 1,2,3 soundings from Jan 1965)
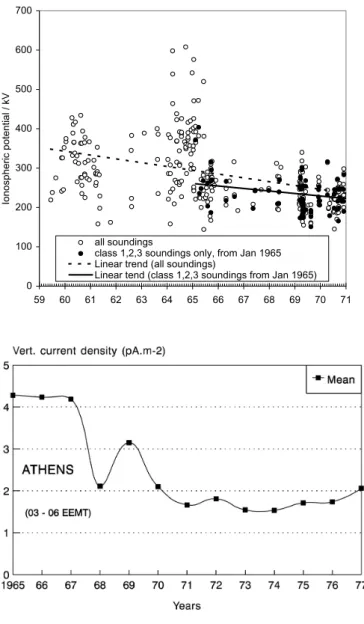
Fig. 4. (a) Ionospheric potential soundings made by M¨uhleisen and
Fischer above Weissenau, Germany (from Budyko, 1971). Least-square regression lines have been fitted to all the data, and to the class 1, 2, 3 soundings (ascent and descent values within 20%) from 1965. (b) Changes in the air-Earth current density (based on dawn data) at Athens from 1965 to 1977.
in M¨arcz and Harrison (2003), through a decline in Jz
mea-sured at Kew (near London), remote from the local pollution effects in Athens. The Kew data investigated spanned the interval 1966–1978, almost exactly the same as the Athens data.
3.3 Changes in the ionospheric potential
The balance between local and global effects may be clarified by studying changes in the ionospheric potential VI
occur-ring at the same time as the Athens measurements. In mea-surements of considerable importance to the scientific de-velopment of atmospheric electricity, M¨uhleisen and Fischer
(M¨uhleisen, 1977) carried out balloon soundings of the elec-tric field profile from Weissenau, Germany, to determine the potential difference between the top of the troposphere and the Earth’s surface. Because of the considerable conductiv-ity from cosmic ray ionisation in the upper troposphere and stratosphere, the upper balloon measurements are at a poten-tial close to VI.
Figure 4a shows the Weissenau time series of VI. There
is a long-term change with a significant maximum around the middle of the sixties, and a decrease towards the end of that decade. Meyerott et al. (1983) compared this VI data
series with cosmic ray and volcanic aerosol data over the period 1959–1976 and suggested that changes in the iono-spheric potential correlated most convincingly with changes in volcanic aerosols in the troposphere and stratosphere, such as that associated with the Southern Hemisphere eruption of Mt Agung in 1963. In deriving a quantitative estimate of the downward trend in VI, we have therefore chosen both to
in-clude and exin-clude the data before 1965, when the maxima occur. Some quality assessment of the individual data points is available. The ionospheric potential soundings were clas-sified 1 to 6, with classes 1, 2 and 3 denoting soundings with agreement between the measured VI on ascent and descent
within 5, 10 and 20% respectively (Budyko, 1971). If all the data is included, the decrease is 3.4% per year: if only the class 1, 2, 3 soundings from January 1965 are used, the annual decrease is 2.7%.
The vertical current density data of Athens (Fig. 4b) clearly has similarities to Fig. 4a. Here the yearly dawn means from Athens are plotted (which is different to that used in Fig. 2a). In both VI and the Athens Jz, the values
are increased before 1966, and there is a transient increase inVI and Jzin 1969. Despite the local changes, the Athens
Jztherefore also responds to global circuit changes, as
deter-mined by the VIsoundings.
4 Summary and discussion
Several different sets of atmospheric electrical data obtained in Europe during different periods of the twentieth century have now been analysed and compared. The data series span different times, and have variable local effects, so direct com-parison is not straightforward. In ideal circumstances, to compare the trends, it would firstly be desirable to have data which were simultaneous, with the same number of observa-tions available from the different staobserva-tions. This is far from the case. Secondly, the local factors vary in importance and different selection criteria are necessary at each site.
For studies of the global circuit, the ionospheric potential is the primary quantity of interest, followed by the air-Earth current density. The PG is then the remaining alternative, measured, in order of desirability, in oceanic air, mountain air, continental rural air and, finally, urban air.
T ab le 1. Summ ary of 20th Centur y Eur opean atmos pheric elect ricity chang es Lo cation para-situa tion se ason sele ction sa mples start finis h mid point Annu al chan ge r referen ce me ter (linea r fit) W eissen au VI Bal loon all 2 93 195 9 197 1 196 5 –3.4% ± 0.5% 0. 44 Pre sent w ork sou nding W eissen au VI Bal loon Sou nding 9 1 196 5 197 1 196 8 –2.7% ± 1.0% 0. 26 Pre sent w ork sou nding Cla ss 1 ,2 , 3 Ca rne gie -PG Atla ntic Fe bruary F air W eath er 2 1929 1968 194 8.5 –0.6% Ha rrison (2004 a) M eteor ocea nic ai r –M arch data –Apr il W ank PG Mou ntain an nual Carn egie cycle 13 1972 1984 197 8 -1.2% Ha rrison (2004 b) air day s Es kdale muir PG Con tinenta l an nual elec trical charac ter 31 1920 1950 193 5 –0.7% Ha rrison (2003 ) (rur al) “0a ” days (i.e. po siti v e P G v al ues on ly) Na gycen k PG Con tinenta l an nual da w n 40 1962 2001 198 1.5 –1.4% M ¨arcz an d Har rison (rur al) (2003) Se rra do Pilar PG Con tinenta l da w n 11 1960 1971 196 5.5 –6.5% ± 1.5% 0. 83 Pre sent w ork (rur al) Se rra do Pilar PG Con tinenta l (rura l) ev en ing 11 1960 1971 196 5.5 –2.1% ± 1.2% 0. 52 Pre sent w ork K ew PG Con tinenta l Ju ly all 53 1898 1950 192 4 –0.3% Ha rrison and A plin (urb an) (2002) K ew Jz Con tinent al an nual 15U T 1 3 196 6 197 8 197 2 –1.4% M ¨arcz an d Har rison (urb an) (2003) At hens Jz Con tinent al an nual da w n 1 0 196 8 197 7 197 2.5 –3.2% ± 2.0% 0. 50 Pre sent w ork (urb an)
1994 F. M¨arcz and R. G. Harrison: Long-term European atmospheric electrical changes With these aspects in mind, Table 1 organises the
atmo-spheric electricity information available from the different European stations, according to (1) the midpoint of the pe-riod of measurements for which the trend is found and (2) the nature of the air in which the data was obtained. The second factor is effectively a weighting of importance which should be applied to the result found. Table 1 includes the frac-tional change in the atmospheric electrical parameter con-sidered, derived using a linear least-squares fit (Press et al., 1989). The correlation coefficient between a linear model and the data is given for the sites considered in this paper, together with the probable uncertainty in the annual change determined.
Making a qualitative distinction between the data obtained in different locations, there is evidence for a decrease of about 0.5% to 0.7% per year between 1920 and 1970, which may extend back to 1898. The short period of ionospheric potential soundings indicates a greater annual reduction, of between 2.7 and 3.4%, between 1959 and 1971. Evidence from several stations suggests a continued decrease of about
∼1% per year between 1967 and 1984, possibly continuing until the present time. The common effect at several stations provides some confidence in the sign of the latter finding, but, because of the continental nature of the stations, less so in its magnitude.
In interpreting this finding, it is necessary to emphasise again the sensitivity of atmospheric electrical measurements to local atmospheric composition changes. As well as the difficulty this presents in separating local and global effects, any global circuit changes deduced may arise from the ef-fects of volcanic aerosol (Meyerott et al., 1983) or cosmic ray changes (Harrison, 2002) on the global circuit, or in-deed a combination of these factors with different regional and global importance. The few measurements (or estimates) of the ionospheric potential available for the first half of the century support the possibility of a global circuit decrease (Harrison, 2002).
For the later period (1970 onwards), however, the iono-spheric potential was constant at about 250 kV, which is not consistent with the trends found from the surface stations. The apparent paradox between the later surface measure-ments and balloon soundings can be resolved if the changes observed in the northern hemisphere, and in continental Eu-rope, reflect changes in the regional columnar resistance, rather than the global circuit. A major source of the global circuit is the current produced by tropical thunderstorms, in which regions only high energy cosmic rays can penetrate into the troposphere: there is less solar modulation of the high energy cosmic rays than for the lower energy cosmic rays which penetrate at the midlatitudes typical of the Eu-ropean stations. Consequently there could be a differential effect of the solar modulation, between the source (tropical) and load (midlatitude) regions of the global circuit.
It remains unclear what the direct effects, of the air-Earth current density are on meteorological processes, or if they can present a feedback on climate processes or indeed am-plification of solar variability. However the evidence for
a reduction in the air-earth current density over Europe in recent decades indicates that the period of temperature in-creases in the late twentieth century coincided with a reduced (compared with the early twentieth century) air-earth current density.
Acknowledgements. R. G. Harrison thanks the Hungarian Academy
of Sciences for supporting a visit to Sopron, and Mansfield College, University of Oxford, for a Visiting Fellowship during which this work was completed.
Topical Editor O. Boucher thanks B. A. Tinsley and another referee for their help in evaluating this paper.
References
Budyko, M. I.: Results of observations of atmospheric electricity, The World Network, Additional Issue 1965–1969, USSR Chief Administration of the Hydro-Meteorological Service, Leningrad, 1971, 51–58, 1971.
Bulletin of Atmospheric Electricity: National Observatory of Athens Meteorological Institute, Athens, Greece, individual an-nual volumes 1965–1977.
Carslaw K. S., Harrison R. G., and Kirkby J.: Cosmic rays, clouds and climate, Science, 298, 5599, 1732–1737, 2002.
Harrison, G.: Twentieth century secular decrease in the at-mospheric electric circuit, Geophys. Res. Lett., 29(14), doi:10.1029/2002GL014878, 2002.
Harrison, R. G.: Reply to comment on “Twentieth Century secular decrease in the atmospheric potential gradient”, Geophys. Res. Lett., 30(15), 1804, doi:10.1029/2003GL017381, 2003. Harrison, R. G.: Long term measurements of the global
atmo-spheric electric circuit at Eskdalemuir, Scotland, 1911–1981, At-mos Res., 70 (1), 1-19, 10.1016/j.atAt-mosres.2003.09.007, 2004a. Harrison, R. G.: Long-range correlations in measurements of the
global atmospheric electric circuit, J. Atmos. Solar-Terrestrial Physics, 66/13-14, 1127–1133, 2004b.
Harrison, R. G.: The global atmospheric electrical circuit and cli-mate, Surveys in Geophysics, in press 2005.
Harrison, R. G. and Carslaw, K. S.: Ion-aerosol-cloud processes in the lower atmosphere, Reviews of Geophysics, 41(3), 1012, doi:10.1029/2002RG000114, 2003.
Harrison R. G. and Aplin, K. L.: Mid-nineteenth century diurnal smoke concentrations at Kew, London, Atmos. Environ., 36, 25, 4037–4043, 2002.
Harrison R. G. and Aplin, K. L.: Nineteenth century Parisian smoke variations inferred from Eiffel Tower atmospheric electrical observations, Atmos Environ., 37, 5319–5324, doi:10.1016/j.atmosenv.2003.09.042, 2003.
Isra¨el, H.: Atmospheric Electricity, vol. 2 (Fields, charges, cur-rents), (Problems of Cosmic Physics, vol. 29), Israel Program for Scientific Translations, Jerusalem, 1973.
Meyerott, R. E., Reagan, J. B., and Evans, J. E.: On the correlation between ionospheric potential and the intensity of cosmic rays, in: Weather and Climate Responses to Solar Variation, edited by: McCormac, B. M., Colorado Associated University Press, 449– 460, 1983.
M¨arcz, F. and Bencze, P.: Variations of the atmospheric electric po-tential gradient at the Nagycenk observatory, Acta Geod. Geoph. Mont. Hung., 16, 415–422, 1981.
M¨arcz, F., S´atori, G., and Zieger, B.: Variations in Schumann res-onances and their relation to atmospheric electric parameters at
Nagycenk station, Ann. Geophys., 15, 1604–1614, 1997,
SRef-ID: 1432-0576/ag/1997-15-1604.
M¨arcz, F. and Harrison, R. G.: Long-term changes in atmospheric electrical parameters observed at Nagycenk (Hungary) and the UK Observatories at Eskdalemuir and Kew, Ann. Geophys., 21, 2193–2200, 2003,
SRef-ID: 1432-0576/ag/2003-21-2193.
M¨ulheisen, R. P.: New determination of the air-earth current over the ocean and measurements of ionospheric potentials, Pure and Applied Geophysics, 84, 112–115, 1971.
M¨ulheisen, R.: The global circuit and its parameters, in: Electrical Processes in Atmospheres, edited by: Dolezalek, H. and Reiter, R., Steinkopf Verlag, 467–476, 1977.
Pierce, E. T.: Radioactive fallout and secular effects in atmospheric electricity, J. Geophys. Res., 77, 1, 482–487, 1972.
Press W. H., Flannery, B. P., Teukolsky, S. A., and Vetterling, W.: Numerical Recipes in Pascal, Cambridge University Press, 1989. Publicacoes do Instituto Geof´ısico da Universidade do Porto: Geo-electricidade, Observat´orio da Serra do Pilar, V. N. de Gaia-Portugal, individual annual volumes 1960–1961 and 1963–1971. Stanhill, G. and Cohen, S.: Global dimming: a review of the evi-dence for a widespread and significant reduction in global radia-tion with discussion on its probable causes and possible agricul-tural consequences, Agric For Meteorol., 107, 255–278, 2001. Tinsley, B. A.: Influence of the solar wind on the global electric
circuit and inferred effects on cloud microphysics, temperature and dynamics in the troposphere, Space Sci Rev., 94, 231–258, 2000.
Williams, E. R.: Comment to “Twentieth century secular decrease in the atmospheric potential gradient” by Harrison, G., Geophys. Res. Lett. 30(15), 1803, doi:10.1029/2003GL017094, 2003.