HAL Id: hal-00302564
https://hal.archives-ouvertes.fr/hal-00302564
Submitted on 31 Jan 2007HAL is a multi-disciplinary open access
archive for the deposit and dissemination of sci-entific research documents, whether they are pub-lished or not. The documents may come from teaching and research institutions in France or abroad, or from public or private research centers.
L’archive ouverte pluridisciplinaire HAL, est destinée au dépôt et à la diffusion de documents scientifiques de niveau recherche, publiés ou non, émanant des établissements d’enseignement et de recherche français ou étrangers, des laboratoires publics ou privés.
On the diurnal variability of particle properties related
to black carbon in Mexico City
D. Baumgardner, G. L. Kok, G. B. Raga
To cite this version:
D. Baumgardner, G. L. Kok, G. B. Raga. On the diurnal variability of particle properties related to black carbon in Mexico City. Atmospheric Chemistry and Physics Discussions, European Geosciences Union, 2007, 7 (1), pp.1623-1653. �hal-00302564�
ACPD
7, 1623–1653, 2007
particle properties related to black carbon in Mexico City
D. Baumgardner et al. Title Page Abstract Introduction Conclusions References Tables Figures ◭ ◮ ◭ ◮ Back Close
Full Screen / Esc
Printer-friendly Version Interactive Discussion
EGU Atmos. Chem. Phys. Discuss., 7, 1623–1653, 2007
www.atmos-chem-phys-discuss.net/7/1623/2007/ © Author(s) 2007. This work is licensed
under a Creative Commons License.
Atmospheric Chemistry and Physics Discussions
On the diurnal variability of particle
properties related to black carbon in
Mexico City
D. Baumgardner1, G. L. Kok2, and G. B. Raga1
1
Centro de Ciencias de la Atm ´osfera, Universidad Nacional Aut ´onoma de M ´exico, M ´exico
2
Droplet Measurement Technologies, M ´exico
Received: 8 January 2007 – Accepted: 24 January 2007 – Published: 31 January 2007 Correspondence to: D. Baumgardner (darrel@servidor.unam.mx)
ACPD
7, 1623–1653, 2007
particle properties related to black carbon in Mexico City
D. Baumgardner et al. Title Page Abstract Introduction Conclusions References Tables Figures ◭ ◮ ◭ ◮ Back Close
Full Screen / Esc
Printer-friendly Version Interactive Discussion
EGU
Abstract
The black carbon mass (BCM) of individual, internally mixed aerosol particles was measured with the Single Particle Soot Photometer (SP2) in April of 2003 and 2005. The average BCM, single particle BC mass fraction and BCM equivalent diameter were evaluated with respect to concentrations of carbon monoxide (CO), particle bound
poly-5
cyclic aromatic hydrocarbons (PPAH) and condensation nuclei (CN). The BCM and CO have matching diurnal trends that are linked to traffic patterns and boundary layer growth. The PPAH reaches a maximum at the same hour as CO and BCM but returns rapidly back to nighttime values within three hours of the peak. The number of parti-cles containing BCM ranges between 10% to 40% of all partiparti-cles between 200 nm and
10
700 nm and the BCM is between 4% and 12% of the total mass in this size range. The average BC equivalent mass diameter varies between 300 and 400 nm and reaches its daily minimum value when BCM is a maximum. The BC particles have the thinnest coating of non-light absorbing material during periods of maximum BCM. The scatter-ing and absorption coefficients, Bscat and Babs, derived from the SP2 measurements 15
were compared with direct measurements from a nephelometer and soot photometer. The measured and derived Babs are in close agreement whereas the Bscat compar-isons show larger discrepancies in absolute value and daily trends. Even though ap-proximately 40% of the BCM is in particles with diameters smaller than 200 nm, the extinction coefficient is dominated by the BCM in particles larger than this size. The
20
BCM contributes up to 20% of the total extinction in this size range. BCM is emitted at a rate of 1200 metric tons per year in Mexico City, based upon the SP2 measurements and correlations between BCM and CO.
1 Background
The environmental impact of atmospheric aerosols is multifaceted as a result of the
25
wide range in their concentration and size, complexity of chemical composition and 1624
ACPD
7, 1623–1653, 2007
particle properties related to black carbon in Mexico City
D. Baumgardner et al. Title Page Abstract Introduction Conclusions References Tables Figures ◭ ◮ ◭ ◮ Back Close
Full Screen / Esc
Printer-friendly Version Interactive Discussion
EGU optical properties that contribute to their role in global climate change (e.g., Charlson
et al.1992), photochemistry (e.g., Dickerson et al., 1997; Jacobson, 1998; Raga and Raga, 2000) and cloud processes (e.g., Hobbs, 1991). Black carbon aerosol (BCA)1is an anthropogenic component of atmospheric particles that has been recognized for its environmental impact for more than 100 years (Novakov, 1982). These ubiquitous
par-5
ticles, found throughout the world’s atmosphere, are produced primarily by incomplete combustion of fossil fuel and from burning of biomass (e.g., Ghan and Penner,1992) and may have much longer lifetimes than other types of aerosol particles.
The climatic importance of BCA is a result of the high efficiency with which they scatter and absorb light over a wide range of solar and infrared wavelengths. This is
10
highlighted by comparing the efficiency with which radiant energy is removed by BCA and ammonium sulfate, another type of atmospheric particle found in abundance in urban and rural areas. Figure 1 illustrates the difference in extinction efficiency between these two types of particles at 550 nm, the wavelength of maximum solar radiance. The extinction was calculated incorporating Mie theory (Bohren and Huffman, 1983) and
15
assuming spherical particles with the refractive indices of ammonium sulfate (1.43– 0.0i) and BCA (1.750–0.440i) at this wavelength (Twitty and Weinman, 1971; Volz, 1972).
For diameters smaller than 30 nm, BCA have an extinction efficiency that is larger 1
As noted by Schwarz et al. (2006) the term “black carbon” has different meanings depend-ing on the context of the discussion and the method of detection. It is common to associate the meaning of measurements of carbonaceous aerosol components with the specific instru-ment being used (P ¨oschl, 2002). The measureinstru-ments discussed in the current paper are from an instrument that detects only the refractory and strongly light-absorbing component of com-bustion generated aerosols. This component is referred to as either elemental carbon (EC) or BC depending on whether particles are being classified by their thermochemical or optical properties, respectively. Thus EC and BC are often used interchangeably. In the present study we will follow the convention used by Schwarz et al. (2006) and label the ambient measure-ments as black carbon aerosol (BCA), recognizing that BCA represents only a component of the carbonaceous material often called soot.
ACPD
7, 1623–1653, 2007
particle properties related to black carbon in Mexico City
D. Baumgardner et al. Title Page Abstract Introduction Conclusions References Tables Figures ◭ ◮ ◭ ◮ Back Close
Full Screen / Esc
Printer-friendly Version Interactive Discussion
EGU than sulfate by factors of up to several orders of magnitude and is comparable at larger
diameters. Although the number concentration of BCA in the free troposphere is gen-erally less than that of sulfate aerosols their impact on radiative fluxes can be of the same order of magnitude. Furthermore, as shown by recent modeling and laboratory studies (Bond et al., 2006; Mikhailov et al., 2006) coatings of non-light absorbing
ma-5
terial on the surface of BCA will enhance the extinction efficiency by factors of 1.5 to 2.5 as a result of multiple reflections within the coating on the BC.
The optical properties of BCA must be taken into account when interpreting mea-surements by remote sensors, i.e. lidars, sun photometers and satellites. The algo-rithms that are applied for extracting information from these measurements incorporate
10
assumptions about the aerosol properties, e.g. the shape of the size distribution and the composition and optical characteristics. In some cases, the objective is to derive particle properties whereas in other applications aerosols are a source of interference to be removed. Many years of airborne and ground based measurements have gone into the parameterization of aerosol properties to use in these algorithms; however,
15
until recently, very few measurements had been made of BCA characteristics.
The study described herein is a particle by particle evaluation of BCA properties in Mexico City, their diurnal trends and links to other related anthropogenic gases and aerosols. The remainder of the paper describes the instrumentation, evaluates the physical and optical characteristics of BCA and discusses the relationships between
20
primary emissions and meteorological processes with respect to the aerosol proper-ties.
ACPD
7, 1623–1653, 2007
particle properties related to black carbon in Mexico City
D. Baumgardner et al. Title Page Abstract Introduction Conclusions References Tables Figures ◭ ◮ ◭ ◮ Back Close
Full Screen / Esc
Printer-friendly Version Interactive Discussion
EGU
2 Measurement and Analysis Methodology
The measurements were made with a Single Particle Soot Photometer2(SP2), a neph-elometer and Particle Soot Aerosol Photometer3(PSAP), a Photoelectric Aerosol Sen-sor4 (PAS-2000) and with a condensation nucleus (CN) counter (TSI Model 30105). These instruments provide measurements of the BCA physical, chemical and optical
5
properties, as described below in Sect. 3 and 4.
3 BC physical properties
The SP2 employs a patented technique (Stephens et al., 2003) that combines the principles of light scattering, absorption and emission to derive the diameter, mass and incandescence temperature of individual aerosol particles in the diameter range
10
(for the current study) from 0.20 to 0.70 nm (Baumgardner et al., 2004; Schwarz et al., 2006; Moteki and Kondo, 2006). Particles enter the sample cavity of the SP2 (the typical sample flow rate for the instrument is 2 cm3 s−1) and while passing through the beam of a diode-pumped Nd:YAG laser (1.064µm wavelength) they scatter and absorb light. Two cones of scattered light, 30◦–60◦ and 120◦–150◦, are collected by
15
the optics and focused on a photodetector that produces a voltage signal proportional to the scattering intensity. Particle diameter is derived from the scattered light using classical Mie theory.
Particles that contain material that absorbs light at the wavelength of the laser are heated and reach a temperature at which they incandesce and emit light at a
wave-20
length that is a function of the temperature. Two detectors, each with filters for passing different wavelengths, measure the emitted light. The temperature is derived from the
2
Droplet Measurement Technologies (DMT), Boulder, CO.
3
Radiance Research, Seattle, WA
4
Ecochem Analytic, West Hills, CA
5
ACPD
7, 1623–1653, 2007
particle properties related to black carbon in Mexico City
D. Baumgardner et al. Title Page Abstract Introduction Conclusions References Tables Figures ◭ ◮ ◭ ◮ Back Close
Full Screen / Esc
Printer-friendly Version Interactive Discussion
EGU ratio of signals from these detectors (Baumgardner et al., 2004; Schwarz et al., 2006;
Moteki and Kondo, 2006). The intensity of the emitted light is proportional to the mass of the light absorbing material and the temperature of incandescence identifies the composition.
Calibration of the SP2 is carried out with commercially available spherical particles.
5
Monodispersed, polystyrene latex spheres are used to calibrate the scattering signals and glassy carbon spheres of known density were size-selected with an electrostatic classifier for calibration of the incandescence signals. Incandescing particles are sized in the range of 3–300 fg/particle (200–700 nm mass equivalent diameter at 1.42 g cm−3 density). The optical diameter between 200–700 nm is derived from the scattering
10
signal. The scattering and incandescence signals are recorded particle-by-particle such that the instrument is sensitive to very small concentrations of BCA.
The black carbon mass (BCM) fraction, i.e. the ratio of BCM to total mass of an individual, internally mixed particle, is estimated by comparing the mass equivalent diameter of the BC particle with the optical diameter:
15
BCMfraction= (Dmass eqv/Doptical)3 (1)
and
Dmass eqv= (6BCM/πρ)1/3 (2)
A value 2.24 g cm−3is assumed for the BC density (Fuller et al., 1999). An advantage
of the SP2’s optical design is that the collection of scattered light over a wide solid angle
20
decreases the sensitivity of the derived particle diameter to variations in the refractive index. As shown in Fig. 2, using the ammonium sulfate and BC particles as an ex-ample, the scattering cross sections are similar even though the refractive indices are quite different. The refractive index selected for the current study assumes an average mixture of 10% BC and 90% organo-sulfate by mass. The average refractive index for
25
this mixture is 1.48–.05i. The choice of this refractive index limits the uncertainty in derived diameter to a maximum of ±0.03 µm as shown by the box drawn in Fig. 2. It
ACPD
7, 1623–1653, 2007
particle properties related to black carbon in Mexico City
D. Baumgardner et al. Title Page Abstract Introduction Conclusions References Tables Figures ◭ ◮ ◭ ◮ Back Close
Full Screen / Esc
Printer-friendly Version Interactive Discussion
EGU is important to note that the measured BCM is insensitive to the depth of the non-light
absorbing coating (Slowik et al., 2006; Moteki and Kondo, 2006).
The number concentration of Mexico City’s aerosol are dominated by particles smaller than the SP2’s threshold of 200 nm as previous measurements with a differ-ential mobility analyzer (DMA) have shown (Baumgardner et al.,2000); however, more
5
than 60% of the aerosol volume is in particles larger than this diameter. Furthermore, evaluation of BCM on aluminum substrates exposed in an eight stage, multi-orifice, uni-form deposit impactor (MOUDI), using evolved gas analysis (Baumgardner et al., 2002; Raga et al., 2003), indicate that almost 80% of the BCM is in BCA larger than 180 nm. Following the analysis approach taken by Schwarz et al. (2006), we estimate the
frac-10
tion of BCM that is below the size detection limit of the SP2 by fitting a lognormal curve to the mass size distribution of BCA derived from accumulated SP2 measurements. The volume size distributions derived previously from DMA measurements in Mexico City (Baumgardner et al., 2000) have a shape that is lognormally distributed. Lognor-mal distributions of BCA have also been observed in the free troposphere by Clarke et
15
al. (2004) and in other urban environments by (Kondo et al., 2006). Figure 3 illustrates a typical BCM size distribution and the monomodal lognormal function that is fit to it. The lower horizontal axis represents the mass-equivalent diameter of BCA as defined in (2). Based on the comparison of the BCM measured with the SP2 and the derived mass found by integrating the lognormal functions, approximately 60% of the BCM is
20
in equivalent diameters larger than 200µm (shaded area under the solid curve). In the remainder of this paper, the bulk BCM values that are reported and used in com-parisons with the other atmospheric parameters are derived from the lognormal fit to hourly averages of the BCM size distributions.
A detailed description of the theory of operation, uncertainties in determining the size
25
and mass of BCA and measurement limitations are documented elsewhere (Schwarz et al., 2006; Moteki and Kondo, 2006). For the interpretation of the measurements presented in the present study, the estimated uncertainties in BCM, Doptical, Dmass eqv
ACPD
7, 1623–1653, 2007
particle properties related to black carbon in Mexico City
D. Baumgardner et al. Title Page Abstract Introduction Conclusions References Tables Figures ◭ ◮ ◭ ◮ Back Close
Full Screen / Esc
Printer-friendly Version Interactive Discussion
EGU
4 BCA Optical Properties
The scattering, absorption and extinction coefficients, Bscat, Babs and Bext, at an
inci-dent wavelength ofλ=550 nm, are derived for individual particles measured by the SP2 using optical efficiencies calculated from Mie theory (Bohren and Huffman, 1983) and assuming that the particles are spherical. A look-up table was generated that contains
5
refractive indices for particles in the size range of the SP2 and with 21 mixtures of BCA with a refractive index of 1.75–0.44i and organo-sulfate with refractive index of 1.48– 0.00i. The fraction of BCA by volume in a particle is varied between 0 and 1 in 0.05 steps and the refractive index of the mixture is computed using the volume mixing rule (Bohren and Huffman, 1983). For example a particle containing 10% BCA by volume
10
will have a refractive index of (0.9*1.48+0.1*1.75)–0.1*0.44 i.
The scattering, absorption and extinction coefficients and the single scattering albedo are computed by determining the BCMfraction of each particle and finding the optical parameters associated with this fraction in the lookup table.
An independent measurement of Babs was made with the PSAP, an instrument that 15
uses the integrating plate technique (Bond et al., 1999). Particles are collected on a filter and the transmission of green light through this filter is measured in real time. By definition, the value of Babsis
Babs = (A/V)ln(I/I0) (3)
where I and I0are the transmitted and incident light intensities, A is the area of the filter 20
covered by aerosol particles and V is the volume of air that passed through the filter to deposit a given layer of particles. The source of incident radiation in the PSAP is a light emitting diode (λ=550 nm) and particles are collected on a 10 mm quartz filter. The light is transmitted through a second filter, unexposed to ambient air and is the reference for the incident radiation, I0. Detailed laboratory studies of these instruments
25
(Bond et al., 1999) have arrived at an empirical correction to Eq. (3) that accounts for the scattering of the aerosol on the collection filter.
Babs=(Babs measured− 0.02Bscat mreasured)/1.2 (4)
ACPD
7, 1623–1653, 2007
particle properties related to black carbon in Mexico City
D. Baumgardner et al. Title Page Abstract Introduction Conclusions References Tables Figures ◭ ◮ ◭ ◮ Back Close
Full Screen / Esc
Printer-friendly Version Interactive Discussion
EGU Babs measuredis the absorption coefficient derived from (3) and Bscat mreasuredis the
scat-tering coefficient measured with a nephelometer. This equation corrects for the effects of light scattering from particles on the filter, an interference that decreases the trans-mission through the filter, and for matrix effects of the quartz fibers that also enhance the measured attenuation and lead to overestimates of Babs. Additional corrections are
5
made for variations in the diameter of the aerosol deposit and changes in flow veloc-ity related to the differences in the altitude of Mexico Cveloc-ity and Seattle, Wa, where the instrument flow meter was calibrated.
5 Particle chemistry
Particle-bound polycyclic aromatic hydrocarbon (PPAH) was measured with the PAS
10
2000 that uses 207 nm light from an Excimer lamp with energies of 6.7 eV. Compounds on the surface of particles that have ionization potentials below the energy of the in-cident photons will release an electron that is subsequently removed with an ion trap. The positively charged particle is collected on a filter that is connected to an electrical ground and the electrical potential between the ion trap and positively charged filter
15
creates an electrical current, proportional to the number of ions that reach the filter per unit time and is measured with an electrometer. The ionization potentials of PPAH on the surfaces of particles are generally below the energy of the incident photons; how-ever, the PAS is also sensitive to BCA that has a work function of 4.4 eV. Some other organic compounds can also be ionized (Marr et al., 2006) and contribute to the signal
20
from the PAS; hence, the signal from the PAS should be considered a relative, rather than absolute indicator of the concentration of mixtures of PPAH, BC and some trace amounts of other organics. The manufacturer cautions that the PAS must be carefully calibrated with the aerosol mixture being studied if the results are to be interpreted quantitatively. This type of calibration is difficult, if not impossible, for an urban
envi-25
ronment where the aerosol mixture will change significantly depending on the relative fractions of BCA and organics. Given the uncertainties in absolute value, the results
ACPD
7, 1623–1653, 2007
particle properties related to black carbon in Mexico City
D. Baumgardner et al. Title Page Abstract Introduction Conclusions References Tables Figures ◭ ◮ ◭ ◮ Back Close
Full Screen / Esc
Printer-friendly Version Interactive Discussion
EGU from the PAS will be reported as a mass concentration of PPAH∗, where the asterisk
indicates that this quantity is only a relative indicator of PPAH.
Carbon monoxide was not part of the instrument package used in the current study; however, it is a useful tracer for primary emissions and can also indicate changes in the height of the boundary layer (Baumgardner et al., 2003). The CO used in the
fol-5
lowing analysis is from measurements made with the Mexico City pollution monitoring network, Red Automatica de Monitoreo Ambiental (RAMA). Two RAMA stations are within five kilometers of the measurement site discussed below. The hourly CO values from these stations were averaged to obtain the data reported here.
6 Results
10
The measurement site is on the roof of the building of the Centro de Ciencias de la Atm ´osfera (CCA) inside the campus of the Universidad Nacional Aut ´onoma de M ´exico (UNAM). The university is located in the southwest quadrant of the Mexico City basin and the CCA building (19.6◦N, 99.10◦W) is 2288 m above sea level. The university campus is in a residential area with no significant industrial or commercial activities;
15
however, nearby there is a steady flow of auto and bus traffic related to the circulation of university staff and students. Approximately 400 m to the southeast is the subway terminal where more than 400 buses collect passengers daily (Peralta et al., 2006).
The particle instrumentation was connected to a common manifold that draws its air from a fifteen meter chimney ventilated at a rate of approximately 90 l min−1. All the
20
instruments except the SP2 were operated 24 h a day. The data reported here are from 27 April to 1 May 2003 and 2–8 April 2005. The same SP2, CN counter, PSAP and nephelometer were used in both years. The SP2 was only operated from 07:00 to 18:00 in 2003 but made measurements 24 h a day in 2005. The PPAH∗results reported here are only from the 2005 campaign. Unless noted otherwise, the data discussed
25
below represent a compilation from both years, with the exception of the PPAH∗. The CN concentration, Bscat, and Babs were output to the data system at 1 Hz and
ACPD
7, 1623–1653, 2007
particle properties related to black carbon in Mexico City
D. Baumgardner et al. Title Page Abstract Introduction Conclusions References Tables Figures ◭ ◮ ◭ ◮ Back Close
Full Screen / Esc
Printer-friendly Version Interactive Discussion
EGU the PPAH∗ is an average over six seconds. The SP2 records information on every
particle; however, as a result of the very high data rates and large quantity of data, this instrument was set to record data during one minute periods out of every ten minutes. All of the parameters were averaged over ten minute intervals. The RAMA CO data were only available as hourly averages.
5
Examination of the time series for CN, Babs, BCM and CO indicates a reproducible evolution with the daily maxima occurring at approximately the same time each day. Figures 4a-f display the diurnal patterns of CO, CN, PPAH∗, Babs and Bscat averaged
over the entire sampling period (vertical bars indicate the standard deviation about the mean). Note that the values of CO, CN, PPAH∗ and B
abs all increase rapidly at ap-10
proximately 6am local time from very low and fairly constant nighttime values. Larger day-to-day variability, represented by the standard deviations, is evident in all parame-ters until sunset (∼ 1900 LST) except for PPAH* which decreases significantly both in magnitude and variability after 1000. All these variables, except for Bscat, are
indica-tors of primary emissions. Note that Bscat follows a different diurnal pattern whereby it 15
reaches a maximum later in the morning compared to the other variables. This parti-cle property is more sensitive to the evolution of partiparti-cle sizes and is loosely linked to primary emissions.
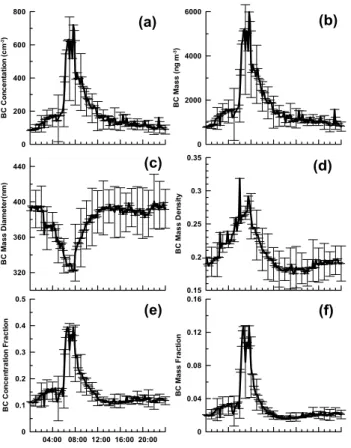
Figures 5a-f show the daily averages of the BCA number and mass concentration, Dmass eqv, BCMfraction and the ratios of the bulk BCA concentration and mass to the 20
total concentration and mass. As in Fig. 4, the time series in each panel represent averages over the 14 days. All of the variables show similar trends that are dominated by two processes: 1) primary emissions from fossil fuel combustion and 2) mixing and dilution. Combustion of gasoline and diesel fuel is the primary source of CO and BCA, respectively, in Mexico City (Baumgardner et al., 2002). The onset of major
25
vehicular movement is at 0600 LST and continues unabated throughout the day until approximately 2000 (PROAIRE, 1997). Figures 4a and 5b show that CO and BCM reach their peak at 0800 LST. Further increase is limited by the growth of the boundary layer after sunrise due to surface heating (Whiteman et al., 2000) that leads to turbulent
ACPD
7, 1623–1653, 2007
particle properties related to black carbon in Mexico City
D. Baumgardner et al. Title Page Abstract Introduction Conclusions References Tables Figures ◭ ◮ ◭ ◮ Back Close
Full Screen / Esc
Printer-friendly Version Interactive Discussion
EGU mixing and dilution of gases and particles (Fast et al., 1998; Raga et al., 1999). The
decrease observed in the CO and BCM after 0900 LST is a result of this process. Although the maximum period of traffic is from 0600 to 1800 there is continuing ve-hicular activity 24 h a day, as is seen by the non-rush hour levels of CO and BCM of 0.5 ppm and 1000 ng m−3. The total particle concentration, represented by the CN 5
measurements (Fig. 4b), follows a similar trend as CO and BCM. The CN rarely de-creases below 10 000 cm−3and only during the nighttime when day-to-day variability is at a minimum. Of all the environmental variables measured only the PPAH∗decreases
to values below its detection limit of 5 ng m−3. The PPAH∗ reaches a maximum at the same time as the CN, indicating that the majority of the particles containing PAH are
10
quite small, i.e. those that dominate the CN concentration.
The average mass equivalent diameter (Fig. 5c) is inversely correlated with BCM, reaching a minimum when BCM is at its maximum. This is because the amount of BCM in individual particles is smaller during the initial increase of emissions in the early morning, but gradually increases during the day. The BCMfraction(Fig. 5d) increases in 15
the morning during the onset of traffic then decreases throughout the afternoon and evening. This suggests that when the average mass diameter is smaller, the particles have a thinner layer of non-light absorbing material than later in the day when they age and gases condense onto their surfaces. As seen in Figs. 5e and f, the relative fraction of particles that contain BC and the relative amount of total BCM increase at the same
20
time as the BCM. The fraction of BCM containing particles increases by a factor of four from 10% to 40% from 0600 to 1000 am LST and the BCM increases by a factor of six, from 2% to 12% of the total mass.
The directly measured optical properties, Bscat and Babs, are also linked to the total
number concentration and BCM. Note that whereas Babs reaches its maximum at the 25
same time as CN (Fig. 4d), the Bscat reaches a peak two hours later. This illustrates the counterbalancing influences of particle growth versus mixing and dilution, i.e. light scattering is proportional to the number concentration and the optical cross section of particles. The number concentration of particles is decreasing by dilution but the
ACPD
7, 1623–1653, 2007
particle properties related to black carbon in Mexico City
D. Baumgardner et al. Title Page Abstract Introduction Conclusions References Tables Figures ◭ ◮ ◭ ◮ Back Close
Full Screen / Esc
Printer-friendly Version Interactive Discussion
EGU average diameter is increasing through condensation and coalescence. The dilution
process eventually overcomes the particle growth but delays the time of the maximum Bscat by approximately two hours.
The distribution by size of the number concentration with and without BCM, BCM concentration and BCMfraction are presented in Figs. 6a–d. The measurements were
5
separated into four, six hour time periods and averaged over all days. The four curves in each panel are over the intervals 0000–0600, 0600–1200, 1200–1800 and 1800 to 2400. We observe that the size distributions of particles with no BCM have a different diurnal trend than those particles with BCM. The non-BCM particles increase in con-centrations over all sizes between the first and second time period, maintaining their
10
peak at 250 nm. During the third time period the particles have grown and the peak of the distribution is at 350 nmm where it remains into the evening, although at a lower concentration. The size distribution of the particles containing BCM (Fig. 6b) changes from a spectrum with a rather broad peak between 250 and 300 nm to a sharply peaked spectrum in the second time period with maximum at 250 nm. In the following time
pe-15
riods the concentration is a factor of two lower and shifts slightly towards larger sizes. The BCM distribution (Fig. 6c) follows the same trend as the number concentration of BCA.
The BCMfraction as a function of size shows a distinct shift in the shape of the
dis-tributions between the morning and afternoon periods. In the morning, the smallest
20
particles have the largest fraction of BCM in them, i.e. the thinnest coating of non-light absorbing material. In the afternoon, the peak has shifted from an average diameter of 220 nm to 300 nm.
7 Discussion
A more detailed examination of the diurnal trends provides further insight with respect
25
to the underlying processes that control the evolution of aerosol properties in Mexico City. The increase in the mass equivalent diameter of BCM (Fig. 5c), after its minimum
ACPD
7, 1623–1653, 2007
particle properties related to black carbon in Mexico City
D. Baumgardner et al. Title Page Abstract Introduction Conclusions References Tables Figures ◭ ◮ ◭ ◮ Back Close
Full Screen / Esc
Printer-friendly Version Interactive Discussion
EGU at 0800 am, is unlikely a result of coalescence, a process that will increase the size
of BC once it has been produced from combustion, since this process requires many hours to cause a significant shift in the size distribution A more reasonable explanation is that there are changes in the relative intensity of emission sources. Diesel combus-tion is the primary source of BCM in particles (Baumgardner et al., 2002); however,
5
some BCM is produced from gasoline and the charcoal stoves that are used for cook-ing by street vendors. A shift from smaller, primary BCA to larger ones would suggest a shift from primarily auto traffic to a greater frequency of heavy vehicles like trucks and buses that use diesel. A higher emission rate of BCA would also increase the coalescence rate and lead to larger average mass diameters.
10
The rapid decrease of PPAH (Fig. 4c), within four hours of its maximum, suggests a removal process related to photochemical reactions; however, this behavior has been previously reported (Marr et. al., 2006) and it was concluded that the rapid decay in PPAH is a result of the coating of PAH-containing particles with secondary organics. This suppresses the response of the PAS 2000; hence, not only is the evolution of
15
PPAH not linked to the dilution, as is the case with related primary emission variables, but it also urges caution in using this type of analyzer for analyzing urban PPAH.
The CN and Babsreach their maxima simultaneously (Fig. 4) but CN decreases more
rapidly than the Babs. The matching peaks in Babs and CN are expected since light
absorption in Mexico City is primarily from high concentrations of BCA whose source
20
is identical to the CN particles. The slower rate of decrease in Babs (Fig. 4d) compared
to that of the BCA concentration and mass (Fig. 5a and 5b) is somewhat puzzling at first inspection. The response of Babs should be similar to CN and BMC, yet the afternoon trend follows that of Bscat (Fig. 4e). Recalling that Babs was corrected for
the interference of light scattering on the transmission through its filter and under the
25
assumption that the Babs values were biased by scattering from the filter, we adjusted the correction factor in (4) until the trend in Babs more closely matched that of CN
and BMC. The corrected values of Babs matched the diurnal pattern of BMC when the
correction factor was changed from 0.02 to 0.2. This is a significant difference from the 1636
ACPD
7, 1623–1653, 2007
particle properties related to black carbon in Mexico City
D. Baumgardner et al. Title Page Abstract Introduction Conclusions References Tables Figures ◭ ◮ ◭ ◮ Back Close
Full Screen / Esc
Printer-friendly Version Interactive Discussion
EGU correction factor suggested by Bond et al. (1999) and suggests several possibilities:
1) the aerosols that were used in the Bond et al. laboratory tests have significantly different optical properties than atmospheric aerosols in Mexico City, 2) the scattering coefficients measured by the nephelometer in the current study are too low by a factor of 10, or 3) a combination of both. One method to test the fidelity of the corrected
5
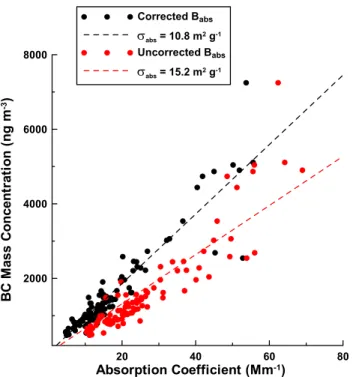
Babs is to compare values of the BC mass specific absorption, σabs, derived from the
uncorrected and corrected Babs. Theσabs is defined as the absorption cross section
per unit mass in units of m2g−1and is calculated by dividing B
absby BCM. Figure 7 is a
scatter plot that compares hourly averages of BCM with the corrected and uncorrected Babs. The regression of BCM versus Babs is constrained to pass through the origin 10
under the assumption that the absence of BCM implies negligible Babs. The slope of the regression is the value of σabs. With no correction, the derived σabs is 15.2 m
2
g−1 whereas after the corrected σabs is 10.8 m 2
g−1. Many studies have evaluated the relationship ofσabs to the properties of BCM (e.g., Liousse et al., 1993; Petzold et
al., 1997; Fuller et al., 1999) and have concluded thatσabs can vary from 4 m 2
g−1to
15
greater than 20 m2g−1. Recent studies (Schuster et al., 2005; Barnard et al., 2005), using several independent methods to derive σabs, estimate a value between 8 and
10 m2g−1for Mexico City. Not only is theσabsderived from the corrected Babscloser to
the Schuster et al. and Barnard et al. studies, but the correction reduces the dispersion between BCM and Babs.
20
A second method was used to assess the validity of Babs corrections. As described
previously, the optical properties of individual particles were estimated from the SP2 measurements using the derived diameter and BCfraction to calculate the relative
frac-tion of BC and thickness of the coating material. Figures 8a–c compare the absorpfrac-tion and scattering coefficients, as well as the single scattering albedo, determined directly
25
from the nephelometer and PSAP (dashed curves) and indirectly from the SP2 mea-surements (solid curves). These curves are the daily averages over the 14 days of sampling and show that the corrected Babsfrom the PSAP (Fig. 8a) are in good
addi-ACPD
7, 1623–1653, 2007
particle properties related to black carbon in Mexico City
D. Baumgardner et al. Title Page Abstract Introduction Conclusions References Tables Figures ◭ ◮ ◭ ◮ Back Close
Full Screen / Esc
Printer-friendly Version Interactive Discussion
EGU tional correction to Babs is justifiable, although further investigation into the nature of
the correction may be warranted to evaluate if this is unique to the aerosol properties in Mexico City. The directly measured and derived Bscat are in best agreement
dur-ing periods when they are a maximum (Fig. 8b); however, the derived Bscat is much
larger than the Bscat measured with the nephelometer outside of these periods. This
5
discrepancy may be a result of the assumptions used for the refractive index of the non-light absorbing component of the particles. Another explanation is that the neph-elometer has a heated inlet whose purpose is to remove water from aerosols prior to measurement. This reduces the size of the particles with a subsequent reduction in the scattering. This also explains the need for the larger correction factor to Babs and 10
implies that the original correction factor of 0.02 (Bond et al., 1999) would have been sufficient had the measured Bscat been determined from particles before they were
dried. The SP2 and PSAP measured ambient aerosols with no heated inlet.
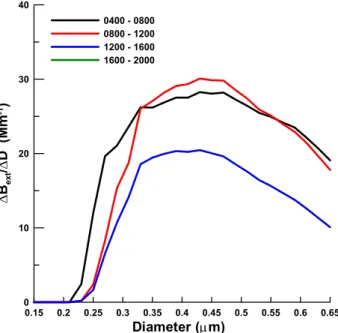
The contribution of the BCA to the total light extinction is shown in Fig. 8d where the percentage contribution was derived by calculating the extinction coefficient from the
15
SP2 measurements with and without the particles that contained BCM. During those periods where 40% of the particles contained BC (Fig. 5e) and 12% of the total mass was BC, these particles contributed 20% to the total extinction. Figure 9 shows the size distributions of the extinction coefficient divided into four time periods. Here we see that the majority of the extinction is from particles larger than 300 nm, even though
20
less approximately 60% of the BCM is in this size range. This highlights the radiative importance of BCM in the size range from 200 nm to 700 nm.
The CO concentrations are useful for diagnosing BCM when measurements of BCM are not available (Baumgardner et al., 2002). As shown in Fig. 10 the BCM in Mexico City is related to the CO by a factor of 1800, i.e. one ppm of CO is associated with 1800
25
ng m−3of BC. When adjusted to standard atmospheric pressure and temperature, and
converting ppm to mg m−3, the BCM to CO relationship is one microgram of BCM for every milligram of CO. This is the same relationship that was previously derived by Baumgardner et al. (2002). According to the 1999 inventory of emissions (PROAIRE,
ACPD
7, 1623–1653, 2007
particle properties related to black carbon in Mexico City
D. Baumgardner et al. Title Page Abstract Introduction Conclusions References Tables Figures ◭ ◮ ◭ ◮ Back Close
Full Screen / Esc
Printer-friendly Version Interactive Discussion
EGU 1999), Mexico City produces approximately 1.2×10⁶metric tons of CO yearly. Using
the BCM to CO relationship we predict 1200 metric tons of BCM emitted yearly in Mex-ico City. This is similar to the value of 1700 ± 200 metric tons predicted by Jiang et al. (2006) who used measurements of Babsto estimate BCM.
8 Summary
5
Measurements of the BCM in individual, internally mixed aerosol particles were made with the SP2 in April of 2003 and 2005. The measurement technique uses light scat-tering and incandescence to derive the optical and BC mass equivalent diameters from which the fraction of BCM in each particle can be estimated. The scattering and ab-sorption coefficients were also derived from the SP2 measurements and compared
10
with these optical properties that were directly measured with a nephelometer and soot photometer. The characteristics of the BCA were compared with the CO, CN, and PPAH concentrations, those environmental variables that are also linked to primary emissions.
The BCM, CO and CN have matching diurnal trends that are associated with traffic
15
patterns and boundary layer growth. The BCM reaches a daily average maximum of 5000±1000 ng m−3 but has a nighttime, background level of 1000 ng m−3. The num-ber of particles containing BCM ranges between 10% to 40% of all particles between 200 nm and 700 nm and the BCM is between 4% and 12% of the total mass in this size range. The BC particles have the thinnest coating of non-light absorbing material
20
during periods of maximum BCM.
The absorption coefficient derived from the SP2 was in close agreement with di-rect measurements made with the PSAP. Approximately 60% of the BCM and 80% of the extinction coefficient are in particles with diameters larger than 200 nm. BCM is emitted at a rate of 1200 metric tons per year in Mexico City, based upon the SP2
25
measurements and correlations between BCM and CO.
under-ACPD
7, 1623–1653, 2007
particle properties related to black carbon in Mexico City
D. Baumgardner et al. Title Page Abstract Introduction Conclusions References Tables Figures ◭ ◮ ◭ ◮ Back Close
Full Screen / Esc
Printer-friendly Version Interactive Discussion
EGU standing of how aerosols evolve in urban areas. These properties should be taken into
account in applications that require accurate depictions of atmospheric aerosols. Acknowledgements. The SP2 was developed under Navy contract #N00014-01-C-0335. We
would like to thank A. Retama of the Mexico City environmental service for providing the CO data from the RAMA network.
5
References
Baumgardner, D., Raga, G. B., Kok, G., Ogren, J., Rosas, I., Baez, A., and Novakov, T.: On the Evolution of Aerosol Properties at a Mountain Site Above Mexico City, J. Geophys. Res., 105, 22 243–22 253, 2000.
Baumgardner, D., Raga, G., Peralta, O., Rosas, I., Castro, T., Kuhlbusch, T., John, A., and 10
Petzold, A.: Diagnosing black carbon trends in large urban areas using carbon monoxide measurements, J. Geophys. Res., 10.1029/2001JD000626, 2002.
Baumgardner, D., Kok, G., and Raga, G.: Warming of the Arctic Lower Stratosphere by Light Absorbing Particles, GRL, 31, L06117, doi:10.1029/2003GL018883, 2004.
Barnard, J. C., Kassianov, E. I., Ackerman, T. P., Frey, S., Johnson, K., Zuberi, B., Molina, L. 15
T., Molina, M. J., Gaffney, J. S., and Marley, N. A.: Measurements of Black Carbon Specific Absorption in the Mexico City Metropolitan Area during the MCMA 2003Field Campaign, Atmos. Chem. Phys. Discuss., 5, 4083–4113, 2005,
http://www.atmos-chem-phys-discuss.net/5/4083/2005/.
Bohren, C. F. and Huffman, D. R.: Absorption and Scattering of Light by Small Particles, John 20
Wiley, Hoboken, N. J., pp.530, 1983.
Bond, T. C., Anderson, T. L., and Cambell, D.: Calibration and intercomparison of filter-based measurements of visible light absorption by aerosols, Aerosol Sci. and Tech., 30, 582–600, 1999.
Bond, T. C.; Habib, G., and Bergstrom, R. W.: Limitations in the enhancement of visible light 25
absorption due to mixing state, J. Geophys. Res., Vol. 111, No. D20, D20211, 2006.
Charlson, R. J., Schwartz, S., Hales, E. J. M., Cess, R. D., Coakely, J. A., Hanson, J. E., and Hoffmann, D. J.: Climate forcing by anthropogenic aerosols, Science, 255, 423–430, 1992. Clarke, A. D., Shinozuka, Y., Kapustin, V. N., et al.: Size distributions and mixtures of dust and
ACPD
7, 1623–1653, 2007
particle properties related to black carbon in Mexico City
D. Baumgardner et al. Title Page Abstract Introduction Conclusions References Tables Figures ◭ ◮ ◭ ◮ Back Close
Full Screen / Esc
Printer-friendly Version Interactive Discussion
EGU
black carbon aerosol in Asian outflow: Physiochemistry and optical properties, J. Geophys. Res., 109, D15S09, doi:10.1029/2003JD004378, 2004.
Comis´ıon Ambiental Metropolitana: Inventario de Emisiones de la Zona Metropolitana del Valle de M ´exico, Secretar´ıa del Medio Ambiente, Gobierno de M ´exico, M ´exico, 233p, 2004. Dickerson, R., Kondragunta, S., Stenchikov, G., Civerolo, K., Doddridge, B.: The impact of 5
aerosols on solar UV radiation and photochemical smog. Science, 278, 827–830, 1997. Fast, J. and Zhong, S.: Meteorological factors associated with inhomogeneous ozone
concen-trations within the Mexico City basin, J. Geophys. Res. 103, 18 927–18 946, 1998.
Fuller, K. A., Malm, W. C., and Kreidenweis, S. M.: Effects of mixing on extinction by carbona-ceous particles, J. Geophy. Res., 104, 15 941–15 954, 1999.
10
Ghan, S. J. and Penner, J. E.: Smoke, effects on climate, in: Encyclopedia of Earth System Science, Vol 4, W.A. Nierenberg, ed., Academic Press, San Diego, CA., 191–198, 1992. Hobbs, P. V.: Aerosol-Cloud-Climate Interactions. Academic Press, Inc., New York, 480 pp,
1991.
Jacobson, M.: Studying the effects of aerosols on vertical photolysis rate coefficient and tem-15
perature profiles over an urban airshed, J. Geophys. Res., 103, 10 593–10 604, 1998. Jiang, M., Marr, L. C., Dunlea, E. J., Herndon, S. C., Jayne, J. T., Kolb, C. E., Knighton, W.
B., Rogers, T. M., Zavala, M., Molina, L. T., and Molina, M.: Vehicle fleet emissions of black carbon, polycyclic aromatic hydrocarbons, and other pollutants measured by a mobile laboratory in Mexico City, Atmos. Chem. Phys., 5, 3377–3387, 2005,
20
http://www.atmos-chem-phys.net/5/3377/2005/.
Kondo, Y., Komazaki, Y., Miyazaki, Y., Moteki, N., Takegawa, N., Kodama, D., Deguchi, S., Nogami, M., Fukuda, M., Miyakawa, T., Morino, Y., Koike, M., Sakurai, H., and Ehara, K.: Temporal Variations of Elemental Carbon in Tokyo, J. Geophys. Res., 111, D12205, doi:10.1029/2005JD006257, 2006.
25
Liousse, C., Cachier, H., and Jennings, S. G.: Optical and thermal measurements of black carbon aerosol content in different environments: variation of the specific attenuation cross section, Atmos. Env. Part A, 27, 1203–1211, 1993.
Marr, L. C. ,Dzepina, K., Jimenez, J. L., Reisen, F., Bethel, H. L., Arey, J., Gaffney, J. S., Marley, N. A., Molina, L. T., and Molina, M. J.: Sources and transformations of particle-30
bound polycyclic aromatic hydrocarbons in Mexico City, Atmos. Chem. Phys., 1733–1745, 2006.
ACPD
7, 1623–1653, 2007
particle properties related to black carbon in Mexico City
D. Baumgardner et al. Title Page Abstract Introduction Conclusions References Tables Figures ◭ ◮ ◭ ◮ Back Close
Full Screen / Esc
Printer-friendly Version Interactive Discussion
EGU
Properties of Soot-Water Drop Agglomerates: An Experimental Study, J. Geophys. Res., 111, D07209, doi:10.1029/2005JD006389, 2006.
Moteki, N. and Kondo, Y.: Effects of mixing state on black carbon measurement by Laser-Induced Incandescence, Aerosol Sci. Technol., in press, 2007.
Novakov, T.: BC in the atmosphere, in: Particulate carbon: Atmospheric Life Cycle, edited by: 5
G. T. Wolff and R. L. Klimisch, Plenum Press, New York, 19–37, 1982.
Peralta, O., Baumgardner, D., and Raga, G. B.: Spectrothermography of Carbonaceous parti-cles, J. Atmos. Chem., in review, 2007.
Petzold, A., Kopp, C., and Niessner, R.: The dependence of the specific attenuation cross-section on black carbon mass fraction and particle size, Atmos. Env., 31, 661–672, 1997. 10
P ¨oschl, U.: Aerosol particle analysis: Challenges and progress, Anal. Bioanal. Chem., 375, 30–32, 2002.
PROAIRE: Programa para mejorar la calidad del aire en el valle de M ´exico: 1995–2000. Depar-tamento del Distrito Federal; Gobierno del Estado M ´exico; Secretar´ıa de Medio Ambiente,
Recursos Naturales y Pesca y Secretaria de Salud. 1st ed., pp 244, Mexico, 1997.
15
Raga, G. B., Kok, G. L., Baumgardner, D., and Rosas, I.: Some aspects of boundary layer evolution in Mexico City. Atmos. Environ. 33, 5013–5021, 1999.
Raga, G. B. and Raga, A.: On the formation of elevated ozone peak in Mexico City, Atmos. Environ., 34, 4097–4102, 2000.
Raga G. B., Baumgardner D., Peralta, O., and Saavedra, M. I.: Carbon content of size frac-20
tionated particles in Mexico City, European Aerosol Conference, Madrid, S477–S478, 1–5 September, 2003.
Schuster, G. L., Dubovik, O., Holben, B. N., and Clothiaux, E. E.: Inferring black carbon content and specific absorption from AERONET retrievals, J. Geo. Res.-A, 101, 10S17, doi:10.1029/2004JD004548, 2005.
25
Schwarz, J. P., Gao, R. S., Fahey, D. W., Thomson, D. S., Watts, L. A., Wilson, J. C., Reeves, J. M., Baumgardner, D. G., Kok, G. L., Chung, S., Schulz, M., Hendricks, J., Lauer, A., K ¨archer, B., Slowik, J. G., Rosenlof, K. H., Thompson, T. L., Langford, A. O., Lowenstein, M., Aikin, K. C.: Single-particle measurements of mid latitude black carbon and light-scattering aerosols from the boundary layer to the lower stratosphere, J. Geophys. Res. 111, D16207, 30
doi:10.1029/2006JD007076, 2006.
Seinfeld, J. H. and Pandis, S. N.: Atmospheric chemistry and physics, John Wiley and Sons, N. Y., 1326 pp, 1998.
ACPD
7, 1623–1653, 2007
particle properties related to black carbon in Mexico City
D. Baumgardner et al. Title Page Abstract Introduction Conclusions References Tables Figures ◭ ◮ ◭ ◮ Back Close
Full Screen / Esc
Printer-friendly Version Interactive Discussion
EGU
Slowik, J. G., Cross, E., Han, J., Davidovits, P., Onasch, T. B., Jayne, J. T., Williams, L. R., Canagaratna, M. R., Worsnop, D. R., Chakrabarty, R. K., Arnott, W. P., Schwarz, J. P., Gao, R. S., Fahey, D. W., and Kok, G. L.: Intercomparison of instruments measuring black carbon content and optical properties of soot particles, Aerosol. Sci. Technol., accepted, 2007. Stephens, M., Turner, N., and Sandberg, J.: Particle identification by Laser Induced Incandes-5
cence in a solid state laser cavity, Appl. Optics, 42, 3726–3736, 2003.
Twitty, J. T. and Weinman, J. A.: Radiative properties of carbonaceous aerosols, J. Appl. Met., 10, 725–731, 1971.
Volz, F. E.: Infrared refractive index of atmospheric aerosol substances, Appl. Opt., 11, 755– 759, 1972.
10
Whiteman, C. D., Zhong, S., Bian, X., Fast, J. D., and Doran, J. C.: Boundary layer evolution and regional-scale diurnal circulations over the Mexico Basin and Mexican Plateau, J. Geophys. Res. 105, 10 081–10 102, 2000.
ACPD
7, 1623–1653, 2007
particle properties related to black carbon in Mexico City
D. Baumgardner et al. Title Page Abstract Introduction Conclusions References Tables Figures ◭ ◮ ◭ ◮ Back Close
Full Screen / Esc
Printer-friendly Version Interactive Discussion EGU 0.001 0.01 0.1 1 Diameter (µm) 1E-009 1E-008 1E-007 1E-006 1E-005 1E-004 1E-003 1E-002 1E-001 1E+000 1E+001 Si n g le Pa rt ic le Ex ti n c to n E ff ic ie n c y λ = 550 nm Sulfate (m = 1.43 -0.0i) BC (m = 1.75 - 0.44i)
Fig. 1. The extinction efficiency of BC (solid) is compared with that of ammonium sulfate (dashed).
ACPD
7, 1623–1653, 2007
particle properties related to black carbon in Mexico City
D. Baumgardner et al. Title Page Abstract Introduction Conclusions References Tables Figures ◭ ◮ ◭ ◮ Back Close
Full Screen / Esc
Printer-friendly Version Interactive Discussion EGU 0.1 0.2 0.3 0.4 0.5 0.6 0.7 0.8 Diameter (µm) 1E-014 1E-013 1E-012 1E-011 1E-010 1E-009 1E-008 Sc a tt e ri n g C ro s s Se c ti o n ( c m 2) λ = 1064 nm Sulfate (m = 1.43 -0.0i) BC (m = 1.75 - 0.44i)
Figure 2 Scattering cross sections for sulfate (dashed) and BC (solid) particles as a
Fig. 2. Scattering cross sections for sulfate (dashed) and BC (solid) particles as a function of particle size for the collection angles (30◦–60◦and 120◦–150◦) and wavelength of the SP2 laser.
ACPD
7, 1623–1653, 2007
particle properties related to black carbon in Mexico City
D. Baumgardner et al. Title Page Abstract Introduction Conclusions References Tables Figures ◭ ◮ ◭ ◮ Back Close
Full Screen / Esc
Printer-friendly Version Interactive Discussion EGU 0 0.1 0.2 0.3 0.4 0.5 0.6 0.7 BCM Equivalent Diameter (µm) 2 4 6 8 10 ∆ B C M/ ∆ D (µ g m -3 µ m -1) Measurement Lognormal fit C0 = 13 Dg = .23 σ = 1.7
Figure 3 The BCM in particles smaller than the size threshold of the SP2 (0.20) is
Fig. 3. The BCM in particles smaller than the size threshold of the SP2 (0.20) is estimated by fitting a lognormal distribution to the measurements (dashed curve). As compared to the total BCM estimated from the lognormal distribution, the SP2 measures approximately 60% of the ambient BCM as shown by the shaded area under the measured size distribution (solid curve).
ACPD
7, 1623–1653, 2007
particle properties related to black carbon in Mexico City
D. Baumgardner et al. Title Page Abstract Introduction Conclusions References Tables Figures ◭ ◮ ◭ ◮ Back Close
Full Screen / Esc
Printer-friendly Version Interactive Discussion EGU 0 1 2 3 4 C a rb o n M o n o x id e ( p p m ) 0 10000 20000 30000 40000 C N C o n c e n tr a ti o n ( c m -3) 0 40 80 120 P P A H ( n g m -3) 04:00 08:00 12:00 16:00 20:00 24:00 (a) (b) (c) (d) 0 40 80 120 160 200 240 Bsca t (M m -1) 10 20 30 40 50 60 Bab s (M m -1) (e)
Figure 4 Typical diurnal evolution derived from averaging all sampling days, for a)
Fig. 4. Typical diurnal evolution derived from averaging all sampling days, for (a) CO, (b) CN, (c) PPAH*, (d) Babsand (e) BscatThe vertical bars indicate one standard deviation and represent an estimate of the day-to-day variability.
ACPD
7, 1623–1653, 2007
particle properties related to black carbon in Mexico City
D. Baumgardner et al. Title Page Abstract Introduction Conclusions References Tables Figures ◭ ◮ ◭ ◮ Back Close
Full Screen / Esc
Printer-friendly Version Interactive Discussion EGU 0 2000 4000 6000 B C M a s s ( n g m -3) 320 360 400 440 B C M a s s D ia m e te r( n m ) 0.15 0.2 0.25 0.3 0.35 B C M a s s D e n s it y 0 0.1 0.2 0.3 0.4 0.5 B C C o n c e n tr a ti o n F ra c ti o n 04:00 08:00 12:00 16:00 20:00 (b) (c) (f) (e) 0 200 400 600 800 B C C o n c e n ta ti o n ( c m -3) 0 0.04 0.08 0.12 0.16 B C Ma s s F ra c ti o n (a) (d)
Fig. 5. As in Fig. 4 but for (a) BC concentration, (b) BC mass, (c) Dmass−eqv, (d) BC mass density, (e) BC fraction and (f) BC mass fraction. The vertical bars indicate one standard deviation and represent an estimate of the day-to-day variability.
ACPD
7, 1623–1653, 2007
particle properties related to black carbon in Mexico City
D. Baumgardner et al. Title Page Abstract Introduction Conclusions References Tables Figures ◭ ◮ ◭ ◮ Back Close
Full Screen / Esc
Printer-friendly Version Interactive Discussion EGU 0.2 0.3 0.4 0.5 0.6 Diameter (µm) 0 20 40 60 ∆ N /∆ D - B C (c m -3) 0.2 0.3 0.4 0.5 0.6 Diameter (µm) 0 20 40 60 80 100 120 140 ∆ N /∆ D - N o B C (c m -3) 0 0.04 0.08 0.12 0.16 0.2 ∆ B C M/ ∆ D (µ g m -3) 0000 - 0600 0600 - 1200 1200 - 1800 1800 - 2400 0 0.02 0.04 0.06 0.08 B C MF ra c ti o n (a) (b) (c) (d)
Fig. 6. These size distributions are daily averages every six hours for the 14 days of sampling and show the number concentrations of particles with no BC (a), with BC (b), the BC mass concentration (c) and the BCM fraction (d).
ACPD
7, 1623–1653, 2007
particle properties related to black carbon in Mexico City
D. Baumgardner et al. Title Page Abstract Introduction Conclusions References Tables Figures ◭ ◮ ◭ ◮ Back Close
Full Screen / Esc
Printer-friendly Version Interactive Discussion EGU 20 40 60 80 Absorption Coefficient (Mm-1) 2000 4000 6000 8000 B C M a s s C o n c e n tr a ti o n ( n g m -3) Corrected Babs σabs = 10.8 m2 g-1 Uncorrected Babs σabs = 15.2 m2 g-1
Figure 7 The BC mass concentration, compared with the absorption coefficient,
σ σ
Fig. 7. The BC mass concentration, compared with the absorption coefficient, provides an estimate of the BC mass specific absorption coefficient, σabs. Here the two values ofσabs are
derived from the uncorrected (red) and corrected (black) directly measured values of Babs.
ACPD
7, 1623–1653, 2007
particle properties related to black carbon in Mexico City
D. Baumgardner et al. Title Page Abstract Introduction Conclusions References Tables Figures ◭ ◮ ◭ ◮ Back Close
Full Screen / Esc
Printer-friendly Version Interactive Discussion EGU 4 8 12 16 20 B C C o n tr ib u ti o n to Ex ti n c ti o n ( % ) 0.8 0.85 0.9 0.95 1 S in g le S c a tt e ri n g A lb e d o 10 20 30 40 50 60 Bab s (M m -1) 04:00 08:00 12:00 16:00 20:00 (c) (b) (a) 200 300 400 500 600 Bs cat (M m -1) (d) 04:00 08:00 12:00 16:00 20:00 04:00 08:00 12:00 16:00 20:00 04:00 08:00 12:00 16:00 20:00
Fig. 8. The evolution of the particle optical properties, derived from averaging all sampling days, is compared here for Babs(a), Bscat(b), and single scattering albedo (c), derived indirectly from the SP2 measurements (solid) and directly from the nephelometer and PSAP (dashed). The contribution of the BC aerosol to the total extinction is shown in panel (d).
ACPD
7, 1623–1653, 2007
particle properties related to black carbon in Mexico City
D. Baumgardner et al. Title Page Abstract Introduction Conclusions References Tables Figures ◭ ◮ ◭ ◮ Back Close
Full Screen / Esc
Printer-friendly Version Interactive Discussion EGU 0.15 0.2 0.25 0.3 0.35 0.4 0.45 0.5 0.55 0.6 0.65 Diameter (µm) 0 10 20 30 40 ∆ Be x t /∆ D (M m -1) 0400 - 0800 0800 - 1200 1200 - 1600 1600 - 2000
Figure 9 These size distributions of the extinction coefficient derived from the SP2
Fig. 9. These size distributions of the extinction coefficient derived from the SP2 measurements are daily averages every six hours for the 14 days of sampling.
ACPD
7, 1623–1653, 2007
particle properties related to black carbon in Mexico City
D. Baumgardner et al. Title Page Abstract Introduction Conclusions References Tables Figures ◭ ◮ ◭ ◮ Back Close
Full Screen / Esc
Printer-friendly Version Interactive Discussion EGU 0 1 2 3 4 CO (ppm) 0 2000 4000 6000 8000 B C Ma s s C o n c e n ta ti o n (n g m -3) BCM = 1794* CO r2 = 0.97
Figure 10 Relationship between BC mass and CO derived from present study, and
Fig. 10. Relationship between BC mass and CO derived from present study, and similar to that obtained in (Baumgardner et al., 2002).