HAL Id: hal-00295838
https://hal.archives-ouvertes.fr/hal-00295838
Submitted on 6 Feb 2006
HAL is a multi-disciplinary open access
archive for the deposit and dissemination of
sci-entific research documents, whether they are
pub-lished or not. The documents may come from
teaching and research institutions in France or
abroad, or from public or private research centers.
L’archive ouverte pluridisciplinaire HAL, est
destinée au dépôt et à la diffusion de documents
scientifiques de niveau recherche, publiés ou non,
émanant des établissements d’enseignement et de
recherche français ou étrangers, des laboratoires
publics ou privés.
tropospheric SO2 plumes in the Po-valley, Italy
P. Wang, A. Richter, M. Bruns, J. P. Burrows, R. Scheele, W. Junkermann,
K.-P. Heue, T. Wagner, U. Platt, I. Pundt
To cite this version:
P. Wang, A. Richter, M. Bruns, J. P. Burrows, R. Scheele, et al.. Airborne multi-axis DOAS
mea-surements of tropospheric SO2 plumes in the Po-valley, Italy. Atmospheric Chemistry and Physics,
European Geosciences Union, 2006, 6 (2), pp.329-338. �hal-00295838�
Atmos. Chem. Phys., 6, 329–338, 2006 www.atmos-chem-phys.org/acp/6/329/ SRef-ID: 1680-7324/acp/2006-6-329 European Geosciences Union
Atmospheric
Chemistry
and Physics
Airborne multi-axis DOAS measurements of tropospheric SO
2
plumes in the Po-valley, Italy
P. Wang1,4, A. Richter1, M. Bruns1, J. P. Burrows1, R. Scheele2, W. Junkermann3, K.-P. Heue4, T. Wagner4, U. Platt4, and I. Pundt4
1Institute of Environmental Physics, University of Bremen, Germany
2Royal Netherlands Meteorological Institute (KNMI), De Bilt, the Netherlands 3Research Center Karlsruhe, IMK-IFU, Garmisch-Partenkirchen, Germany 4Institute of Environmental Physics, University of Heidelberg, Germany
Received: 25 January 2005 – Published in Atmos. Chem. Phys. Discuss.: 6 April 2005 Revised: 10 January 2006 – Accepted: 10 January 2006 – Published: 6 February 2006
Abstract. During the second FORMAT (FORMaldehyde
as A Tracer of oxidation in the troposphere) campaign in 2003 the airborne multi-axis DOAS instrument (AMAX-DOAS) performed scattered-light spectroscopic measure-ments of SO2 over the city of Mantova and the power
plant Porto Tolle, both situated in the Po-valley, Northern Italy. The SO2vertical columns and emission flux were
de-rived from two days of measurements, 26 and 27 Septem-ber 2003. The SO2 emission flux from the power plant
Porto Tolle was calculated to 1.93×1025molec s−1 on 26 September and in good agreement with official emission data, which quote 2.25×1025molec s−1. On 27 September the measured flux was much lower (3.77×1024molec s−1) if ECMWF wind data are used, but of comparable mag-nitude (2.4×1025molec s−1) if the aircraft on-board wind measurements are utilised. Official emission data was 2.07×1025molec s−1 indicating only a small change from the previous day. Over the city of Mantova, the ob-served SO2 vertical columns were 1.1×10¹⁶molec cm−2
and 1.9×10¹⁶molec cm−2on 26 and 27 September, respec-tively. This is in good agreement with ground-based mea-surements of 5.9 ppbv and 10.0 ppbv which correspond to 1.2×10¹⁶molec cm−2 and 2.2×10¹⁶molec cm−2 if a well
mixed boundary layer of 500 m altitude is assumed.
1 Introduction
Sulphur Dioxide, SO2is directly emitted into the atmosphere
by volcanoes and also produced by the oxidation of sulphur containing gases in the atmosphere. The main anthropogenic sources of SO2 are combustion of fossil fuels, for example
Correspondence to: P. Wang
in electric power plants, refinery emissions, and to a lesser degree biomass burning. In the absence of clouds, SO2 is
converted to H2SO4 through homogeneous gas-phase
reac-tions initiated by the hydroxyl radical. Generally only a mi-nority of SO2is oxidized in air, the rest is removed by dry
deposition. In the presence of clouds a fraction of the SO2is
dissolved into cloud droplets and oxidized to sulphate ions, SO2−4 , by trace amounts of oxidizing agents such as hydro-gen peroxide H2O2, and O3that are present in the airborne
droplets. Eventually it is removed by wet deposition (Wayne, 1991).
SO2itself is a respiratory irritant, the effect appearing at
concentrations above 1 ppm (Wayne, 1991). SO2is oxidized
to H2SO4 and contributes to acid rain. It increases acidity
in the aquatic ecosystem and is harmful for soil and vegeta-tion. SO2inhibits photosynthesis in plants and reduces plant
growth.
SO2concentrations are routinely measured by air quality
monitoring networks, such as ARPAV and the Lombardia air quality network (http://www.arpa.veneto.it/indice.htm; http://www.ambiente.regione.lombardia.it/webqa/
QualitAmbiente.htm) for the area treated in this study. In-situ measurements of SO2 were also part of many
airborne campaign measurements (e.g. Tscherwenka et al., 1998; Svensson and Klemm, 1998; Thornton et al., 2002; Tu et al., 2003). Remote sensing measurements of SO2 from
space have been performed using TOMS (Krueger et al., 1995; Carn et al., 2004), GOME (Eisinger and Burrows, 1998; Khokhar et al., 2005), SCIAMACHY (Afe et al., 2004) and AIRS (Carn et al., 2004), but are mainly restricted to volcanic eruptions or large scale pollution. The COSPEC (COrrelation SPECtrometer) technique developed in the late 1960s has also been used to study total emissions of SO2and
NO2from various sources, e.g. industrial emissions (Millan
Fig. 1. AMAXDOAS telescope viewing directions. The flight
di-rection is indicated by the red arrow (90◦). The ten directions are in the same vertical plane.
et al., 1969; Hoff and Millan, 1981) and volcanic plumes (Hoff, 1992) using ground-based remote sensing.
The airborne multi-axis DOAS instrument (AMAX-DOAS) has previously been used on board the high flying aircraft DLR-Falcon in campaigns dedicated to the validation of the SCIAMACHY instrument on ENVISAT (Bovensmann et al., 1999). Several papers have demonstrated its use for measurements of the tropospheric NO2, and the validation of
SCIAMACHY NO2(Heue et al., 2005; Wang et al., 2005;
Fix et al., 2005). The possibility to retrieve vertical pro-files from the measurements has also been reported (Bruns et al., 2004). In summer 2002, the AMAXDOAS instrument was for the first time operated onboard the low flying aircraft Partenavia, to measure HCHO and NO2 abundances in
ur-ban plumes (Pundt et al., 2005a)1. During the second FOR-MAT campaign, the viewing directions were optimized for the measurements of plumes from point sources (Pundt et al., 2005b)2.
In this study we focus on measurements of the SO2 flux
from the power plant Porto Tolle and the SO2
concentra-tion at the city of Mantova, both located in northern Italy. The measurements were performed using the AMAXDOAS instrument onboard the aircraft Partenavia in the Po-valley, northern Italy in September 2003. For the power plant plume, the SO2emission rate was derived and compared with
offi-cial emission data. For the city of Mantova, the SO2vertical
columns were determined and compared with ground-based in situ measurements.
1Pundt, I., Heue, K.-P., Wang, P., Richter, A., Friedeburg, C. V.,
Bruns, M., Laepple, T., Wagner, T., Burrows, J. P., and Platt, U.: Airborne Multi-Axis-DOAS measurements of formaldehyde of the photochemical plume of Milan city, paper in preparation, 2005.
2Pundt, I., Heue, K.-P., Song, B.-C., Richter, A., Wang, P.,
Bruns, M., Platt, U., Burrows, J. P., and Wagner, T.: Airborne To-mographic Measurements of NO2Plumes from Point sources using the AMAX DOAS instrument, paper in preparation, 2005.
2 AMAXDOAS setup during the second FORMAT campaign
The AMAXDOAS instrument consists of two grating spec-trometers, one operating in the UV between 300–440 nm, the other covering the visible part of the spectrum (400–550 nm). Quartz fibre bundles are used to collect scattered sun-light from two sets of telescopes outside of the aircraft, one on the top and one on the bottom (Wagner et al., 2001). Mea-surements are performed in ten viewing directions, where the zenith direction is denoted as 180◦, the nadir direction is 0◦, and the flight direction 90◦. The viewing directions are shown in Fig. 1. The signals from the ten directions are de-tected simultaneously with CCD imaging detectors. During measurements the CCD detectors are cooled down to −30◦C and the spectrometers are thermally stabilized at about 40◦C to prevent wavelength drifts during the flight. The UV spec-tra images were recorded with 10 s integration time, and dark current and line lamp calibration measurements were per-formed after the flight. In order to improve the signal to noise ratio, the measured spectra were averaged over 1 min inter-vals before further analysis, resulting in a horizontal resolu-tion of about 3.7 km.
3 Data analysis
3.1 SO2slant column
The data analysis is based on the Differential Optical Ab-sorption Spectroscopy (DOAS) method (Platt, 1994). For the SO2fit, the spectral window of 316.5–325.5 nm was selected.
Two O3cross sections at 293 K and 221 K, respectively
(Bur-rows et al., 1999), an NO2cross section at 293 K (Burrows
et al., 1998), the SO2cross section at 295 K (Vandaele et al.,
1994), the HCHO cross section (Meller and Moortgat, 2000) and a ring spectrum (Vountas et al., 1998) were included in the fit. The spectral resolution of the AMAXDOAS UV spec-trometer is about 0.8 nm, and all the cross sections used were convolved with the AMAXDOAS slit function prior to the fit. For each measurement direction, a background spectrum taken in the same viewing direction during the same flight was used. The background spectra were chosen to be close to the SO2plume to minimise the effect of potential
instru-mental changes but in a region where low SO2is expected.
The result of the DOAS analysis is the differential slant col-umn, which is the slant column relative to the background spectrum. With our background spectrum criteria, the differ-ential slant column is actually the SO2slant column of the
plume.
3.2 Airmass factor calculation
The slant columns retrieved with the DOAS method have to be converted to vertical columns, usually by dividing through appropriate air mass factors (AMF). The AMF is defined as
P. Wang et al.: AMAXDOAS SO2plumes measurements 331
the ratio of the slant column and the vertical column of the absorber. In this study, AMFs were calculated with the ra-diative transfer model SCIATRAN 2.0 full spherical version (Rozanov et al., 2001) for all viewing directions at flight al-titude (600 m). One important factor in air mass factor cal-culations is the aerosol loading. As the power plant Porto Tolle is located near the coast, and as trajectory analysis with the TRAJKS model (Stohl et al., 2001) indicate that the air masses on 26 and 27 September came from the sea, a mar-itime aerosol is assumed. In contrast, the aerosol type near the city Mantova was assumed to be urban. The aerosol opti-cal depth used in the radiative transfer model was set to about 0.35 (at 550 nm) which is similar to the aerosol optical thick-ness given by MODIS data on that day (Kaufman and Tanre, 1998). Within the plume from the power plant, aerosol con-centrations are expected to be enhanced. However, the O4
slant columns which can be used as an indicator of light path (Wang et al., 2005) do not show significant variation when crossing the SO2 plume, and therefore we assume that the
effect of aerosol on the measurements is similar inside and outside of the plume. Throughout the measurements, the sky was cloud free, and therefore no clouds were included in the radiative transfer calculations. The surface albedo was set to 0.02 at 320 nm, the central wavelength of the SO2fitting
win-dow. Using these settings, air mass factors were calculated for solar zenith angles between 40◦to 75◦with 5◦intervals at 320 nm.
During the measurements, two kinds of emission plumes of SO2were sampled, one from a power plant, and one from
a city. Therefore, two sets of AMFs were calculated with dif-ferent types of SO2profiles. To calculate the SO2AMFs for
the city, the profile was assumed to be well mixed between 0 and 500 m. This choice is based on the fact that no significant SO2slant column increase was observed above flight altitude
as discussed in Sect. 4.1. The AMFs for the plume near the power plant were calculated with a well-mixed SO2profile
in the boundary layer. The boundary layer height at Porto Tolle was about 1.0 km at 10.5 UT on 26 and 27 September according to ECMWF data.
3.3 SO2flux calculation
To calculate the emission flux from the power plant Porto Tolle, a simple formula based on the integrated amount of SO2in the transect measured from the aircraft and the wind
speed perpendicular to the flight direction can be used:
F lux = vaircraftvwind sin θ
Z t2
t1
V C(t ) dt , (1)
where vaircraftis the velocity of the aircraft, vwindis the wind
speed, θ is the angle between the wind direction and the flight direction, VC is the SO2vertical column and t1...t2is the time
interval flown in the plume (White et al., 1976; Trainer et al., 1995; Melamed et al., 2003). Since there were no clouds and humidity was low (relative humidity about 60%), the SO2
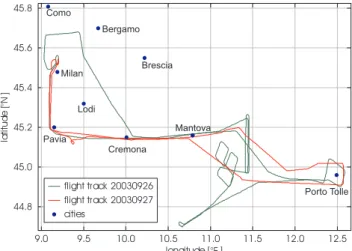
Fig. 2. AMAXDOAS flight tracks on 26 and 27 September 2003.
emitted from the power plant was probably not converted to H2SO4or removed by deposition very fast. If both the wind
direction and wind speed are constant throughout the bound-ary layer, the measurement should give a good approxima-tion of the emission flux from the power plant. If wind speed and direction vary with altitude, the flux can still be calcu-lated if the SO2is assumed to be well mixed by adding partial
fluxes for the individual layers:
F lux = Z t2 t1 vaircraft X i vwindi sin θi V Ci(t )dt , (2)
where V Ci is the partial SO2vertical column in layer i. In
this study, the wind speed and direction were taken from ei-ther the measurements taken on board the aircraft in flight al-titude or ECMWF re-analyis 0.5×0.5◦data at 45◦N, 12.5◦E,
which is very close to the power plant ( at 44.95◦N, 12.5◦E).
4 Results and discussion
4.1 Enhanced SO2slant columns at Porto Tolle and
Man-tova
On 26 and 27 September 2003 the flight started from Milan to the south, lead over Pavia, turned to the east, over Cremona and Mantova, then turned around the power plant Porto Tolle, and back to Milan. To measure the plume from the power plant, the aircraft flew around the stacks with a roughly 3 km radius as illustrated in Fig. 2. The flight routes taken on the two days around the power plant Porto Tolle are almost the same. On 26 September on the way back from Porto Tolle the aircraft also flew around another power plant at Sermide and Ostiglia (close to 45.0◦N, 11.2◦E), and did a compar-ison flight with the Ultralight aircraft(Junkermann, 2005) at 45.0–45.2◦N, 11.45◦E. The flight altitude was mainly about 600 m except for the intercomparison flight where it was at
-0.0015 -0.0010 -0.0005 0 0.0005 0.0010 0.0015 316 318 320 322 324 326 SO2 Reference SO2 Fit+residual Wavelength [nm]
Differential Optical Depth
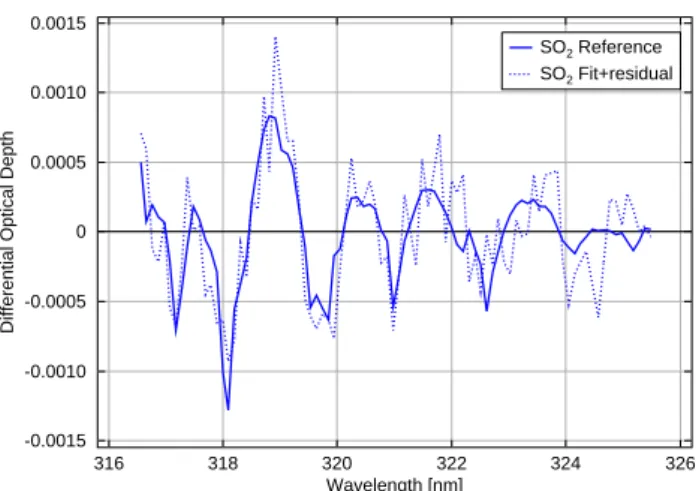
Fig. 3. An example of a SO2fit, on measurements close to Porto
Tolle at 10:24 UT on 27 September. The solid line is the scaled laboratory reference, the dotted line is the result of the fit after sub-traction of all other absorbers and the polynomial.
about 1.8 km. The flight started at 09:00 UT on 26 Septem-ber, and at 08:55 UT on 27 September.
Enhanced SO2values were clearly identified both at Porto
Tolle and Mantova. An example of the DOAS fit is shown in Fig. 3. That measurement was in zenith viewing direc-tion, near the power plant Porto Tolle at 10:24 UT on 27 September, at a solar zenith angle of 47.26◦. The back-ground spectrum used was measured at 44.94◦N, 11.36◦E, which is about 90 km west of Porto Tolle. The error of the fit was about 12%. The background spectrum for 26 September was measured at 45.04◦N, 12.40◦E, the upwind direction of
Porto Tolle power plant. For the analysis the assumption is made, that the background spectra contain no SO2
absorp-tion signature. The SO2slant columns were measured in 10
viewing directions. Three representative viewing directions are shown in Fig. 4. On 26 September, three SO2 plumes
were measured at about 9.6 (09:36) UT, 9.9 (09:54) UT, 10.6 (10:36) UT near the city Cremona, Mantova, and the power plant Porto Tolle, respectively. On 27 September the same plumes were measured at about 9.3 (09:18) UT, 9.6 (09:36) UT and 10.4 (10:24) UT. The SO2 plume from the
power plant was observed both in the upward and downward viewing directions. In contrast, the plumes of the cities of Cremona and Mantova were only detected in the downward viewing directions. At Porto Tolle, the SO2 slant columns
of the zenith viewing direction were similar on the two days. The SO2 slant columns in the 97◦ and 83◦ viewing
direc-tion were larger than that in the zenith viewing direcdirec-tion due to the enhanced optical path. Over Mantova the SO2 slant
columns measured on 27 September are about two times that of 26 September. The SO2plume over Cremona is smaller
than the other two plumes. From the SO2time series it is
also obvious that the slant columns have relatively large vari-ations outside of the plumes, which makes it difficult to
de-tect small SO2 plumes. On the way back from Porto Tolle,
on 26 September the flight didn’t cross Cremona, and on 27 September the flight did not cover Mantova.
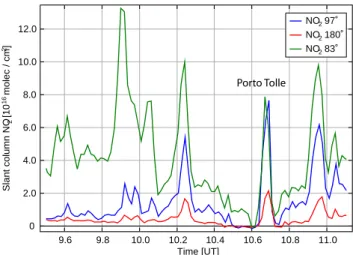
The NO2slant columns in the three viewing directions on
26 September are shown in Fig. 5 for comparison. The fitting window selected for the NO2retrieval is 345–380 nm, which
does not overlap the SO2fitting window. Power plant
emis-sions of SO2and NOxare highly correlated and the
differ-ence in lifetime between NO2and SO2is not relevant close
to the stack. As NO2measurements have much higher
ac-curacies, the error in the NO2 slant column fit being about
2% within the plumes, they can be used to test the consis-tency of the SO2measurements. Several different NO2
emis-sions contribute to the NO2signal and it is difficult to
iden-tify individual sources. However, the NO2 plume from the
power plant Porto Tolle can clearly be seen at about 10.6 (10:36) UT. As in the case of SO2, the NO2plume from the
power plant is also detected in all viewing directions. The 97◦ viewing direction has a similar amount of NO2 as the
83◦viewing direction. The similarity of the NO2and SO2
measurements adds confidence to the SO2measurement.
4.2 SO2emission flux at power plant Porto Tolle
The AMAXDOAS measurements show enhanced SO2close
to the Porto Tolle power plant. To calculate the emission flux from these measurements, it has to be assured that the plume from the power plant was fully sampled, and the measured slant columns have to be converted to vertical columns to derive the total amount of SO2in the plume transect. For the
conversion of slant to vertical columns, an assumption has to be made on the vertical distribution of the SO2. For this,
both the AMAXDOAS measurements themselves and in-situ surface measurements were used.
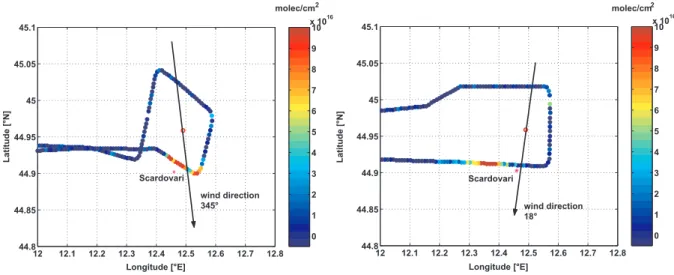
In Fig. 6 SO2slant columns (97◦ viewing direction) are
shown around the power plant along the flight track. As can be seen, the location of the SO2 plume was to the south of
the power plant as expected from the wind direction. On 26 September the wind speed at 10:28 UT (at 44.92◦N, 12.28◦E) was about 4.5(±2) m/s and the wind direction 345◦(±30◦) (north is 0◦). On 27 September the wind speed at 10:28 UT (at 44.92◦N, 12.11◦E) was also about 4.5(±2) m/s, however, the direction was 18◦(±30◦). Both wind speed and direction were measured on the aircraft dur-ing flight. The position of the observed plume is in good agreement with the wind direction on 26 September. The plume was displaced to the west relative to the wind direc-tion on 27 September, indicating a change in wind direcdirec-tion or a large uncertainty in the wind direction measured on the aircraft. According to the ECMWF vertical wind profile on 26 September at 45.0◦N, 12.5◦E, the wind speed at 550 m, which is close to the flight altitude, was 3.7 m/s, with a di-rection of 30◦, comparable to the wind measurements on the aircraft. The wind direction and speed were also stable with altitude, see Fig. 11. On 27 September the wind profile was
P. Wang et al.: AMAXDOAS SO2plumes measurements 333
Mantova
Porto Tolle Porto Tolle
Mantova
Fig. 4. SO2slant columns measured by AMAXDOAS on 26 September 2003 (left) and 27 September 2003 (right) for the flight from
Cremona to Mantova, to the Porto Tolle power plant and back to the airport Reggio nell’ Emiglia (44.70◦N, 10.67◦E).
chosen at the same time and location from the ECWMF data, yielding a wind speed of 0.9 m/s and a direction of 264◦. These values are clearly very different from those measured on the aircraft. According to the trajectory on 27 September, the wind was very weak and turning around 45◦N, 12.5◦E. Both wind speed and direction varied strongly in the hori-zontal and vertical direction. As a result, measurement con-ditions were not favourable for determination of the SO2flux.
The Electric Energy Board (ENEL) operates one central meteorology station at the center of the Porto Tolle power plant and eight air quality measurement stations around the power plant, the one closest to our flight track being at Scar-dovari (44.9◦N, 12.46◦E), at the south of the power plant,
see Fig. 6. As shown in Fig. 7, the SO2concentration at
Scar-dovari showed a large peak between 10:00 and 15:00 UT on 26 September. The station is located downwind of the power plant (the surface wind direction was from north to south measured at the central meteorological station), almost at the centre of the plume, according to the AMAXDOAS measure-ments. The very large concentrations observed at the sta-tion during the AMAXDOAS overpass show that the plume reached the surface and indicate that the boundary layer was probably well mixed. On 27 September, the SO2
concentra-tion at Scardovari did not vary significantly during the day, also in agreement with the AMAXDOAS measurements that show no indication for enhanced SO2 close to the station.
On 27 September, the Scardovari station did not sample the plume because the surface wind direction was from west to east before 10:00 UT and then turned to east to west, the wind speed being low throughout the day, which also indi-cated that on 27 September the wind had large variation in that area.
The SO2of the power plant Porto Tolle is emitted from a
stack of 250 m altitude at a temperature of about 130◦C (http: //www.gruppoverdier.it/documenti.php). Thus, the plume can easily be transported to higher altitudes and in fact could
0 2.0 4.0 6.0 8.0 10.0 12.0 9.6 9.8 10.0 10.2 10.4 10.6 10.8 11.0 NO2 97˚ NO2 180˚ NO2 83˚ Time [UT] Slant column NO 2 [10 16 molec / cm 2] Porto Tolle
Fig. 5. AMAXDOAS NO2slant columns measured on 26 Septem-ber 2003. The part of the flight shown is from Cremona to Man-tova to the Porto Tolle and back to the airport Reggio nell’ Emiglia (44.70◦N, 10.67◦E).
be measured in all AMAXDOAS viewing directions. At noon the turbulence in the boundary layer is usually strong, and the SO2could be well mixed in the boundary layer a few
kilometres downwind of the stack. The measurements of the SO2peak were made at distances of about 5 km (26
Septem-ber) and 11 km (27 SeptemSeptem-ber) from the stack, and therefore the SO2profile was assumed to be well-mixed below 1 km,
the height of the boundary layer.
The SO2vertical columns for the power plant plume are
calculated from the zenith viewing direction, as this mea-surement has a high signal to noise ratio and is insensitive to the relative azimuth angle of the sun. The SO2AMF in
zenith viewing direction is about 0.73 for the power plant plume using the assumptions described above. Thus, the SO2vertical column maximum near the power plant is about
Fig. 6. SO2slant columns measured around the Porto Tolle power plant (red circle) in the 97◦viewing direction along the flight track on 26
September, (left) and 27 September 2003 (right). The wind directions were measured on the aircraft. Also indicated is the closest ENEL air quality measurement station at Scardovari.
0 5 10 15 20 0 10 20 30 40 50 Time [UT] SO 2 Concentration [ µ g/m 3 ] Sep. 26 Sep. 27
Fig. 7. Hourly averaged SO2concentration measured at the ENEL
surface station Scardovari on 26 and 27 September, 2003.
6×10¹⁶ molec cm−2. The SO
2 vertical columns measured
on both days near the Porto Tolle power plant are shown in Fig. 8.
The AMAXDOAS SO2vertical columns are in agreement
with the ENEL in situ measurements at Scardovari. The in situ SO2 concentration at 10:50 UT was about 27 µg m−3
or 10.3 ppbv (parts per billion volume mixing ratio) on 26 September. Converting the mixing ratio to a vertical column with the assumption of a well-mixed profile from the surface up to 1.0 km yields 2.5×10¹⁶molec cm−2. Since the ground-based measurement was locate downwind of the flight track, a smaller value than in the maximum of the SO2plume is to
be expected. 10.0 10.2 10.4 10.6 10.8 11.0 Time [UT] 0 2 4 6 Vertical column SO 2 [10 16 molec/cm 2] SO2 VC 0926 SO2 VC 0927
Fig. 8. SO2vertical columns measured by AMAXDOAS around
the Porto Tolle power plant on 26 and 27 September 2003. These vertical columns are derived from zenith viewing direction.
Using formula (1), the SO2emission flux from the Porto
Tolle power plant can be calculated from the measurements. The time needed to cross the plume was about 6 minutes at a flight speed of 230 km h−1. Using only the aircraft
mea-surements and assuming homogeneous wind speed and di-rection, the SO2flux is determined to 2.36×1025molec s−1
on 26 September and 2.4×1025molec s−1on 27 September. If the ECMWF wind profile at 45◦N, 12.5◦E is used ac-cording to formula (2), the SO2flux is 1.93×1025molec s−1
on 26 September and 3.77×1024 molec s−1on 27 Septem-ber. Hourly averaged SO2emission data are also measured
by the power plant Porto Tolle. The SO2 concentration of
P. Wang et al.: AMAXDOAS SO2plumes measurements 335
Table 1. SO2emission of the Porte Tolle power plant and surface concentrations inside the plume derived from the AMAXDOAS
mea-surements in comparison with the data measured by the ENEL (* on 27 September the ground station was located outside the emission plume).
Date AMAXDOAS near
Scar-dovadi ground station (1016molec cm−2)
Insitu Data Scar-dovadi ground station (1016molec cm−2)
AMAXDOAS Porto
Tolle emission rate (1025molec s−1)
Insitu Data Porto Tolle emission rate (1025molec s−1) 26 September 6.0 (±0.7) 2.5 2.36 ±1.2, 1.93 (ECMWF wind) 2.25 27 September – 1 2.4 ±1.2, 0.377 (ECMWF wind) 2.07
11:00 UT on both 26 and 27 September. As there were no measurements for unit 4 on 26 and 27 September, the aver-aged concentration between 11 September and 16 November was used, which was 317 mg Nm−3. The SO2
concentra-tion and power output were very stable with variaconcentra-tions being smaller than 1% during the day. The gas flow for each of the power units is calculated from the output power, the burned fuel and its efficiency. The SO2emission flux is calculated
from the gas flow and the SO2concentration. The resulting
SO2emission flux is 2.25×1025molec s−1on 26 September
and 2.07×1025molec s−1on 27 September.
Uncertainties in the SO2 emission flux derived from
AMAXDOAS measurements are introduced by the uncer-tainty of the SO2vertical columns, the wind speed, wind
di-rection, aircraft speed and the time needed to cross the plume. In this case study, the error is dominated by the uncertainty of wind speed and direction. The error bars on the wind speed are 30% for the aircraft measurements and 10% for ECMWF data. However, due to the coarse resolution of the model (0.5x0.5 degree), the wind profile used is not necessar-ily representative for the plume. In spite of the large error on the wind speed, the fluxes determined using the in-situ wind speed are in good agreement with power plant emission data for both days. In contrast, the analysis using ECMWF data results in a comparable value for 26 September, but a much lower values on 27 in spite of the very similar SO2 vertical
columns measured. This is probably the result of the unsta-ble wind situation on 27 September which is reflected in the spatial and temporal variability of the ECMWF data and also the differences between the wind speed measured on the air-craft and at the station Scardovari. In summary, the situation on 27 September was not well suited for flux measurements with the AMAXDOAS. Another error source of the method are the variations of up to 5×10¹⁵ molec cm−2 SO
2 in the
background measurements, which is about 12% of the slant column. The SO2calculated here is the SO2in the plumes
relative to the background. If there is any SO2 present in
area where the background spectrum was taken, the AMAX-DOAS measured SO2will be too small. The fit error in the
SO2 slant column was between 12–50% depending on the
SO2 signal. The SO2 emission flux derived from
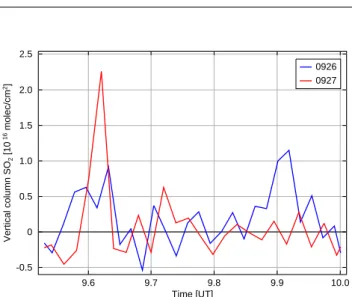
AMAX--0.5 0 0.5 1.0 1.5 2.0 2.5 9.6 9.7 9.8 9.9 10.0 0926 0927 Time [UT] Vertical column SO 2 [10 16 molec/cm 2]
Fig. 9. SO2vertical columns measured over Mantova on 26 and 27 September 2003. The peaks at 9.9 UT on 26 September and 9.6 UT 27 September were located over Mantova. The peak at 9.6 UT on 26 September was close to Cremona. The vertical columns plotted here are derived from the 75◦viewing direction.
DOAS and the power plant measurements are summarized in Table 1.
4.3 SO2plumes over the city of Mantova
Enhanced SO2 over Mantova could only be observed in
the downward viewing directions, indicating that the source of the SO2 is close to the surface. At least, no SO2 had
been transported above 600 m, the flight altitude, within the AMAXDOAS detection limit of about 1×10¹⁶molec cm−2.
Judging from the AMAXDOAS weighting functions for the SO2measurements in the zenith and 97◦viewing directions,
the lack of SO2signal in the upwards viewing directions
indi-cates that the plume was lower than 500 m. Accordingly, the AMFs were calculated with a profile where SO2is located
only in the lowest 500 m.
The SO2vertical columns measured over the city of
Man-tova are shown in Fig. 9 based on the measurements from the 75◦ viewing direction as it provides the best signal to
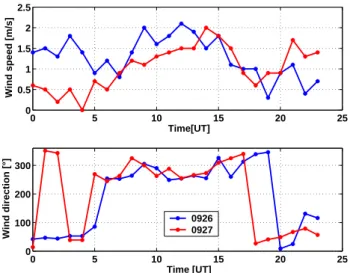
0 5 10 15 20 25 0 0.5 1 1.5 2 2.5 Time[UT] Wind speed [m/s] 0 5 10 15 20 25 0 100 200 300 Time [UT] Wind direction [°] 0926 0927
Fig. 10. Wind speed and direction at Mantova (station No. 542)
on 26 and 27 September 2003 (data from http://www.ambiente. regione.lombardia.it/webqa/QualitAmbiente.htm).
noise. The peaks at 9.9 (09:54) UT on 26 September and 9.6 (09:36) UT 27 September are signals from the SO2
pollu-tion at Mantova. The peak at 9.6 (09:36) UT on 26 Septem-ber was close to the city of Cremona. The SO2 vertical
columns measured on 27 September are twice as large as those observed on 26 September. The wind directions on 26 and 27 September were similar (south-westerly), but on 26 September the wind speed was much larger than on 27 September before 10:00 UT, see Fig. 10. Low wind veloc-ities usually contribute to the accumulation of SO2 which
probably is the reason or the larger values measured on 27 September. Compared to the SO2 amount at Porto Tolle
power plant, the SO2 over Mantova is much less, and the
error in the SO2 slant column is between 13–30%. The
closest in-situ station along the flight track at Mantova is the station at 10.82◦E, 45.16◦N (No. 542). The hourly
averaged SO2 concentration measured at this station
be-tween 10:00 and 11:00 UT on 26 September was 5.9 ppbv and 10.0 ppbv on 27 September (http://www.ambiente. regione.lombardia.it/webqa/QualitAmbiente.htm). Assum-ing that the SO2 is well mixed below 500 m, this
cor-responds to vertical columns of 1.09×10¹⁶ molec cm−2 and 1.85×10¹⁶ molec cm−2, respectively. The AMAX-DOAS measurements are 1.2×10¹⁶ molec cm−2 and 2.2×10¹⁶molec cm−2, which is in very good agreement with the in situ measurement.
5 Conclusions
In this study, the first airborne multi-axis DOAS measure-ments of SO2 pollution are reported. The measurements
were performed as part of the second FORMAT campaign in September 2003 in the Po valley, Italy, and covered both a
0 200 400 600 800 1000 -4 -2 0 2 4 0926 u 0926 v 0926 total 0927 u 0927 v 0927 total Wind speed [m/s] Altitude[m]
Fig. 11. ECMWF wind profile at 45.0◦N, 12.5◦E at 10.5 UT on 26 and 27 September 2003. The u, v components of wind speed and total wind speed are shown.
power plant (Porto Tolle) and two cities (Mantova and Cre-mona).
At the power plant Porto Tolle, both SO2and NO2were
detected in all viewing directions at a cruising altitude of 600 m, indicating that the plume was transported above the flight altitude and probably well mixed in the bound-ary layer. The SO2 had also reached the ground
accord-ing to surface in-situ measurements which reported high SO2 concentrations. In contrast, SO2 enhancement over
the city of Mantova was detected in the downwards view-ing directions only, so that the plume was assumed to be located below 500 m. Using these mixing heights, SO2
vertical columns were derived from the AMAXDOAS mea-surements. The values over Mantova were compared to in-situ measurements, and good agreement was found on both days, highlighting the sensitivity of the measurements. For the Porte Tolle power plant, the AMAXDOAS data were used to derive estimates of the power plant emissions us-ing two different approaches. The simple method assum-ing constant wind speed and direction throughout the bound-ary layer resulted in 2.4±1.2×1025 molec s−1 on 26 and 2.36±1.2×1025molec s−1on 27 September. When vertical wind profiles from ECMWF data were used, a SO2emission
of 1.93×1025 molec s−1was derived for 26 September and 3.37×1024molec s−1for the next day. While the values from the first method are in good agreement with the official emis-sion data of 2.25×1025molec s−1and 2.07×1025molec s−1 for 26 and 27 September, respectively, the second approach yields much lower values for the second day. This is prob-ably the result of the low wind speeds and high spatial vari-ability on 27 September making it unfavourable for airborne flux measurement.
Compared to the in-situ measurements, the advantage of the airborne measurements is that neither the exact vertical position of the plume, nor the distance of the measurement from the stack need to be known to establish the emissions. Also, the measurement can be performed for any wind direc-tion whereas the surface network will only pick up SO2for
P. Wang et al.: AMAXDOAS SO2plumes measurements 337
well mixed plumes passing over the measurement site. How-ever the airborne measurement requires stable wind condi-tion during measurements, complex wind condicondi-tion will lead to large uncertainty of the measurements.
The errors of the estimated emission flux are relatively large, mainly due to uncertainties in wind speed and direction but also as a result of SO2measurement errors in particular
for smaller values. SO2fits could be improved by optimizing
the AMAXDOAS spectrometer which was set-up mainly for HCHO measurements for the UV spectral region used in the SO2retrieval by increasing throughput and spectral
resolu-tion and improving straylight rejecresolu-tion. Emission estimates could be improved in future measurements by using detailed modelling of the vertical wind field and a plume model for the vertical spread of the plume.
Our measurements and the comparison of the results with independent data demonstrate that the AMAXDOAS instru-ment is a very useful tool for air quality monitoring in a large number of applications ranging from urban pollution to point sources.
Acknowledgements. The authors would like to thank G. Vogl, the Partenavia pilot, for his excellent cooperation. W. Knott, G. Hem-mel, and the colleagues from the Avionik company (Straubing), and the company Broken Wings, the members of the Aeroclub Bresso, and the mechanical and electrical workshops of the Universities of Heidelberg and Bremen are gratefully acknowledged for their ex-cellent support for the instrument construction and the help before and during the flight operations.
The MODIS data used in this study were acquired as part of the NASA’s Earth Science Enterprise. The algorithms developed by the MODIS Science Teams. The data were processed by the MODIS Adaptive Processing System (MODAPS) and Goddard Distributed Active Archive Center (DAAC), and are archived and distributed by the DAAC.
The power plant Porto Tolle SO2emission data and the SO2in situ
measurements at Scardovari were provided by Provincia of Rovigo (Italy), Policies for Environment Department.
This study was supported financially by the following: the European Commission, contract number EVK2-CT2001-00120, the German Ministry for Research, Education and Technology (BMBF), through the AFO 2000 Tom-DOAS project, the SCIA-MACHY validation project (contract number 50EE0023 and 50EE0024) from the German Aeorospace Agency (DLR), and the Universities of Bremen and Heidelberg.
Edited by: P. Monks
References
Afe, O. T., Richter, A., Sierk, B., Wittrock, F., and Burrows, J. P.: BrO Emission from Volcanoes - a Survey using GOME and SCIAMACHY Measurements, Geophys. Res. Lett., 31, 24, L24113, doi:10.1029/2004GL020994, 2004.
Bovensmann, H., Burrows, J. P., Buchwitz, M., Frerick, J., Noel, S., Rozanov, V. V., Chance, K., and Goede, A. P. H.: SCIAMACHY:
Mission Objectives and Measurement Modes, J. Atmos. Sci., 56, 2, 127–150, 1999.
Bruns, M., Buehler, S. A., Burrows, J. P., Heue, K.-P., Platt, U., Pundt, I., Richter, A., Rozanov, A., Wagner, T., and Wang, P.: Retrieval of Profile Information from Airborne Multi Axis UV/visible Skylight Absorption Measurements, Appl. Opt., 43, 22, 4415–4426, 2004.
Burrows, J. P., Dehn, A., Deters, B., Himmelmann, S., Richter, A., Voigt, S., and Orphal, J.: Atmospheric remote-sensing refer-ence data from GOME: Part 1. Temperature-dependent absorp-tion cross-secabsorp-tions of NO2in the 231–749 nm range, J. Quant.
Spectrosc. Rad. Transfer, 60, 1025–1031, 1998.
Burrows, J. P., Richter, A., Dehn, A., Deters, B., Himmelmann, S., Voigt, S., and Orphal, J.: Atmospheric Remote-sensing refer-ence data from GOME: Part 2. Temperature-dependent absorp-tion cross-secabsorp-tions of O3 in the 231–794 nm range, J. Quant.
Sepctrosc. Rad. Transfer, 61, 509–517, 1999.
Carn, S. A., Krueger, A. J., Krotkov, N. A., and Gray, M. A.: Fire at Iraqi sulfur plant emits SO2 clouds detected by Earth Probe TOMS, Geophys. Res. Lett., 31, L19105, doi:10.1029/2004GL020719, 2004.
Eisinger, M. and Burrows, J. P.: Tropospheric Sulfur Dioxide ob-served by the ERS-2 GOME Instrument, J. Atmos. Sci., 25, 4177–4180, 1998.
Fix, A., Ehret, G., Flentje, H., Poberaj, G., Gottwald, M., Finken-zeller, H., Bremer, H., Bruns, M., Burrows, J. P., Kleinboehl, A., Kuellmann, H., Kuttippurath, J., Richter, A., Wang, P., Heue, K.-P., Platt, U., Pundt, I., Wagner, T.: SCIAMACHY validation by aircraft remote sensing: design, execution, and first measure-ment results of the SCIA-VALUE mission, Atmos. Chem. Phys., 5, 1273-1289, 2005,
SRef-ID: 1680-7324/acp/2005-5-1273.
Heue, K.-P., Richter, A., Wagner, T., Bruns, M., Burrows, J. P., Friedeburg, C. V., Lee, W.-D., Platt, U., Pundt, I., and Wang, P.: Validation of SCIAMACHY tropospheric NO2-columns with AMAXDOAS measurements, Atmos. Chem. Phys., 5, 1039-1051, 2005,
SRef-ID: 1680-7324/acp/2005-5-1039.
Hoff, R. and Millan, M.: Remote SO2mass flux measurements
us-ing COSPEC, JAPCA, 31, 381–384, 1981.
Hoff, R. M.: Differential SO2Column Measurements of the Mt.
Pinatubo Volcanic Plume, Geophys. Res. Lett., 19, 175–178, 1992.
Junkermann, W.: The actinic UV-radiation budget during the ES-COMPTE campaign 2001: Results of airborne measurements with the microlight research aircraft D-MIFU, Atmos. Res., 74, 1–4, 461–475, 2005.
Kaufman, Y. J. and Tanre, D.: Algorithm for Remote Sensing of Tropospheric Aerosol from MODIS. Products: MOD04 L2, MOD08 D3, MOD08 E3, MOD08 M3, ATBD Reference No. ATBD-MOD-02, 1998.
Khokhar, M. F., Frankenberg, C., Beirle, S., K¨uhl, S., Van Roozen-dael, M., Richter, A., Platt, U., and Wagner, T.: Satellite Obser-vations of Atmospheric SO2from Volcanic Eruptions during the
Time Period of 1996 to 2002, Adv. Space Res., 36(5), 879–887, 10.1016/j.asr.2005.04.114, 2005.
Krueger, A. J., Walter, L. S., Bhartia, P. K., Schnetzler, C. C., Krotkov, N. A., Sprod, I., and Bluth, G. J. S.: Volcanic sulfur dioxide measurements from the total ozone mapping
ter instruments, J. Geophys. Res., 100, D7, 14 057–14 076, 1995. Melamed, M. L., Solomon, S., Daniel, J. S., Langford, A. O., Port-mann, R. W., Ryerson, T. B., Nicks, D. K. Jr., and McKeen, S. A.: Measuring reactive nitrogen emissions from point sources using visible spectroscopy from aircraft, J. Environ. Monit., 5, 29–34, 2003.
Meller, R. and Moortgat, G. K.: Temperature dependence of the ab-sorption cross sections of formaldehyde between 223 and 323 K in the wavelenght range 225–375 nm, J. Geophys. Res., 105, 7089–7101, 2000.
Millan, M., Townsend, S., and Davies, J.: Study of the Barringer refractor plate correlation spectrometer as a remote sensing in-strument, Utias rpt. 146, m.a.sc. thesis, University of Toronto, Toronto, Ontario, Canada, 1969.
Platt, U.: Differential optical absorption spectroscopy (DOAS), in: Air Monitoring by Spectroscopic Techniques, edited by: Sigrist, M. W., Chemical Analysis Series, John Wiley, New York, 127, 27–84, 1994.
Rozanov, A., Rozanov, V., and Burrows, J. P.: A numerical radiative transfer model for a spherical planetary atmosphere: Combined differential-integral approach involving the picard iterative ap-proximation, J. Quant. Spectrosc. Radiat. Transfer 69, 491–512, 2001.
Stohl A., Haimberger, L., Scheele, M.P., and Wernli, H.: An in-tercomparison of results from three trajectory models, Meteorol. Appl., 8, 127–135, 2001.
Svensson, G. and Klemm O.: Aircraft measurements and model simulations of the air quality in Athens, Greece, Atmos. Envi-ron., 32, 12, 2269–2289, 1998.
Thornton, D. C., Bandy, A. R., Tu, F. H., Blomquist, B. W., Mitchell, G. M., Nadler, W. and Lenschow, D. H.: Fast airborne sulfur dioxide measurements by Atmospheric Pressure Ioniza-tion Mass Spectrometry (APIMS), J. Geophys. Res., 107, D22, 4632, doi:10.1029/2002JD002289, 2002.
Trainer, M., Ridley, B. A., Buhr, M. P., Kok, G., Walega, J., H¨ubler, G., Parrish, D. D. and Fehsenfeld, F. C.: Regional ozone and urban plumes in the southeastern United States: Birmingham, a case study, J. Geophys. Res., 100, 818–823, 1995.
Tscherwenka, W., Seibert, P., Kasper, A., and Puxbaum, H.: On-line measurement of sulfur dioxide at the 3 km level over central Europe (Sonnblick, observatory, Austria) and statistical trajec-tory source analysis, Atmos. Environ., 32, 23, 3941–3952, 1998. Tu, F. H., Thornton, D. C., Bandy, A. R., Kim, M.-S., Carmichael, G., Tang, Y., Thornhill, L., and Sachse, G.: Dynamics and trans-port of sulfur dioxide over the Yellow Sea during TRACE-P, J. Geophys. Res., 108, D20, 8790, doi:10.1029/2002JD003227, 2003.
Vandaele, A. C., Simon, P. C., Guilmot, J. M., Carleer, M. and Colin, R.: SO2 Absorption Cross Section measurement in the
UV using a Fourier Transform Spectrometer, J. Geophys. Res., 99, 25 599–25 605, 1994.
Vountas, M., Rozanov, V., and Burrows, J. P.: Ring Effect: Impact of Rotational Raman Scattering on Radiative Transfer in Earth’s Atmosphere, J. Quant. Spectrosc. Radiat. Transfer, 60, 943–961, 1998.
Wagner, T., Bruns, M., Burrows, J. P., et al.: The AMAX-DOAS instrument and its application for SCIAMACHY validation, Pro-ceedings of the 15th ESA Symposium on European Rocket and Balloon Programs and Related Research (ESA SP-471, August 2001), Biarritz, France, 28–31 May, 2001.
Wang, P., Richter, A., Bruns, M., Rozanov, V. V., Burrows, J. P., Heue, K.-P., Wagner, T., Pundt, I., and Platt, U.: Measurements of tropospheric NO2with an airborne multi-axis DOAS
instru-ment, Atmos. Chem. Phys., 5, 337–343, 2005,
SRef-ID: 1680-7324/acp/2005-5-337.
Wayne, R.: Chemistry of Atmospheres, Oxford Science Publica-tions, 1991.
White, W. H., Anderson, J. A., Blumenthal, D. L., Husar, R. B. Gillani, N. V., Husar, J. D., and Wilson Jr., W. E.: Formation and Transport of Secondary Air Pollutants: Ozone and Aerosols in the St. Louis Urban Plume, Science, 194, 187, 1976.