HAL Id: hal-00296410
https://hal.archives-ouvertes.fr/hal-00296410
Submitted on 14 Jan 2008
HAL is a multi-disciplinary open access
archive for the deposit and dissemination of
sci-entific research documents, whether they are
pub-lished or not. The documents may come from
teaching and research institutions in France or
abroad, or from public or private research centers.
L’archive ouverte pluridisciplinaire HAL, est
destinée au dépôt et à la diffusion de documents
scientifiques de niveau recherche, publiés ou non,
émanant des établissements d’enseignement et de
recherche français ou étrangers, des laboratoires
publics ou privés.
PM speciation and sources in Mexico during the
MILAGRO-2006 Campaign
X. Querol, J. Pey, M. C. Minguillón, N. Pérez, A. Alastuey, M. Viana, T.
Moreno, R. M. Bernabé, Stéphane Blanco, B. Cárdenas, et al.
To cite this version:
X. Querol, J. Pey, M. C. Minguillón, N. Pérez, A. Alastuey, et al.. PM speciation and sources in Mexico
during the MILAGRO-2006 Campaign. Atmospheric Chemistry and Physics, European Geosciences
Union, 2008, 8 (1), pp.111-128. �hal-00296410�
www.atmos-chem-phys.net/8/111/2008/ © Author(s) 2008. This work is licensed under a Creative Commons License.
Chemistry
and Physics
PM speciation and sources in Mexico during the MILAGRO-2006
Campaign
X. Querol1, J. Pey1, M. C. Minguill´on1, N. P´erez1, A. Alastuey1, M. Viana1, T. Moreno1, R. M. Bernab´e2, S. Blanco2,
B. C´ardenas2, E. Vega3, G. Sosa3, S. Escalona3, H. Ruiz3, and B. Art´ı˜nano4
1Instituto de Ciencias de la Tierra “Jaume Almera”, CSIC. C/ Llu´ıs Sol´e i Sabar´ıs s/n, 08028 Barcelona, Spain
2Centro Nacional de Investigaci´on y Capacitaci´on Ambiental, CENICA. Perif´erico 5000, Col. Insurgentes Cuicuilco, C.P. 04530, Delegaci´on Coyoac´an, Mexico D.F., Mexico
3Instituto Mexicano del Petr´oleo, Eje Central L´azaro C´ardenas 152, Col. San Bartolo Atepehuacan. Delegaci´on Gustavo A. Madero. 07730, Mexico, D.F, Mexico
4CIEMAT, Avda. Complutense 22, 28040 Madrid, Spain
Received: 5 July 2007 – Published in Atmos. Chem. Phys. Discuss.: 23 July 2007 Revised: 25 September 2007 – Accepted: 5 December 2007 – Published: 14 January 2008
Abstract. Levels of PM10, PM2.5 and PM1 and chemical
speciation of PM10and PM2.5were measured during the MI-LAGRO campaign (1st to 31st March 2006, but extended in some cases until 6th April) at four urban, one suburban, two rural background and two rural sites, with different degree of industrial influence, in the Mexico City Metropolitan Area (MCMA) and adjacent regions. PM10 and PM2.5 daily lev-els varied between 50–56µg/m3and 24–46µg/m3at the ur-ban sites, 22–35µg/m3 and 13–25µg/m3 at the rural sites, and 75µg/m3 and 31µg/m3at the industrial hotspot, lower than those recorded at some Asian mega-cities and similar to those recorded at other Latin American cities. At the ur-ban sites, hourly PM2.5 and PM1 concentrations showed a marked impact of road traffic emissions (at rush hours), with levels of coarse PM remaining elevated during daytime. At the suburban and rural sites different PM daily patterns were registered according to the influence of the pollution plume from MCMA, and also of local soil resuspension.
The speciation studies showed that mineral matter ac-counted for 25–27% of bulk PM10 at the urban sites and a higher proportion (up to 43%) at the suburban and rural sites. This pattern is repeated in PM2.5, with 15% at urban and 28% at suburban and rural sites. Carbonaceous compounds accounted for a significant proportion at the urban and in-dustrial sites (32–46% in PM10, and 51–55% in PM2.5), markedly reduced at the suburban and rural sites (16–23% in PM10, and 30% in PM2.5). The secondary inorganic aerosols accounted for 10–20% of bulk PM10 at urban, suburban, ru-ral and industrial sites, with a higher proportion (40%) at the industrial background site. A relatively high proportion of nitrate in rural sites was present in the coarse fraction.
Correspondence to: Xavier Querol
(xavier.querol@ija.csic.es)
Typically anthropogenic elements (As, Cr, Zn, Cu, Pb, Sn, Sb, Ba, among others) showed considerably high levels at the urban sites; however levels of particulate Hg and crustal trace elements (Rb, Ti, La, Sc, Ga) were generally higher at the suburban site.
Principal component analysis identified three major com-mon factors: crustal, regional background and road traffic. Moreover, some specific factors were obtained for each site.
1 Introduction
During the last few decades a large number of epidemio-logical studies have shown a link between pollution by air-borne particulate matter (PM) and respiratory and cardio-vascular disease (Dockery et al., 1993; K¨unzli et al., 2000; WHO, 2003). Because a lower threshold under which no health effects are observed cannot be determined (WHO, 2003 and 2005), toxicological studies are currently aiming to identify which particle characteristics are responsible for which adverse health effects (e.g., particle number, size, sur-face, chemical composition). Anthropogenically emitted PM is generally considered to pose the largest threat to human health given its small grain-size, although the effects of nat-urally emitted PM (wind-blown dust, sea salt) cannot be dis-carded (CAFE, 2004).
PM air pollution in urban agglomerations comes mostly from anthropogenic sources (i.e. traffic, industrial processes, energy production, domestic and residential emissions, con-struction), but there is also a minor contribution from natural sources (e.g. bioaerosols, soil dust, marine aerosol, volcanic eruptions). Once emitted into the atmosphere, this complex mixture of pollutants may be transformed as a function of the
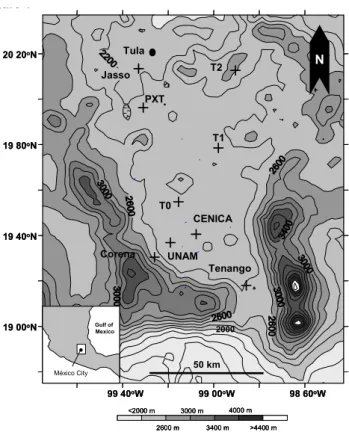
Figure 1 99 40oW 99 00oW 98 60oW 19 00oN 19 40oN 19 80oN 20 20oN T0 T1 T2 Jasso PXT UNAM CENICA Corena Tenango Tula 2000 <2000 m 2600 m 3000 m 3400 m 4000 m >4400 m N 50 km Gulf of Mexico México City Gulf of Mexico México City 99 40oW 99 00oW 98 60oW 19 00oN 19 40oN 19 80oN 20 20oN T0 T1 T2 Jasso PXT UNAM CENICA Corena Tenango Tula 2000 <2000 m 2600 m 3000 m 3400 m 4000 m >4400 m <2000 m 2600 m 3000 m 3400 m 4000 m >4400 m N 50 km Gulf of Mexico México City Gulf of Mexico México City
Fig. 1. Location of the PM monitoring sites in and around Mexico City and the Tula petrochemical estate.
ambient conditions and the interaction among different PM components, as well as gaseous pollutants. The PM system is especially complex in mega-cities due to:
- Large emission volumes of PM components and gaseous precursors.
- High variability of sources.
- Widespread distribution of emission sources.
- Possible long-range transport of the polluted air masses. The WHO/UNEP report on air quality in 1992 focused on 20 mega-cities of the world, which were defined as urban agglomerations with populations of 10 million or more by the year 2000 (WHO/UNEP, 1992). The list of mega-cities included not only Tokyo, Mexico City, Cairo, Bangkok or Beijing, but also Los Angeles, New York and London. Mon-itoring air quality in large urban agglomerations is a press-ing need in order to ensure the health and well bepress-ing of ur-ban residents, but it is also essential if we intend to prevent air pollution-related problems from occurring in emerging mega-cities which may influence both air quality and climate change on the regional, continental and global scales (Molina et al., 2007). Preventing pollution problems before they oc-cur is usually the most cost-effective method for dealing with air pollution.
In order to better understand the evolution of trace gases and particulates originating from anthropogenic emissions in Mexico City and their impact on regional air quality and
climate, a field campaign called the Megacities Initiative: Local And Global Research Observations (MILAGRO, http: //www.eol.ucar.edu/projects/milagro/) collected a wide range of meteorological, chemical, gaseous and particulate mea-surements during March 2006. The design of this campaign was partly based on the results obtained during the MCMA-2003 Campaign (Salcedo et al., 2006; Volkamer et al., 2006; Molina et al., 2007; Zhang et al., 2007), during which ex-ploratory field measurements of ambient aerosols were car-ried out in Mexico City. This campaign helped in defining physical and chemical properties of the aerosols, as well as the dominant meteorological scenarios in this mega-city, on which the current MILAGRO campaign were based. Dur-ing the MILAGRO campaign measurements were obtained over a wide range of spatial scales from local, regional, and large-scale field experiments to describe the evolution of the Mexico City pollutant plume from its source and up to sev-eral hundred kilometers downwind.
The present study deals with the measurements of ambient levels of TSP, PM10, PM2.5and PM1, and the speciation and source apportionment of TSP, PM10and PM2.5in the Mexico City Metropolitan Area (MCMA), by means of an intensive sampling campaign (1st March to 6th April 2006) of mea-surement, sampling and analysis of PM integrated into the 2006 MILAGRO campaign. The main goal of the present study is to interpret the variability of PM levels and compo-sition (including trace metals) in Mexico City, as well as to identify the major emission sources (of PM and trace metals) in the area.
Other studies on PM characterization (some of them with speciation and source identification) done in Mexico city are those published by Miranda et al. (1996 and 2005) and Aldape et al. (2005), Johnson et al. (2006), Salcedo et al. (2006), Stone et al. (2007), Molina et al. (2007), Mof-fett et al. (2007), Yokelson et al. (2007). Furthermore, Mug-ica et al. (2002) reported on levels of trace elements in PM; and Vega et al. (2001) on the chemical characterization of re-suspension source emission profiles.
2 Methodology
2.1 Measurements and sampling
Measurement and sampling of PM were carried out at the following monitoring stations (Table 1 and Fig. 1):
T0.
This monitoring station is located to the northwestern part of the basin of Mexico City. It is an urban background site influ-enced by road traffic fresh emissions (300 m from four ma-jor roads surrounding it), domestic and residential emissions, but also potentially influenced by local industrial emissions and from the Tula industrial area (around 60 km to the north-northwest, in the Hidalgo State). This station was equipped
Table 1. Location of the monitoring stations.
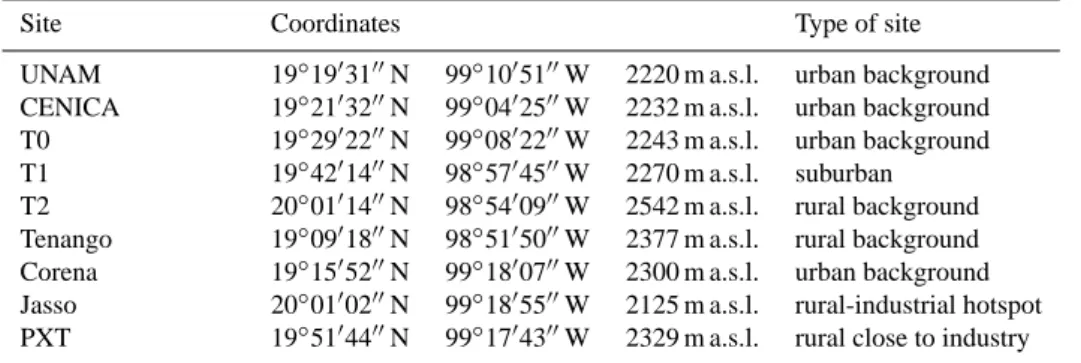
Site Coordinates Type of site
UNAM 19◦19′31′′N 99◦10′51′′W 2220 m a.s.l. urban background CENICA 19◦21′32′′N 99◦04′25′′W 2232 m a.s.l. urban background T0 19◦29′22′′N 99◦08′22′′W 2243 m a.s.l. urban background T1 19◦42′14′′N 98◦57′45′′W 2270 m a.s.l. suburban T2 20◦01′14′′N 98◦54′09′′W 2542 m a.s.l. rural background Tenango 19◦09′18′′N 98◦51′50′′W 2377 m a.s.l. rural background Corena 19◦15′52′′N 99◦18′07′′W 2300 m a.s.l. urban background Jasso 20◦01′02′′N 99◦18′55′′W 2125 m a.s.l. rural-industrial hotspot PXT 19◦51′44′′N 99◦17′43′′W 2329 m a.s.l. rural close to industry
with high volume samplers fitted with cut off inlets for PM10 (Wedding, 68 m3/h) and PM2.5 (MCV, 30 m3/h) from 1st March to 4th April 2006 (n=35, 12 h integrated samples), and 6th to 29th March 2006 (n=24, 12 h integrated samples), re-spectively. This monitoring site was also equipped with a laser spectrometer (GRIMM 1107, US1) for real time mea-surement of hourly levels of PM10, PM2.5 and PM1, from 19th to 30th March 2006.
CENICA.
This is an urban background station, with similar character-istics to T0, but located in the southeastern side of the city of Mexico. This station was equipped with a high volume sam-pler fitted with a cut off inlet for PM10 (Wedding, 68 m3/h) from 1st March to 6th April 2006 (n=38, 12 and 24 h inte-grated samples). This monitoring site was also equipped with a laser spectrometer (GRIMM 1108) for real time measure-ment of hourly levels of TSP, PM10, PM2.5 and PM1, from 8th to 29th March 2006.
UNAM.
This is an urban background station, influenced by road traf-fic and residential emissions, with similar characteristics to T0 and CENICA, but located on the southern side of the city of Mexico. This station was equipped with a high volume sampler and a cut off inlet for PM10(Wedding, 68 m3/h) from 1st to 15th March 2006 (n=7, only 24 h samples).
Jasso (Subestacion) and PXT.
These two rural background sites were located in the vicinity of a heavy industrialized area, the Tula-Vito-Apasco indus-trial corridor, 60 km north-northwest from the Mexico City downtown. Jasso and PXT were 6 km southwest and 25 km south from a large refinery and a power plant (Tula estate), respectively. At the two sites PM10and PM2.5samples were collected by using portable low volume samplers (MiniVol) operating at a flow rate of 0.3 m3/h and previously calibrated under standard conditions. Samples were collected from
00:00 to 24:00 h each day from 24th of March to 20th April 2006, with a total number of samples of n=55 for PM10, and n=55 for PM2.5. Additionally, medium volume sequential filter samplers (SFS) operated at a flow rate of 6.8 m3/h and equipped with PM2.5inlets were used to collect 12-hour sam-ples from 7th to 20th April 2006 (n=56).
T1.
This is a suburban background site located around 50 km to the north of Mexico City, in an area isolated from major ur-ban agglomerations but close to small populated agglomer-ations, and around 500 m from the closest road. The station was equipped with three high volume samplers (Wedding, 68 m3/h) with TSP, PM10and PM2.5cutoff inlets from 1st to 29th March 2006 (n=25, 24 and 23, 12 h integrated samples, respectively).
T2.
This is a rural background site located around 90 km to the north of the city of Mexico, in the surroundings of a farm isolated from major urban agglomerations, and around 2 km from the closest road. The monitoring site was equipped with a Wedding high volume (68 m3/h) sampler with a PM10 cut off inlet from 9th to 17th March 2006 (n=8).
CORENA and TENANGO.
At these urban background and rural background sites, re-spectively, two laser spectrometers (GRIMM 1107) for real time measurements of hourly levels of PM10, PM2.5and PM1 were installed from 1st to 4th April 2006 at CORENA and 28th March to 7th April 2006 at TENANGO.
The main objective of the measurements performed at the urban background sites was the characterization and source apportionment of urban aerosols in MCMA. Elucidation of the origin of particulate mercury in PM10 was of particular interest here. In contrast, the main objective of data col-lection at the rural background site was to investigate the
Figure 2. 99 40oW 99 00oW 98 60oW oN 19 40oN oN 20 20oN N o o o 19 00oN oN 19 80oN oN N o o o oN oN oN oN N o o o oN o oN N N N N N T1 T2 PXT UNAM CENICA CorenaTenango N T0 N Tula N N N N N N Jasso CENICA Corena Tenango N T0 N N N N N N N T1 PXT CENICA Corena Tenango N T0 N Tula N N N N N N Jasso TSP PM10 PM1 PM2.5 100 µg/m3 100 µg/m3 100 µg/m3 100 µg/m3
Gravimetric values Real time values
T1
CENICA
T1
Tula
Fig. 2. Graphical view of the PM (TSP, PM10, PM2.5 and PM1)
concentrations shown in Table 2 superimposed onto Fig. 1 (location map) to allow easier comparison. Real time values (squares) are only used when gravimetric values (circles) were not available.
influence of the emissions from MCMA on the composition of the atmospheric aerosols in the surrounding rural sites.
Samples from T0, T1, T2, UNAM and CENICA obtained with the high volume samplers were collected at all sites on quartz micro-fiber filters (Pallflex for the Wedding in-struments and Schleicher & Schuell for the MCV instru-ments), conditioned for subsequent analysis. High volume samplers were operated one out of every two days along the field campaign. Two 12 h samples were collected every sam-pling day (from 08:00 h to 20:00 h and 20:00 h to 08:00 h lo-cal time), with the exception of UNAM and T2 (24 h sam-ples). Samples from Jasso and PXT sites were collected on 47 mm Teflon-membrane (2µm pore size, Gelman Scientific, Ann Arbor, MI, USA) and quartz-fiber (Pallflex Products Corp., Putnam, CT, USA) filters. Teflon filters were used for mass analyses, trace element analyses and light transmis-sion, whereas quartz filters were used for ion, elemental and organic carbon analyses. Although two different types of quartz filters were used, their quality was checked by each of the research groups in their respective laboratory.
Real time measurements of PM were obtained with two models of laser spectrometers, GRIMM 1107 and 1108. These instruments perform particulate size measurements by
y = 0.8x R2 = 0.9 y = 1.0x R2 = 0.6 y = 1.0x R2 = 0.9 20 40 60 80 100 20 40 60 80 100 T0 PM10 µg/m3 C E N IC A P M10 µ g /m 3 08:00-20:00 20:00-08:00 24 h mean Figure 4.
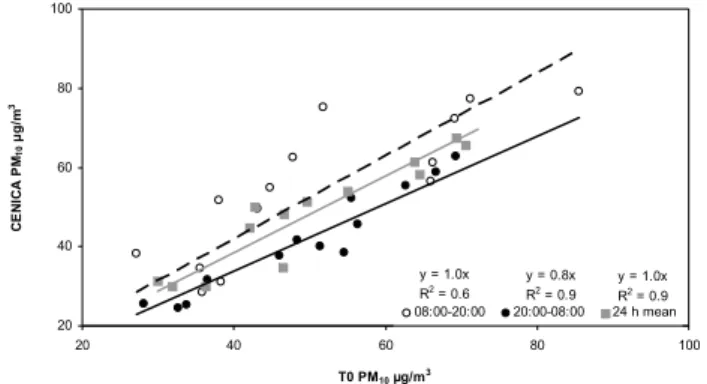
Fig. 3. Comparison of 12 and 24 h PM10 levels simultaneously
measured at T0 and CENICA (two urban background sites), Mexico City, during the MILAGRO campaign.
90-degree laser light scattering. Sampling air (1.2 l/min) passes through a flat laser beam produced by an ultra low maintenance laser diode. A 15-channel (0.3–25µm) pulse height analyzer for size classification detects the scattering signals. These counts from each precisely sized pulse chan-nel are converted to mass using a density equation included in the instrument software. In addition, real time measurements obtained by the optical counter were corrected with the re-gression equations (in all cases R2>0.8) obtained between
the comparison of gravimetric PM levels (aerodynamic di-ameter) determined by the standard high volume gravimetric method, and real time (optical counts) measurements, inde-pendently for PM10and PM2.5fractions. PM1data was cor-rected according to the PM2.5. We have checked at laboratory that in some cases this may result in a slight overestimation of levels of PM1.
2.2 Chemical and microscopy analysis
Samples were conditioned after sampling (50±4% humid-ity and 22±3◦C during 48 h) prior to gravimetric determi-nation of the PM mass were stabilized (carried out in the same controlled chamber as filters). Levels of major and trace elements were determined in bulk sample acidic diges-tions (HF:HClO4:HNO3) by means of Inductively Coupled Atomic Emission Spectroscopy, ICP-AES (IRIS Advantage TJA Solutions, THERMO), and Inductively Coupled Plasma Mass Spectroscopy, ICP-MS (X Series II, THERMO), re-spectively. Levels of particulate mercury were determined by means of a Hg Gold Amalgam Atomic Absorption ana-lyzer (AMA-254, LECO instruments). The content of Cl−,
SO2−4 and NO−3 was determined by means of Ion Chromatog-raphy HPLC (High Pressure Liquid ChromatogChromatog-raphy) using a WATERS IC-pakT Manion column and WATERS 432 con-ductivity detector, and NH+4 was determined by means of a Selective Electrode (MODEL 710 A+, THERMO Orion). Total Carbon was determined by means of a LECO ele-mental analyzer. OC and EC levels were determined on a selected number of samples to determine the ratios OC/EC
0 25 50 75 100 0 2 4 6 8 10 12 14 16 18 20 22
local time (hour)
PM ( µ g /m 3) PM10 PM2.5 PM1 CENICA PM10 PM2.5 PM1 0 25 50 75 100 0 2 4 6 8 10 12 14 16 18 20 22
local time (hour)
PM (µ g /m 3) PM10 PM2.5 PM1 T0 PM10 PM2.5 PM1 0 25 50 75 100 0 2 4 6 8 10 12 14 16 18 20 22
local time (hour)
PM (µ g /m 3) PM10 PM2.5 PM1 CORENA PM10 PM2.5 PM1 0 25 50 75 100 0 2 4 6 8 10 12 14 16 18 20 22
local time (hour)
PM (µ g /m 3) PM10 PM2.5 PM1 TENANGO PM10 PM2.5 PM1
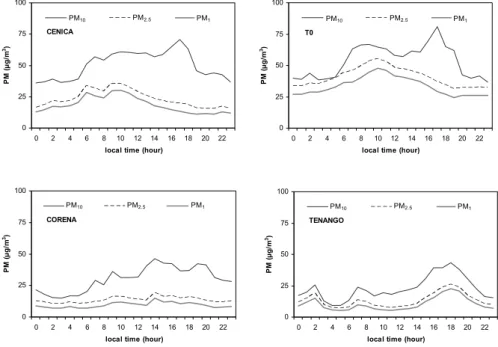
Fig. 4. Mean hourly PM levels measured during the MILAGRO campaign at 2 urban background sites of Mexico City, CENICA and T0, and at two southern sites, Tenango and Corena.
by Thermo-Optical Reflectance (TOR) according to the method described by Fung et al. (2002). Sample treatment and analytical details are described in Querol et al. (2001). Indirect determinations from analytical data were obtained for: a) CO2−3 , determined from Ca content, assuming that this element is mainly present as calcite (CaCO3; CO2−3 = 1.5*Ca); b) SiO2, determined from the Al content on the basis of prior studies in Mexico city (SiO2=2*Al2O3; John-son et al., 2006); c) organic matter, determined as 1.6*OC, based on Turpin and Lim, 2001). Selected samples were also studied under an environmental Scanning Electron Micro-scope (SEM, FEI QUANTA 200), with chemical analyses of individual particles being performed manually on uncoated samples using an energy dispersive X-ray microanalysis sys-tem (EDX). Microscope conditions were working distance of 10 mm, accelerating voltage of 20 kV, a beam spot size num-ber 2 with a beam current of approximately 1.00µA, and a spectrum acquisition time of 30 s live time, with particles be-ing analyzed in its centre. The time under vacuum (130 Pa) before the analysis is about 2–3 min.
2.3 Meteorological data
At T0 site, a 3-D sonic anemometer (Campbell Scientific, model CSAT3) was used to measure horizontal and verti-cal wind components at 1 Hz. Temperature, relative humid-ity and atmospheric pressure were registered using Vaisala HMP-series sensors. All equipments were deployed at 12 m above the ground level. Data was kindly made available for MILAGRO participants by W. Eichinger from the University of Iowa. Figure 5 0 90 180 270 360 0 2 4 6 8 10 12 14 16 18 20 22
local time (hour)
W in d d ir e c ti o n ( º) 0 5 10 15 20 25 30 35 1 0 * W in d s p e e d ( m /s ) T ( ºC )
Wind direction 10*Wind speed T
Fig. 5. Mean hourly temperature, wind direction (vectorial mean) and wind speed recorded at T0 from 1st to 26th March 2006.
3 Atmospheric dynamics
Mexico City is located in an elevated basin, 2240 m above mean sea level (m a.s.l.). Surrounding mountains on the west, south and east reach 1000 m above the basin, and two volca-noes at the southeast reach over 5000 m a.s.l. The basin is opened to the north and southeast, where a small gap be-tween mountains allows entering of cold and fresh air during evenings, cleaning up the basin most of the time. Fast and Zhong (1998) emphasize the importance of vertical mixing and mountain winds in the transport of the Mexico City ur-ban plume first towards the south during the day and then back over the city to the north during nightime. Clear skies, low humidity, and weak winds aloft associated with high-pressure systems are usually observed over Mexico during March (Fast et al., 2007).
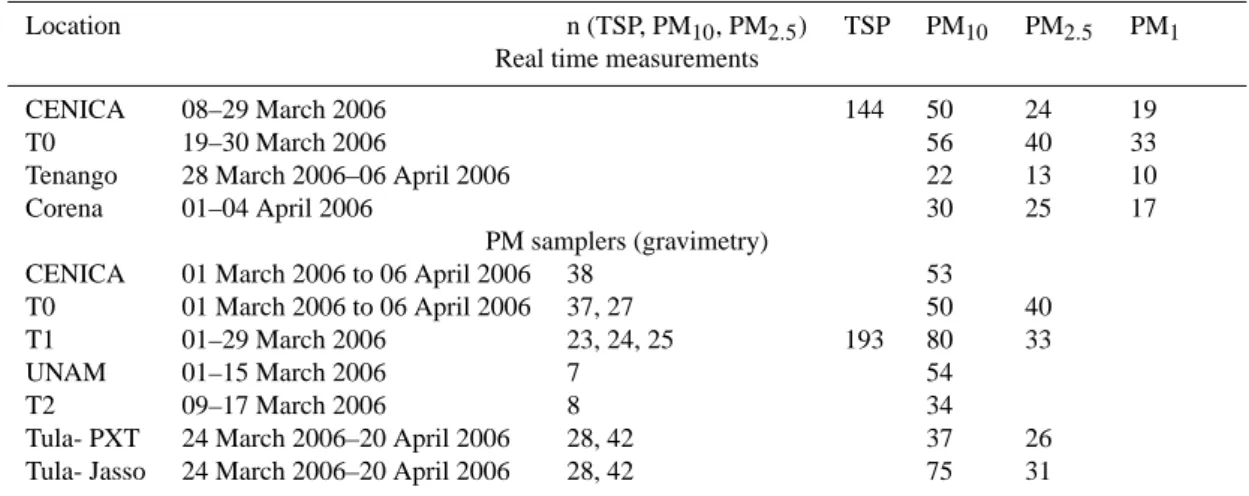
Table 2. Mean TSP, PM10, PM2.5and PM1(µg/m3) levels obtained at the different monitoring stations, for the periods indicated.
Location n (TSP, PM10, PM2.5) TSP PM10 PM2.5 PM1
Real time measurements
CENICA 08–29 March 2006 144 50 24 19
T0 19–30 March 2006 56 40 33
Tenango 28 March 2006–06 April 2006 22 13 10
Corena 01–04 April 2006 30 25 17
PM samplers (gravimetry)
CENICA 01 March 2006 to 06 April 2006 38 53
T0 01 March 2006 to 06 April 2006 37, 27 50 40
T1 01–29 March 2006 23, 24, 25 193 80 33
UNAM 01–15 March 2006 7 54
T2 09–17 March 2006 8 34
Tula- PXT 24 March 2006–20 April 2006 28, 42 37 26
Tula- Jasso 24 March 2006–20 April 2006 28, 42 75 31
Based on MILAGRO field measurements and large-scale analyses Fast et al. (2007) defined three regimes that char-acterized the overall meteorological conditions: before 14th March (mostly sunny and dry conditions), between 14th and 23rd March (increase in humidity and development of late af-ternoon convection), and after 23rd March (higher humidity, afternoon convection, and precipitation). The synoptic con-ditions during March for Mexico City are described in de-tail by Fast et al. (2007), with winds from the north and east during the first week, west then southwest from 9–12th, vari-able from 13–18th, southwest between 19–20th, and finally westerly winds for the rest of the month. Wind speeds at 500 hPa exceeded 15 m/s during 9th–11th March and 19th– 20th March, whereas at 700 hPa they were usually less than 5 m/s.
According to Doran et al. (2007), on 10th, 18th, 19th, 20th, 22nd, and 24th March T1 and T2 were influenced by the Mexico’s emission plume. This type of air mass circula-tion coincides with that reported by Molina et al. (2007) dur-ing episodes of ozone transport towards the northeast from MCMA.
4 Results
4.1 PM levels
Table 2 summarizes the mean TSP, PM10, PM2.5 and PM1 levels measured at the different monitoring stations (also see Fig. 2). Although the measuring periods were not simulta-neous at all the monitoring sites, it is evident that the mean PM10levels measured at the urban background sites of Mex-ico City for the study period fall in a narrow range, from 50 to 56µg/m3, the values from real time and gravimetry be-ing very similar. For PM2.5and PM1a wider range of levels was measured, with 24 to 40 and 19 to 33µg/m3, respec-tively. At the Jasso rural-industrial site PM10levels measured increased up to 75µg/m3, although PM2.5 levels (31µg/m3)
were in the range defined for Mexico City (35µg/m3) (Vega et al., 2004). At the rural sites PXT and T2 PM levels fall within the range 34 to 37µg PM10/m3and 26µg PM2.5/m3. Levels at the suburban site T1 (193, 80 and 33µg/m3 for TSP, PM10and PM2.5) and the Jasso rural-industrial site were markedly higher probably due to intensive local soil dust re-suspension and to the influence of a cement plant and lime-stone quarry at Jasso. It should be noted that at the urban sites, the instrumentation was located on the terrace of build-ings and that coarse PM concentrations (e.g. TSP) at ground level would probably be much higher.
Although the above PM levels may be considered as rel-atively high when compared with the US or European air quality standards, they are markedly lower than PM lev-els measured at Asian mega-cities (or large cities). Thus, as shown in Table 3, most large cities in China and India record annual mean levels of 80–150µg PM10/m3 and 60– 125µg PM2.5/m3. Moreover, data reported by Clean Air Ini-tiatives for Asian cities (2006) show that, with the excep-tion of Tokyo, most Asian mega-cities (>10 million popula-tion) and large cities exceed 80µg PM10/m3 as a mean an-nual average (mean 2005 anan-nual levels in µg PM10/m3: 51 Bangkok; 155 Beijing; 115 Hanoi, 80 Jakarta; 110 Calcutta; 80 Mumbai; 160 New Delhi; 70 Seoul; 100 Shanghai; 35 Tokyo). These levels are up to 3 times higher than those recorded in Mexico City during the MILAGRO campaign, although it must be taken into account that the PM concen-trations presented in this study are not annual means, as it is the case for the Asian cities described above.
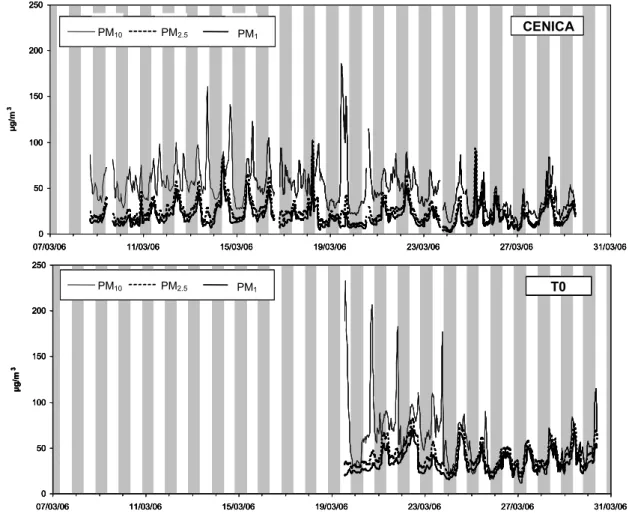
Similar levels of PM10 were measured at the two urban background sites with the largest data coverage (CENICA and T0), with a simultaneous variation in the levels of PM measured at both sites (α=1.0, R2=0.9: see Fig. 3). Daylight 12 h PM10 levels were similar (α=1.0, R2=0.6). The vari-ation of PM10 levels was even better correlated at the two sites during the night (R2=0.9), although 20% higher values (α=0.8) were recorded at T0. The higher night-time values
at T0 could be related to aged pollutant transport towards the north, as described by Fast and Zhong (1998). These results indicate that both stations are indeed representative of urban background PM10climate in Mexico City and that, in agree-ment with results from Molina et al. (2007) for MCMA-2003 campaign, PM10levels varied on a relatively large scale dur-ing the MILAGRO campaign. The lower diurnal correlation of the PM10 levels is probably attributable to the influence of soil resuspension at CENICA. In this context, an impor-tant difference between the relative contributions of coarse and fine PM was detected. PM10 at CENICA had a larger proportion of coarse PM (50% PM2.5−10) whereas at T0 the finer fraction was dominant (only 30% PM2.5−10), probably due to higher traffic exhaust emissions in the vicinity of T0.
At the suburban and rural sites the coarse fraction ac-counted from 30 to 60% of the PM10 mass. This large vari-ation in the relative proportion of fine and coarse fraction is due to a high impact of local soil resuspension at T1 and to resuspension of dust from a nearby cement plant and lime-stone quarry at Jasso. At T1 and Jasso sites, these large resus-pended dust contributions accounted for high levels of PM10 and PM2.5, when compared with the other rural sites (by a factor of 2 to 4). The fraction PM1−2.5 was about 20% of total PM2.5in the urban sites, which is similar to the findings reported by Salcedo et al. (2006).
The hourly evolution of PM levels measured during the entire MILAGRO campaign at the urban background sites of Mexico City, CENICA and T0 (Fig. 4), was most strongly influenced by the peak fine PM concentrations recorded dur-ing the morndur-ing traffic rush hours. This pattern coincides with data from Chow et al. (2002) as well as the report of the monitoring network in Mexico City (RAMA) during April 2004 at the Metropolitan University as reported by Salcedo et al. (2006). The coarse fraction increased also at morn-ing rush hours, remainmorn-ing high and reachmorn-ing the maximum at 16–18 h, followed by a nightly decrease (less urban dust resuspension). The 2 monitoring sites followed the same mean daily pattern, with a very clear afternoon coarse PM peak, probably attributable to the higher wind speed typically recorded at Mexico City during the afternoon in this period of the year (Fig. 5).
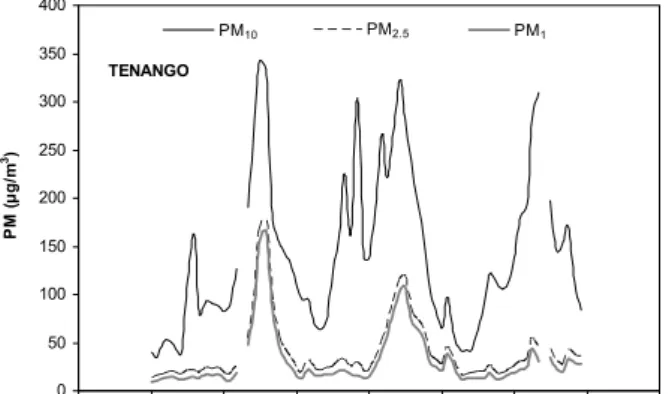
At the two sites located to the South of Mexico City, differ-ent PM daily trends were recorded, with the maximum PM being registered in the afternoon, at 19:00 h at Tenango and at 14:00 h at Corena. This is probably due to the transport of the urban plume from Mexico, which reaches Corena (south) at 14:00 h and Tenango (southeast) at 18:00–19:00 h. Both fine and coarse fractions are affected by this transport. This is supported by the measurements at the rural site Tenango plotted in Fig. 6, showing Mexico City’s plume impact caus-ing high levels of PM1during the period 15:00–21:00 h and much reduced over the rest of the day.
As expected, PM10 levels were at all sites higher (by a factor around 1.3) during daylight, as a consequence of the
0 50 100 150 200 250 300 350 400 03/04/06 12:00 04/04/06 00:00 04/04/06 12:00 05/04/06 00:00 05/04/06 12:00 06/04/06 00:00 06/04/06 12:00 07/04/06 00:00 07/04/06 12:00 PM ( µ g /m 3) PM10 PM2.5 PM1 TENANGO PM10 PM2.5 PM1
Fig. 6. Hourly PM levels measured at the rural site Tenango, show-ing the Mexico City’s plume impact causshow-ing high levels of PM1. higher atmospheric emissions and turbulence. This differ-ence was much reduced in the case of PM2.5.
Concerning the daily evolution of PM levels measured at the two urban background sites, CENICA and T0 (Fig. 7), two definite periods can be clearly identified. The first one lasted from the beginning of the measurements until 23rd March, and was characterized by relatively high levels of PM10 (a mean of 57µg/m3), with a dominant coarse grain size (PM2.5−10and PM1−10loads were 57% and 67% of bulk PM10) due probably to the influence of resuspension of urban dust. The second period started on 23rd March and lasted until the end of the month, and was characterized by lower PM10levels (35µg/m3) and a finer grain size (PM2.5−10and PM1−10loads were 41% and 50% of bulk PM10). This was coincident with the last meteorological period of the field campaign when precipitation was frequent and the resuspen-sion of urban dust diminished. This wet period also influ-enced PM2.5 and PM1 levels which slightly decreased (by 18%), but not as much as PM10 (by 40%). In addition to the above described mean hourly patterns (defined by road traffic emissions and wind velocity/dust resuspension), two additional types of PM episodes were identified. One from 04 to 06 h with relatively high levels of PM1 occurring on 14th, 18th, 21st, 22nd and 25th to 27th March 2006. During most of those days, PM2.5levels were higher during the night than during daytime. These episodes are also reflected in the mean hourly evolution obtained for the urban sites (Fig. 4), and as interpreted already by Doran et al. (2007) on the basis of real time measurements of OC and EC at T1 and T2, they may be attributed to the trapping of pollutants in the Mex-ico City area overnight and during the morning hours in a shallow surface layer before the rapid growth of the mixing layer commences around 07:00 h. Another single episode of coarse PM10occurred from 10:00 to 20:00 h on 19th March 2006 at CENICA and T0, probably caused by local dust re-suspension due to high wind velocity as recorded by Fast et al. (2007) during this day, compared with the rest of the cam-paign.
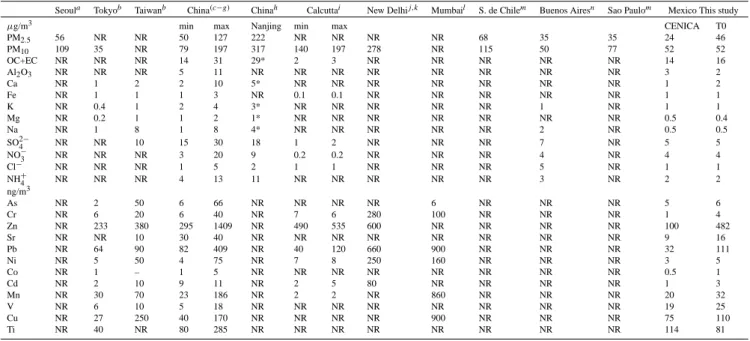
Table 3. Mean PM10and PM2.5levels and PM10speciation from large Asian cities compared with the data obtained in this study for Mexico
City.* Only water soluble fraction.
Seoula Tokyob Taiwanb China(c−g) Chinah Calcuttai New Delhij,k Mumbail S. de Chilem Buenos Airesn Sao Paulom Mexico This study
µg/m3 min max Nanjing min max CENICA T0
PM2.5 56 NR NR 50 127 222 NR NR NR NR 68 35 35 24 46 PM10 109 35 NR 79 197 317 140 197 278 NR 115 50 77 52 52 OC+EC NR NR NR 14 31 29* 2 3 NR NR NR NR NR 14 16 Al2O3 NR NR NR 5 11 NR NR NR NR NR NR NR NR 3 2 Ca NR 1 2 2 10 5* NR NR NR NR NR NR NR 1 2 Fe NR 1 1 1 3 NR 0.1 0.1 NR NR NR NR NR 1 1 K NR 0.4 1 2 4 3* NR NR NR NR NR 1 NR 1 1 Mg NR 0.2 1 1 2 1* NR NR NR NR NR NR NR 0.5 0.4 Na NR 1 8 1 8 4* NR NR NR NR NR 2 NR 0.5 0.5 SO2−4 NR NR 10 15 30 18 1 2 NR NR NR 7 NR 5 5 NO−3 NR NR NR 3 20 9 0.2 0.2 NR NR NR 4 NR 4 4 Cl− NR NR NR 1 5 2 1 1 NR NR NR 5 NR 1 1 NH+4 NR NR NR 4 13 11 NR NR NR NR NR 3 NR 2 2 ng/m3 As NR 2 50 6 66 NR NR NR NR 6 NR NR NR 5 6 Cr NR 6 20 6 40 NR 7 6 280 100 NR NR NR 1 4 Zn NR 233 380 295 1409 NR 490 535 600 NR NR NR NR 100 482 Sr NR NR 10 30 40 NR NR NR NR NR NR NR NR 9 16 Pb NR 64 90 82 409 NR 40 120 660 900 NR NR NR 32 111 Ni NR 5 50 4 75 NR 7 8 250 160 NR NR NR 3 5 Co NR 1 – 1 5 NR NR NR NR NR NR NR NR 0.5 1 Cd NR 2 10 9 11 NR 2 5 80 NR NR NR NR 1 3 Mn NR 30 70 23 186 NR 2 2 NR 860 NR NR NR 20 32 V NR 6 10 5 18 NR NR NR NR NR NR NR NR 19 25 Cu NR 27 250 40 170 NR NR NR NR 900 NR NR NR 75 110 Ti NR 40 NR 80 285 NR NR NR NR NR NR NR NR 114 81
a Kim and Kim (2003) h Wang et al. (2003)
b Clean Air Initiatives for Asian cities (2006). Air Quality in Asian cities, 6 p., i Karar et al. (2007) http://www.cleanairnet.org/caiasia/1412/article-59689.html j M¨onkk¨onen et al. (2004)
c Zheng et al. (2004) k Balachandran et al. (2000)
d Hea et al. (2001) l Kumar et al. (2001)
e Chan et al. (2005) m Rojas-Bracho et al. (2002)
f Ho et al. (2003) n Bogo et al. (2003)
g Sun et al. (2004) NR Not reported
4.2 PM composition
As shown in Table 4, TSP, PM10 and PM2.5 levels in Mexico City are highly influenced by crustal
mate-rial (SiO2+CO2−3 +Al2O3+Ca+Fe+Mg+K): 25–27% of PM10 (13–15µg/m3) in urban sites, and 36 and 43% in the sub-urban site T1 and at the industrial hotspot Jasso (36 and 27µg/m3, respectively); confirming that the high PM10levels recorded at these sites are partly due to dust resuspension. In PM2.5 this contribution decreased but still reached relatively high levels (15–28%, 6–9µg/m3at most sites), this being in agreement with previous works (Miranda et al., 1996; Vega et al., 2001). This crustal influence is also observed when studying the samples under the scanning electron microscope (SEM). Approximately 50% of the particles observed are minerals, mostly silicates (quartz, clays, micas, feldspars), but also phosphates, carbonates (calcite and siderite) and sul-fates (gypsum). Applying the algorithm used by Chow et al. (2002): (1.89xAl+2.14xSi+1.4xCa+1.43xFe) the mineral matter content for these samples is about 18% less than when calculating it with our methodology, although the correlation coefficient between the two methods is very high (R2=0.99).
The carbonaceous aerosols (OM+EC) also accounted for a high proportion of the PM mass: 32–46% PM10 (18– 23µg/m3, with the highest values for T0) in urban sites, 35– 37% (14–27µg/m3) at both industrial influenced sites, and less than 23% (8–13µg/m3) in the suburban and rural sites T1 and T2. In PM2.5this contribution increased up to 55% and 30% in the urban and suburban sites, respectively, and from 51 to 53% at the industrial sites. The ratio EC/OC in PM10determined in the present study varied from 0.2 to 0.6 for the different sites (with the exception of T1, where the ratio was close to 1). An EC/OC ratio of 0.2 for T1 was re-ported by Doran et al. (2007). The average EC/OC ratio at Tula was 0.4 (for PM2.5and PM10), which is consistent with those values reported by Vega et al. (2007) for Salamanca (0.4 and 0.3 for PM2.5and PM10, respectively) which is also an industrial area influenced by a refinery and a power plant.
At the urban sites of CENICA and T0 (PM10), and at the suburban site T1 (PM2.5) there is a significant correlation of K and OC+EC (R2=0.4–0.6), but also of K and Al (R2=0.5–0.8) pointing to the relevance of both biomass com-bustion and mineral dust (K-feldspars and illite) emissions
0 50 100 150 200 250 07/03/06 11/03/06 15/03/06 19/03/06 23/03/06 27/03/06 31/03/06 µ g /m 3 PM10 PM2.5 PM1 T0 PM10 PM2.5 PM1 0 50 100 150 200 250 07/03/06 11/03/06 15/03/06 19/03/06 23/03/06 27/03/06 31/03/06 µ g /m 3 PM10PM10 PM2.5 PM2.5 PM1PM1 PM10 PM2.5 PM1 CENICA 0 50 100 150 200 250 07/03/06 11/03/06 15/03/06 19/03/06 23/03/06 27/03/06 31/03/06 µ g /m 3 PM10 PM2.5 PM1 T0 PM10 PM2.5 PM1 0 50 100 150 200 250 07/03/06 11/03/06 15/03/06 19/03/06 23/03/06 27/03/06 31/03/06 PM10PM10 PM2.5 PM2.5 PM1PM1 PM10 PM2.5 PM1 CENICA 0 50 100 150 200 250 07/03/06 11/03/06 15/03/06 19/03/06 23/03/06 27/03/06 31/03/06 µ g /m 3 PM10 PM2.5 PM1 T0 PM10 PM2.5 PM1 0 50 100 150 200 250 07/03/06 11/03/06 15/03/06 19/03/06 23/03/06 27/03/06 31/03/06 µ g /m 3 PM10PM10 PM2.5 PM2.5 PM1PM1 PM10 PM2.5 PM1 CENICA 0 50 100 150 200 250 07/03/06 11/03/06 15/03/06 19/03/06 23/03/06 27/03/06 31/03/06 µ g /m 3 PM10 PM2.5 PM1 T0 PM10 PM2.5 PM1 0 50 100 150 200 250 07/03/06 11/03/06 15/03/06 19/03/06 23/03/06 27/03/06 31/03/06 PM10PM10 PM2.5 PM2.5 PM1PM1 PM10 PM2.5 PM1 CENICA
Fig. 7. Hourly PM levels measured during the MILAGRO campaign at 2 urban background sites of Mexico City, CENICA and T0.
contributing to the variability of the levels of these com-ponents. The influence of biomass combustion on OC+EC levels also diminishes the typical urban correlation between nitrate and OC+EC levels. Biomass burning episodes and their important influence on PM levels and composition in Mexico were previously reported by Johnson et al. (2006), Salcedo et al. (2006), Yokelson et al. (2007), Moffett et al. (2007), Molina et al. (2007), Stone et al. (2007) and Zang et al. (2007). These studies provided quantitative estimations of the contribution from biomass burning to PM levels, which vary widely according to the different authors. As described above, the influence of biomass burning on PM composition was detected in the present study, even though the current data does not enable us to provide an accurate estimation of the magnitude of this source contribution. By applying the factors relating biomass burning carbon with total OC by Stone et al. (2007) to the data from the present study, our re-sults suggest that biomass burning contributions to PM2.5at T0 should range between 5–15%.
Secondary inorganic aerosols (SIA= SO2−4 +NO−3+NH+4) accounted for 15–20% of PM10 and PM2.5 mass at the ur-ban sites, 10–19% at the suburur-ban site, and 20–40% at the
industrial sites, with sulfate accounting for around 50–65% of SIA. Levels of ammonium (1.1–1.5µg/m3 in PM10) and sulfate (4–5 µg/m3in PM10) were homogenous at the differ-ent urban, suburban and rural sites, and relatively higher at the industrial sites (2.0–2.5µg NH+4/m3and 6.5µg SO2−4 /m3 in PM10), this low spatial variability agrees with Salcedo et al. (2006), who concluded that sulfate in MCMA has mostly a regional character. Nitrate levels were relatively low, but higher at the urban sites (2.8–3.6µg/m3in PM10and PM2.5), compared with the suburban and rural (1.1-2.8 µg/m3) and
industrial (0.6–1.8µg/m3) sites. Levels of SIA in PM2.5were only slightly reduced with respect to PM10 for SO2−4 and NO−3 in the urban sites. These results coincide with those obtained for PM2.5 at the CENICA site during the MCMA-2003 Campaign, when similar levels of sulfate (3.1µg/m3),
nitrate (3.7µg/m3) and ammonium (2.2µg/m3) were
regis-tered (Salcedo et al., 2006). In the suburban site T1 SIA levels in PM2.5were markedly reduced for nitrate due to the major occurrence of coarser Ca and Na nitrate species. This was also found by Fountoukis et al. (2007), who estimated 30% of nitrate being in the coarse fraction during 21th–30th March 2006, similar to our 39% during the same period. It is
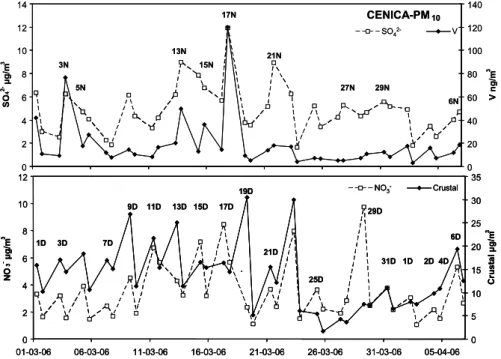
Figure 8 3N 5N 13N 15N 17N 21N 27N 29N 6N 0 2 4 6 8 10 12 14 SO 4 2 -µ g /m 3 0 20 40 60 80 100 120 140 V n g /m 3 SO42- V CENICA-PM10 .. 1D 3D 7D 9D 11D 13D 15D 17D 21D 25D 29D 31D 1D 2D 4D 19D 6D 0 2 4 6 8 10 12 01-03-06 06-03-06 11-03-06 16-03-06 21-03-06 26-03-06 31-03-06 05-04-06 N O 3 -µ g /m 3 0 5 10 15 20 25 30 35 C ru s ta l µ g /m 3 NO3- Crustal .. 3N 5N 13N 15N 17N 21N 27N 29N 6N 0 2 4 6 8 10 12 14 SO 4 2 -µ g /m 3 0 20 40 60 80 100 120 140 V n g /m 3 SO42- V CENICA-PM10 .. 1D 3D 7D 9D 11D 13D 15D 17D 21D 25D 29D 31D 1D 2D 4D 19D 6D 0 2 4 6 8 10 12 01-03-06 06-03-06 11-03-06 16-03-06 21-03-06 26-03-06 31-03-06 05-04-06 N O 3 -µ g /m 3 0 5 10 15 20 25 30 35 C ru s ta l µ g /m 3 NO3- Crustal .. 1D 3D 7D 9D 11D 13D 15D 17D 21D 25D 29D 31D 1D 2D 4D 19D 6D 0 2 4 6 8 10 12 01-03-06 06-03-06 11-03-06 16-03-06 21-03-06 26-03-06 31-03-06 05-04-06 N O 3 -µ g /m 3 0 5 10 15 20 25 30 35 C ru s ta l µ g /m 3 NO3- Crustal ..
Fig. 8. Mean 12 h levels of SO2−4 , NO−3, V and crustal material recorded at CENICA during the MILAGRO campaign. N, maximum value
recorded in the nighttime sample; D maximum value recorded in the daylight sample.
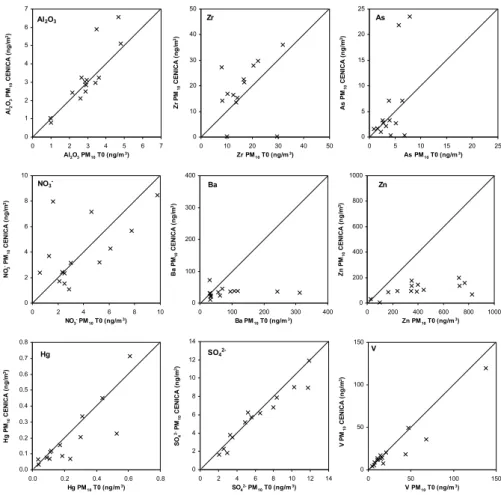
interesting to note that the above described fine PM episodes (overnight trapping of pollutants in Mexico City and during the morning hours) coincide with the peak levels of ammo-nium sulfate, V and Ni (tracers of fuel-oil combustion and regional/urban background PM climate). Thus, Figs. 8 and 9 show the occurrence of these sulfate-vanadium episodes at CENICA, and Fig. 9 evidences a very good correlation be-tween the levels of the above tracers recorded at CENICA and T0. The levels of most crustal elements and Hg exhibit a good correlation between the two urban sites. Figure 8 also evidences that nitrate and crustal material episodes are recorded during daytime and do not coincide with the above regional episodes, but are more related with local pollution episodes. This is also corroborated by Fig. 9, showing lower correlation between levels of nitrate, Ba and Zn (usually as-sociated with road traffic emissions and consequently higher at T0) measured at the two urban sites when compared with sulfate. This is also the case of As and Zr, with relatively higher levels being recorded at CENICA and with a low cor-relation with T0.
As expected the marine aerosols accounted for a very low fraction of PM10(<1.5% in most cases).
As previously reported for PM levels, with the excep-tion of carbonaceous aerosols and V, levels of major com-ponents and trace elements in PM are usually much lower (one order of magnitude in some cases) during the MILA-GRO campaign than those reported from other large cities (Table 3 and Table 4). Levels in PM10 of As (5–7 ng/m3), Zn (100–500 ng/m3), Cd (1–3 ng/m3) and V (20–50 ng/m3)
were relatively high when compared with most urban sites
from the US and Europe, or with values reported from Mex-ico city during 1996–1998 (Mugica et al., 2002) or during MCMA-2003 campaign (Johnson et al., 2006). However, the limit and target values for Ni, Pb, Cd and As from the EU (1999/30/CE and 2004/107/CE) were met with the ex-ception of As (exceeding slightly the EU target value of 6 ng/m3). Once again, it is essential to remember that the data obtained during the MILAGRO campaign do not represent annual mean values. The presence of metals in these sam-ples has also been observed in the SEM, with most of them containing Ba (irregular in shape and interpreted as derived from traffic, probably brake linings), Fe (from condensed spherules to amorphous oxidized masses between 1–3µm in size) or Pb (usually 1µm or less in size, and commonly spheroidal). Particles of other individual metals are much rarer but include Cu, Zn, Mn, W, Sb, Ni (with V), and Mo, all of which are again very fine grained (usually sub-micron). According to the above data, PM10 at the urban and in-dustrially influenced areas is mainly made up of OM+EC (32–46%), crustal material (25–27% urban, 15–35% indus-trial) and SIA (15–19% urban, 14–29% indusindus-trial). The un-accounted material (mostly water and heteroatoms in organic matter) accounts for 3 to 29% of the PM10mass, whereas the trace elements account for 1 to 2% of the mass. At the rural sites, the proportion of crustal material increases to 32–43%, whereas OM+EC diminishes down to 16–23% (Fig. 10). The prevalence of carbonaceous aerosols in the PM composition detected in this study is consistent with the results by Chow et al. (2002) and Salcedo et al. (2006). In PM2.5(Fig. 10) the crustal material is reduced (but still present in relatively high
Figure 9 0 1 2 3 4 5 6 7 0 1 2 3 4 5 6 7 Al2O3 PM10 T0 (ng/m 3) A l2 O3 PM 10 C E N IC A ( n g /m 3) Al2O3 0 10 20 30 40 50 0 10 20 30 40 50 0 5 10 15 20 25 0 5 10 15 20 25 As PM10 T0 (ng/m 3) A s P M 10 C E N IC A ( n g /m 3) As Zr Zr PM10 T0 (ng/m 3) Z r P M 10 C E N IC A ( n g /m 3) 0 2 4 6 8 10 0 2 4 6 8 10 NO3 -NO3- PM10 T0 (ng/m3) N O3 - PM 10 C E N IC A ( n g /m 3) 0 100 200 300 400 0 100 200 300 400 Ba PM10 T0 (ng/m3) B a P M10 C E N IC A ( n g /m 3) Ba 0 200 400 600 800 1000 0 200 400 600 800 1000 Zn PM10 T0 (ng/m3) Z n P M10 C E N IC A ( n g /m 3) Zn 0.0 0.1 0.2 0.3 0.4 0.5 0.6 0.7 0.8 0.0 0.2 0.4 0.6 0.8 Hg PM10 T0 (ng/m3) H g P M10 C E N IC A ( n g /m 3) Hg 0 2 4 6 8 10 12 14 0 2 4 6 8 10 12 14 SO42- PM10 T0 (ng/m3) SO 4 2- PM 10 C E N IC A ( n g /m 3) SO4 2-0 50 100 150 0 50 100 150 V PM10 T0 (ng/m3) V PM 10 C E N IC A ( n g /m 3) V
Fig. 9. Correlation between levels of Al2O3, Zr, As, NO−3, Ba, Zn, Hg, V and SO
2−
4 in PM10at CENICA and T0.
proportions) in the urban area down to 15% and to 8–17% in the industrially influenced sites, but it is still present in around 30% at the suburban site of T1 due to high local soil resuspension. Conversely, the proportions of carbonaceous aerosols increase up to 55% at the urban and industrial sites and 30% at the suburban site.
As shown in Fig. 11 crustal elements are generally present in the coarse fraction, especially at T1, where they are present in the fraction >10µm in a significant proportion (PM10/TSP ratio 04–0.6). The higher PM2.5/PM10ratios were measured at the urban and industrial sites (0.4 at T0 and Jasso) when compared with the suburban (0.3) site, due to the major an-thropogenic origin of the mineral matter in the first locations (road dust, demolition, limestone quarry, cement plants, etc). The other elements, mostly with a major anthropogenic ori-gin, are mainly present in the fine fraction, with PM2.5/PM10 and PM10/TSP ratios usually >0.6, but in many cases >0.8. However, in some cases, where soil resuspension is impor-tant (T1) some elements such as Ni may have an imporimpor-tant coarse proportion (PM2.5/PM10 and PM10/TSP ratios close to 0.3).
At the urban sites, levels of major and trace crustal compo-nents and nitrate were significantly higher during the daylight period than during the night (Fig. 8), by a factor day/night ranging from 1.0 to 1.9 (with the highest values at CENICA) for PM10, as a consequence of higher emissions (from road traffic and from resuspension). Conversely, as shown in Fig. 8, levels of sulfate, chloride and most anthropogenic trace elements (Hg, V, Ni, Cu, Zn, As, Se, Mo, Cd, Sn, Ba and Pb) were higher at night (by a factor of 0.8–1.0, 0.5–0.7 and 0.4–0.9, respectively) probably due, as previously stated, to the reduction of the mixing layer depth. Carbonaceous aerosols increased as a mean also during the night at the ur-ban site T0 by a factor of 1.2 and at the suburur-ban site T1 by a factor of 1.5. At the urban site CENICA day and night levels of these components were very similar.
According to the transport and synoptic scenarios de-scribed by Fast et al. (2007) for the MILAGRO campaign, at-mospheric transport form Mexico City over the suburban site T1 occurred on 10th, 18th, 19th, 20th, 22nd, and 24th March 2006. From these days sampling took place only during 9th– 10th and 19th–20th. As it may be observed in Fig. 12, the atmospheric transport from Mexico City is traced at T1 by the increase of nitrate and potassium in PM2.5, whereas the
0% 20% 40% 60% 80% 100%
CENICA T0 UNAM Jasso PXT T2 T1
OM EC OM+EC Crustal SO42-SO42- NO3-NO3- NH4+NH4+ Trace elements Unaccounted
0% 20% 40% 60% 80% 100% T0 Jasso PXT T1
OM EC Crustal SO42-SO42- NO3-NO3- NH4+NH4+ Trace elements Unaccounted
Fig. 10. Mean PM10(top) and PM2.5(bottom) composition obtained at urban (dark grey), industrial-rural (clear grey) and suburban and
rural sites. Separate OM and EC data were unavailable for T2 site, and therefore their sum (OM+EC) is plotted for this site only.
transport from Tula industrial estate is traced by the increase of sulfate levels on 21st March 2006.
4.3 Statistical analysis
Comparing the mean levels of trace elements measured at the different study sites in the present work and with the dis-tribution of major PM components, the following source ori-gins may be identified:
– Crustal origin (soil and/or urban dust): Li, Be, P, Sc,
Ti, Mn, Co, Ga, Ge, Rb, Sr, Y, Zr, Nb, Cs, Rare Earth Elements, Hf, U, Th.
– Urban (mostly road traffic): Cr, Mn, Cu, Zn, As, Se, Cd,
Sn, Sb, Ba and Pb, typically associated with road traf-fic emissions (engine emissions, abrasion of tyres and brake pads).
– Industrial around Tula: Pb, Cr and V (other elements
such as Cd, As, Ni were not analyzed here).
– Industrial and regional (petrochemical estate, fuel oil,
petcoke combustion): V, Ni and sulfate.
Particulate Hg is not higher at the urban sites than at the sub-urban site T1, consequently, as previously reported, it has an external (regional) origin to the city. However, local sources, such as a hazardous waste incinerator and a petrochemical plant may also contribute to increase Hg in a much minor proportion (Gonz´alez et al., 2007).
These findings were confirmed by performing a statisti-cal analysis of the different datasets, by means of Princi-pal Component Analysis (PCA) with the software STATIS-TICA v.4.2. This kind of factor analysis requires a mini-mal internal variability, and therefore it was only applied to the datasets containing >25 samples (CENICA, T0 and T1). However, the number of samples (25, 35 and 38 at T1, T0 and CENICA, respectively) was lower than the minimum number of cases required according to Henry et al. (1984) (n>30+(V+3)/2, where n is the number of samples and V is the number of variables). Consequently, in order to confirm
Table 4. Mean TSP, PM10and PM2.5levels and major components (µg/m3) recorded at the study sites during the MILAGRO campaign.
CENICA T0 T1 T2 UNAM Jasso PXT
PM10 PM10 PM2.5 PST PM10 PM2.5 PM10 PM10 PM10 PM2.5 PM10 PM2.5 n 38 36 27 23 24 25 8 7 28 28 27 27 PM 53 50 40 193 82 33 34 54 75 31 37 26 OC 10.8 12.9 12.4 8.0 5.0 3.7 ND 8.0 12.9 8.0 7.1 6.8 EC 3.6 2.7 2.1 5.6 5.3 4.0 ND 4.7 6.0 3.6 2.2 2.2 CO2−3 2.0 2.3 0.9 9.2 4.2 1.1 1.3 2.3 13.8 2.5 1.4 0.5 SiO2 5.1 4.9 2.4 34.6 15.7 4.0 4.7 5.6 2.4 0.6 1.4 0.9 Al2O3 2.5 2.4 1.2 17.3 7.9 2.0 2.3 2.8 0.6 0.1 0.4 0.1 Ca 1.3 1.5 0.6 6.2 2.8 0.7 0.9 1.5 9.2 1.7 0.9 0.3 K 0.7 0.7 0.3 1.9 1.1 0.6 0.5 0.6 0.2 0.1 0.1 0.2 Na 0.5 0.5 0.3 1.6 0.8 0.3 0.2 0.4 0.2 0.1 0.1 0.1 Mg 0.5 0.4 0.1 1.8 0.9 0.3 0.3 0.4 0.3 0.1 0.1 0.04 Fe 0.9 1.1 0.4 4.2 2.0 0.6 0.6 1.0 0.6 0.1 0.6 0.2 SO2−4 4.9 5.3 3.7 6.3 4.8 3.9 4.4 4.2 6.4 3.7 6.4 6.4 NO−3 3.5 3.6 2.8 4.2 2.8 1.1 1.2 1.8 1.8 0.6 1.6 0.8 Cl− 0.4 0.4 0.7 0.5 0.3 0.2 0.1 0.1 0.1 0.2 0.1 0.1 NH+4 1.6 1.5 1.0 1.2 1.1 1.1 1.2 1.5 2.0 1.6 2.4 2.5
the validity of the results PCA was applied separately to the PM10datasets from T0, CENICA and T1, and it was also ap-plied to a larger dataset made up of the combination of the CENICA and T0 samples, with similar results. This con-firmed the robustness of the solution.
The results for CENICA were very similar to those for T0, and thus are not included in the description below. At the urban locations (CENICA and T0), four main factors were identified (representing the main source categories):
Factor 1:
the main tracers of this factor were Al2O3, Ti, Mg, Fe, Ca, P, K, Na, Mn, Th, Ce, Zr, suggesting the clearly mineral ori-gin of this source. This factor probably represents mineral dust resuspension in the city, both road/city and soil dust. The daily evolution of the contribution to the PM mass of this factor showed a marked decrease after 23rd March 2006, coinciding with the washout of road and city dust by precip-itation.
Factor 2:
this factor was characterized by SO2−4 , V, Ni, NH+4 and Hg, and it was interpreted as regional-scale transport. The contri-bution from SO2−4 and NH+4 suggests long-range transport, and once again the correlation between these species and Hg is observed and it confirms the regional origin of Hg. The fact that Ni and V are also found in this factor shows that the impact from fuel-oil combustion emissions such as those registered in the Tula industry estate may be detected in Mex-ico City under specific air mass transport scenarios (regional-scale transport).
Factor 3:
Sr, Cu, Ba, Pb, Cr, C, Zn and Cd were the main tracers of this source, which was interpreted as road traffic. SEM-EDX ob-servations confirmed this association of metals. This source was the only one presenting slight differences between T0 and CENICA, probably due to the larger traffic influence in T0. Whereas the factor loadings of major and primary traffic tracers were higher at T0 (C, Cu, Ba, Pb), it was
the secondary or minor traffic tracers that were highest at CENICA (NO−3, Rb, Cd). This confirms that even though traffic emissions are dominant at both urban sites, their im-pact is more direct in the case of T0 than of CENICA.
Factor 4:
the last factor was characterized by As, Zr, Th, Ce, and Cr, and the nature of this source is yet unclear. This combination of elements could suggest the resuspension of volcanic dust deposited on the city roads, or the influence of an additional source affecting both urban sites.
In the case of the T1 suburban site, five factors were iden-tified:
Factor 1:
with Fe, Ti, Mn, Al2O3, Ce, Mg, Th, K, Rb, Sr, Ba, Na, Zr, Cr, Ca and P as main tracers, the nature of this source was interpreted as mineral, although some differences may be ob-served with the mineral source in T0 and CENICA. While the chemical profile in T1 suggests the prevalence of clay miner-als, in T0 and CENICA a mixture is observed between clay minerals, carbonates and K-feldspars among others (higher factor loadings for Ca, P, K) originating from construction and demolition activities in the city.
Factor 2:
this factor was characterized by Pb, Cd, Cu and Zn and it represents an anthropogenic source of PM, probably linked to industrial emissions which could be related to small smelt-ing plants located to the northeast of Mexico City (R. Mof-fett, personal communication).
Factor 3:
with NH+4 and SO2−4 as its main tracers, this source clearly represents regional-scale transport. Hg was also found to cor-relate with this source, even though the highest factor loading for this element was found in Factor 4.
Factor 4:
Sb, As, C, NO−3 and Cd were the main tracers of this source, which coincided largely with the traffic source at the ur-ban sites. Thus, this source could be interpreted as the
Table 5. Mean levels of trace components in TSP, PM10and PM2.5(ng/m3) recorded at the study sites during the MILAGRO campaign.
NA: not available.
CENICA T0 T1 T2 UNAM Jasso PXT
PM10 PM10 PM2.5 TSP PM10 PM2.5 PM10 PM10 PM10 PM2.5 PM10 PM2.5 n 38 36 27 23 24 25 8 7 28 28 27 27 Hg 0.14 0.22 0.13 0.40 0.28 0.18 0.04 0.11 NA NA NA NA Li 0.4 0.5 0.4 2.2 1.0 0.2 0.1 0.5 NA NA NA NA Be 0.05 0.05 0.04 0.57 0.27 0.12 0.05 0.05 NA NA NA NA P 100 120 53 304 166 48 72 106 NA NA NA NA Sc 0.6 0.6 0.5 1.6 1.0 0.5 0.2 1.1 NA NA NA NA Ti 109 81 36 440 205 57 65 85 NA NA NA NA V 19 25 13 27 17 10 9 16 50 30 21 18 Cr 0.7 4.4 2.1 4.9 1.5 0.9 0.1 1.9 20 15 192 102 Mn 20 32 16 83 41 13 15 23 NA NA NA NA Co 0.5 0.8 0.5 1.6 0.9 0.2 0.3 0.5 NA NA NA NA Ni 3 5 3 9 5 2 1 3 NA NA NA NA Cu 78 110 90 103 33 27 13 140 13 11 10 5 Zn 103 482 244 187 165 97 8 98 21 11 11 5 Ga 0.4 0.4 0.3 1.9 1.2 0.4 0.4 0.1 NA NA NA NA Ge <0.1 0.2 0.2 0.3 0.1 0.1 <0.1 <0.1 NA NA NA NA As 6 6 6 4 3 2 1 7 NA NA NA NA Se 7 6 6 3 3 3 1 7 NA NA NA NA Rb 0.9 0.9 0.5 2.5 1.8 1.0 0.6 0.7 NA NA NA NA Sr 9 16 5 38 18 5 5 9 NA NA NA NA Y 0.3 0.2 0.1 1.8 0.9 0.2 0.1 0.2 NA NA NA NA Zr 20 18 15 45 29 22 6 23 NA NA NA NA Nb 0.4 0.4 0.3 1.9 1.1 0.4 0.3 0.5 NA NA NA NA Mo 1 2 2 8 5 3 0.1 0.1 NA NA NA NA Cd 2 3 3 1 1 1 0.3 2 NA NA NA NA Sn 23 32 29 12 14 9 4 7 NA NA NA NA Sb 15 16 15 10 10 8 3 8 NA NA NA NA Cs 0.1 0.1 0.1 0.3 0.2 0.1 <0.1 0.2 NA NA NA NA Ba 30 92 22 82 43 12 3 27 NA NA NA NA La 1.3 0.8 0.7 0.4 1.2 0.5 0.7 0.5 NA NA NA NA Ce 1.6 1.5 1.2 6.9 4.1 1.1 1.0 1.5 NA NA NA NA Hf 0.7 0.6 0.5 1.4 0.9 0.7 0.2 0.8 NA NA NA NA Tl 0.6 0.4 0.3 0.3 0.5 0.2 <0.1 0.3 NA NA NA NA Pb 34 111 62 35 31 23 6 26 23 20 253 199 Bi 0.2 0.4 0.3 0.3 0.1 0.1 0.2 0.2 NA NA NA NA Th 0.1 0.1 0.1 1.1 0.5 0.1 0.1 0.2 NA NA NA NA U 0.3 0.3 0.2 0.5 0.4 0.4 0.2 0.4 NA NA NA NA
contribution from local traffic but also as the transport to-wards T1 of the emissions from Mexico City. This factor has also high loadings for K and Hg.
Factor 5:
V and Ni were the main tracers of this source, which was interpreted as fuel-oil combustion probably from the petro-chemical estate in Tula. It is interesting to observe that at T1 the regional source does not include the contributions from V and Ni, which were detected jointly at the urban sites. This indicates that the impact from the emissions from the petrochemical estate is registered at T1 under specific air mass transport scenarios, which do not always coincide with regional-scale transport as in the case of the urban sites.
It is interesting to note that biomass burning emissions were not identified as a single source in any of the factor analyses performed. Instead, tracers of these emissions (K) were correlated with the mineral and regional-fuel oil com-bustion sources. The non-identification of this source may be related to its probably low contribution to the PM10mass compared to other sources during the study period. Also the limited number of samples available (25–38 samples/site),
the short duration of the campaign, and the fact that spe-cific tracers (OC, WSOC, water-soluble K) were not avail-able for all samples may account for the non identification of this source. However, the correlation between OC+EC and K levels described above (Sect. 4.2) evidences the influence of this source on PM levels and composition. Potassium in PM2.5was also detected as tracer of the Mexico’s plume at a rural site in this study. Thus the contribution of biomass burning to PM10and PM2.5was detected but in much minor proportions than reported by other authors by modeling. Fur-thermore, for finer aerosols (such as PM1) this source may probably contribute in a larger extend due to the reduction of the mineral matter load (containing also K).
5 Conclusions
The levels of PM during the MILAGRO campaign (1st to 31st March 2006) ranged from 50 to 56µg PM10/m3, 24 to 40µg PM2.5/m3 and 19 to 33µg PM1/m3 in Mexico City. Although these levels may be considered as relatively high
0.0 0.2 0.4 0.6 0.8 1.0 L i Be P Sc T i C r Mn Co Ga Rb Sr Y Zr Nb Ba Ce Pr Nd Hf Ta Th V N i H g C u Z n As Se Mo Cd Sn Sb Cs Pb Bi U T0 PM2.5/PM10 T1 PM2.5/PM10 PXT PM2.5/PM10 Jasso PM2.5/PM10
M ineral elements Other elements
PM2.5/PM10 PM2.5/PM10 PM2.5/PM10 PM2.5/PM10 PM 2 .5 /P M1 0 ra ti o 0.0 0.2 0.4 0.6 0.8 1.0 L i Be P Sc T i C r Mn Co Ga Rb Sr Y Zr Nb Ba Ce Pr Nd Hf Ta Th V N i H g C u Z n As Se Mo Cd Sn Sb Cs Pb Bi U T1 PM2.5/PM10 T1 PM10/TSP
M ineral elements Other elements
PM2.5/PM10 PM10/TSP PM 2 .5 /P M1 0 a n d P M1 0 /T S P r a ti o s
Fig. 11. PM2.5/PM10ratios of trace elements levels at T0, T1, Jasso and PXT. PM10/TSP levels at T1.
W winds
N&E winds W&SW winds variable SW winds
0 1 2 3 4 01-03-06 06-03-06 11-03-06 16-03-06 21-03-06 26-03-06 31-03-06 N O3 -a n d K µ g /m 3 0 2 4 6 8 10 12 SO 4 2 -µ g /m 3 NO3- K SO4 2-T1-PM2.5 .. Transport from Tula industrial estate Transport from México city
Fig. 12. 12 h levels (daylight and night) of nitrate, potassium and sulfate in PM2.5measured at the T1 suburban site on 1st, 3rd, 5th, 7th, 9th,
11th, 13th, 16th, 17th, 19th, 21st, 23rd, 25th, 27th and 29th March 2006. Note that nitrate and potassium trace the transport from Mexico City, whereas sulfate is mainly tracing the transport from Tula industrial estate. The transport and synoptic scenarios described by Fast et al. (2007) for the MILAGRO campaign are also marked in the plot.
when compared with US or European air quality standards, they are markedly lower than PM levels measured at Asian mega-cities.
Daily variations of PM levels were recorded in parallel at
the urban sites within the city, despite the distance between the sites (approx. 20 km). This suggests that the variabil-ity of PM levels and composition in Mexico Cvariabil-ity are de-termined by atmospheric dynamics, more specifically by the
mixing layer height, rather than by emission sources. Strong PM peak episodes originated by the decreasing mixing layer height were detected on a number of days between 04:00 and 06:00 h.
Important day-night variations were also observed: the levels of crustal components and NO−3 presented higher lev-els during daytime (coinciding with Chow et al., 2002 and Salcedo et al., 2006), while SO2−4 concentrations and most of anthropogenic trace metals presented higher levels during night hours.
The analysis of air mass transport scenarios demonstrated the impact of the emissions from Mexico City on the lev-els and chemical composition of PM on surrounding areas. On days when winds originated from the north/north-west, the impact of the Mexico City plume was clearly detected at the rural background site in Tenango. Conversely, under the influence of winds from the south/south-east, the influence of the Mexico City plume was detected at the T1 site, with nitrate and potassium in PM2.5being identified as major trac-ers. Finally, westerly circulations evidenced the influence of the emissions from Tula (petrochemical estate) on the chem-ical composition of PM at T1.
The statistical analysis of the PM10 data from T0, CENICA and T1 by PCA resulted in four sources at the urban sites (CENICA and T0), and five sources at the suburban site (T1). At the urban locations the main PM sources were mineral dust (both road/city and soil dust), regional-scale transport (including Hg), traffic emissions and an unidentified As source. Traffic emissions were characterized by primary tracers at T0, whereas secondary tracers were highest at CENICA, confirming that the impact of traffic emissions is more direct in T0 than in CENICA. At T1 the main PM sources were mineral dust, industrial emissions, regional-scale transport, local traffic (also interpreted as the transport towards T1 of the emis-sions from Mexico City), and oil combustion originating probably from the petrochemical estate in Tula. The inter-pretation of the traffic source at all sites was confirmed by the observation of Ba, Fe, Cu and Pb particles by SEM-EDX. Supplementary material: http://www.atmos-chem-phys. net/8/111/2008/acp-8-111-2008-supplement.zip
Acknowledgements. This study was supported by the Acci´on
Complementaria from the Ministry of Education and Science of Spain CGL2005-23745-E. We also thank the support from the Spanish Ministry of the Environment. We would like also to thank W. Eichinger from the University of Iowa for making available the meteorological data at T0 during the campaign.
Edited by: L. Molina
References
Aldape, F., Flores M. J., Flores A. J., Retama-Hernandez, A., and Rivera-Hernandez, O: Elemental composition and source identi-fication of PM2.5 particles collected in downtown Mexico City, International Journal PIXE, 15, 263-270, 2005.
Balachandran, S., Meena, B. R., and Khillare, P. S.: Particle size distribution and its elemental composition in the ambient air of Delhi, Environ. Int., 26, 49–54, 2000.
Bogo, H., Otero, M., Castro, P., Ozafr´an, M. J., Kreiner, A., Calvo, E. J., Negri, R. M.: Study of atmospheric particulate matter in Buenos Aires city, Atmos. Environ., 37, 1135–1147, 2003. CAF ´E: Clean Air for Europe: European Commission, Second
Po-sition Paper on Particulate Matter – CAFE Working Group on Particulate Matter, D.G. Environment, April 2004, 1–234, 2004. Chan, C. Y., Xu, X. D., Li, Y. S., Wong, K. H., Ding, G. A., Chan, L. Y., and Cheng, X. H.: Characteristics of vertical profiles and sources of PM2.5, PM10 and carbonaceous species in Beijing, Atmos. Environ., 39, 5113–5124, 2005.
Chow, J. C., Watson, J. C., Edgerton S. A., and Vega, E.: Chemical composition of PM2.5 and PM10 in Mexico City during winter 1997, Sci. Total Environ., 287, 177–201, 2002.
Clean Air Initiatives for Asian cities: Air Quality in Asian cities, 1–6, available at:http://www.cleanairnet.org/caiasia/1412/ article-59689.html, 2006.
Dockery D., Pope C., Xu, X., Spengler, J., Ware, J., Fay, M., Ferris, B., and Speizer, F.: An association between air pollution and mortality in six US cities, New Engl. J. Med., 329, 1753–1759, 1993.
Doran, J. C., Arnott, W. P., Barnard, J. C., Cary, R., Coulter, R., Fast, J. D., Kassianov, E. I., Kleinman, L., Laulainen, N. S., Mar-tin, T., Paredes-Miranda, G., Pekour, M. S., Shaw, W. J., Smith, D. F., Springston, S. R., and Yu, X.-Y.: The T1-T2 study: evo-lution of aerosol properties downwind of Mexico City, Atmos. Chem. Phys., 7, 1585–1598, 2007,
http://www.atmos-chem-phys.net/7/1585/2007/.
Fast, J. D. and Zhong, S.: Meteorological factors associated with inhomogeneous ozone concentrations within the Mexico City basin, J. Geophys. Res., 103, 18 927–18 946, 1998.
Fast, J. D., de Foy, B., Acevedo Rosas, F., Caetano, E., Carmichael, G., Emmons, L., McKenna, D., Mena, M., Skamarock, W., Tie, X., Coulter, R. L., Barnard, J. C., Wiedinmyer, C., and Madronich, S.: A meteorological overview of the MILAGRO field campaigns, Atmos. Chem. Phys., 7, 2233–2257, 2007, http://www.atmos-chem-phys.net/7/2233/2007/.
Fountoukis, C., Nenes, A., Sullivan, A., Weber, R., VanReken, T., Fischer, M., Mat´ıas, E., Moya, M., Farmer, D., and Cohen, R. C.: Thermodynamic characterization of Mexico City aerosol during MILAGRO 2006, Atmos. Chem. Phys. Discuss., 7, 9203–9233, 2007,
http://www.atmos-chem-phys-discuss.net/7/9203/2007/. Fung, K, Chow, J, and Watson, J.: Evaluation of OC/EC Specition
by Thermal Manganese Dioxide Oxidation and the IMPROVE Method, Air Waste Manage., 52, 1333–1341, 2002.
Gonz´alez, R., M´arquez, C., Bernab´e, R., Snyder, D. C., Rutter, A. P., Minguill´on, M. C., P´erez, N., Pey, J., Alverdin, L., Reyes, E., Miranda, L., Miranda, J., Moreno, T., Blanco, S., De la Rosa, A., Sol´orzano, G., Alastuey, A., Schauer, J., Querol, X., de Foy, B., Molina, L. T., and C´ardenas, B.: A43A-20 Measurements of To-tal Gaseous and Particulate Mercury in Mexico City During the