HAL Id: hal-00302273
https://hal.archives-ouvertes.fr/hal-00302273
Submitted on 16 Nov 2006HAL is a multi-disciplinary open access
archive for the deposit and dissemination of sci-entific research documents, whether they are pub-lished or not. The documents may come from teaching and research institutions in France or abroad, or from public or private research centers.
L’archive ouverte pluridisciplinaire HAL, est destinée au dépôt et à la diffusion de documents scientifiques de niveau recherche, publiés ou non, émanant des établissements d’enseignement et de recherche français ou étrangers, des laboratoires publics ou privés.
Observations and analysis of polar stratospheric clouds
detected by POAM III and SAGE III during the SOLVE
II/VINTERSOL campaign in the 2002/2003 Northern
Hemisphere winter
J. Alfred, M. Fromm, R. Bevilacqua, G. Nedoluha, A. Strawa, L. Poole, J.
Wickert
To cite this version:
J. Alfred, M. Fromm, R. Bevilacqua, G. Nedoluha, A. Strawa, et al.. Observations and analysis of polar stratospheric clouds detected by POAM III and SAGE III during the SOLVE II/VINTERSOL campaign in the 2002/2003 Northern Hemisphere winter. Atmospheric Chemistry and Physics Dis-cussions, European Geosciences Union, 2006, 6 (6), pp.11391-11426. �hal-00302273�
ACPD
6, 11391–11426, 2006POAM and SAGE PSC observations during SOLVE II/VINTERSOL J. Alfred et al. Title Page Abstract Introduction Conclusions References Tables Figures ◭ ◮ ◭ ◮ Back Close Full Screen / Esc
Printer-friendly Version Interactive Discussion
EGU
Atmos. Chem. Phys. Discuss., 6, 11391–11426, 2006 www.atmos-chem-phys-discuss.net/6/11391/2006/ © Author(s) 2006. This work is licensed
under a Creative Commons License.
Atmospheric Chemistry and Physics Discussions
Observations and analysis of polar
stratospheric clouds detected by POAM III
and SAGE III during the
SOLVE II/VINTERSOL campaign in the
2002/2003 Northern Hemisphere winter
J. Alfred1, M. Fromm2, R. Bevilacqua2, G. Nedoluha2, A. Strawa3, L. Poole4, and J. Wickert5
1
Computational Physics Inc., Springfield VA, USA
2
Naval Research Lab, Remote Sensing Division, Washington D.C., USA
3
NASA Ames Research Center, Atmospheric Physics Branch, Moffett Field CA, USA
4
Science Applications International Corporation, Hampton VA, USA
5
GeoForschungsZentrum, Dept. Geodesy and Remote Sensing, Potsdam, Germany Received: 18 September 2006 – Accepted: 1 November 2006 – Published: 16 November 2006
ACPD
6, 11391–11426, 2006POAM and SAGE PSC observations during SOLVE II/VINTERSOL J. Alfred et al. Title Page Abstract Introduction Conclusions References Tables Figures ◭ ◮ ◭ ◮ Back Close Full Screen / Esc
Printer-friendly Version Interactive Discussion
Abstract
The Polar Ozone and Aerosol Measurement and Stratospheric Aerosol and Gas Exper-iment instruments both observed high numbers of polar stratospheric clouds (PSCs) in the polar region during the second SAGE Ozone Loss and Validation Experiment (SOLVE II) and Validation of INTERnational Satellites and Study of Ozone Loss
(VIN-5
TERSOL) campaign, conducted during the 2002/2003 Northern Hemisphere winter. Between 15 November 2002 (14 November 2002) and 18 March 2003 (21 March 2003) SAGE (POAM) observed 122 (151) aerosol extinction profiles containing PSCs. PSCs were observed on an almost daily basis, from early December through 15 January, in both instruments. No PSCs were observed from either instrument until 4 February, and
10
sparingly in three periods in mid-and-late February and mid-March. In early December, PSCs were observed in the potential temperature range from roughly 375 K to 750 K. Throughout December the top of this range decreases to near 600 K. In February and March, PSC observations were primarily constrained to potential temperatures below 500 K. The PSC observation frequency as a function of ambient temperature relative to
15
the NAT saturation point was used to infer irreversible denitrification. By late December 38% denitrification was inferred at both the 400–475 K and 475–550 K potential tem-perature ranges. By early January extensive levels of denitrification near 80% were inferred at both potential temperature ranges, and the air remained denitrified at least through early March.
20
1 Introduction
The second SAGE Ozone Loss and Validation Experiment (SOLVE II) was a multi-platform measurement campaign during the 2002/2003 Northern Hemisphere (NH) winter in the polar region. The SOLVE II campaign was conducted in close collabo-ration with the Validation of INTERnational Satellites and Ozone Loss (VINTERSOL)
25
ACPD
6, 11391–11426, 2006POAM and SAGE PSC observations during SOLVE II/VINTERSOL J. Alfred et al. Title Page Abstract Introduction Conclusions References Tables Figures ◭ ◮ ◭ ◮ Back Close Full Screen / Esc
Printer-friendly Version Interactive Discussion
EGU
Aerosol and Gas Experiment III (SAGE) instrument by investigating the processes sur-rounding stratospheric ozone loss in the polar region. Given the important-and as yet not fully understood- role of polar stratospheric clouds (PSCs) in the photochemistry of polar ozone, a further understanding of PSCs and their role in the interactions of chlo-rine and nitrogen reservoir species was another main scientific objective of the SOLVE
5
II campaign (http://www.espo.nasa.gov/solveII/science.html).
The Naval Research Laboratory’s Polar Ozone and Aerosol Measurement III (POAM) is a space-borne solar occultation instrument similar in scientific capabilities and mea-surement coverage to SAGE. It was fully operational during the 2002/03 NH win-ter, and was a participant in the SOLVE II/VINTERSOL campaign (as it was
dur-10
ing the SOLVE/THESEO campaign conducted in 2000). In this paper we apply the Unified PSC detection methodology (Fromm et al., 2003) to both SAGE (Thomason and Taha, 2003) and POAM one-micron aerosol-extinction measurements to detect PSCs. The Unified PSC detection is an established methodology developed specifi-cally as an instrument independent algorithm for detection of PSCs from solar
occul-15
tation aerosol-extinction measurements. The technique has previously been applied to POAM (Fromm et al., 2003; Bevilacqua et al., 2002), SAM II and SAGE II data (Fromm et al., 2003). However, this analysis represents the first use of the technique with SAGE III data. First, we compare the resultant POAM and SAGE III databases during the SOLVE II/VINTERSOL winter. Next, we present an overview of the
evolu-20
tion of PSCs using measurements from both instruments and view this in reference to the meteorology of the SOLVE II/VINTERSOL winter and the climatology of previous NH PSC seasons. We then combine the SAGE and POAM PSC observations, and use the combined dataset to quantify PSC formation temperatures and their evolution as the season progresses. Expanding on the technique developed by Bevilacqua et
25
al. (2002), PSC formation temperatures are used infer denitrification over the course of the season.
ACPD
6, 11391–11426, 2006POAM and SAGE PSC observations during SOLVE II/VINTERSOL J. Alfred et al. Title Page Abstract Introduction Conclusions References Tables Figures ◭ ◮ ◭ ◮ Back Close Full Screen / Esc
Printer-friendly Version Interactive Discussion
2 POAM/SAGE instruments and measurement sampling
POAM is a satellite-based nine-channel visible/near infrared photometer for making measurements of ozone, aerosol extinction, water vapor and nitrogen dioxide using the solar occultation technique (Lucke et al., 1999). POAM was launched on board the Satellite Pour l’Observation de la Terre (SPOT 4) satellite on 23 March 1998 in
5
a sun-synchronous polar orbit with an inclination of 98.7◦ and 10:30 LT descending node. SAGE is also a satellite-based visible/near infrared solar occultation instrument and measures the same atmospheric constituents as POAM. However, unlike POAM, which uses individual filters, the SAGE instrument uses a grating spectrometer and an 800-element linear CCD detector to provide continuous spectral coverage from 280 to
10
1040 nm, with an additional photodiode at 1550 nm for measuring aerosol extinction (NASA, 2002). SAGE was launched on board Meteor-3M spacecraft on 10 December 2001 in a sun-synchronous polar orbit with an ascending node time of approximately 09:00 LT. SAGE was fully operational during the SOLVE II/VINTERSOL campaign.
As with all satellite-based solar occultation instruments, both POAM and SAGE make
15
measurements during satellite sunrises and sunsets (the SAGE instrument has in-creased sampling with limb scattering measurements, but here we only use the so-lar occultation measurements). This yields two measurements per orbit giving 14–15 measurements in each hemisphere on a daily basis for each instrument. As SPOT 4 has a daytime crossing of the equator in the descending node, and Meteor-3M has a
20
daytime crossing of the equator in the ascending node, with respect to the satellite, NH measurements are made at sunrise with POAM and sunset with SAGE. This leads to an inherent time difference in measurements even when both SAGE and POAM are sampling similar latitudes. Both instruments are on board satellites in sun-synchronous polar orbits, thus they sample around a circle of latitude on a given day with a
longi-25
tude spacing of approximately 25◦, with the measurement latitude changing gradually in a annually periodic cycle. Because the Meteor-3M satellite has a 09:00 LT equator crossing and the SPOT 4 has a 10:30 LT equator crossing, SAGE generally samples
ACPD
6, 11391–11426, 2006POAM and SAGE PSC observations during SOLVE II/VINTERSOL J. Alfred et al. Title Page Abstract Introduction Conclusions References Tables Figures ◭ ◮ ◭ ◮ Back Close Full Screen / Esc
Printer-friendly Version Interactive Discussion
EGU
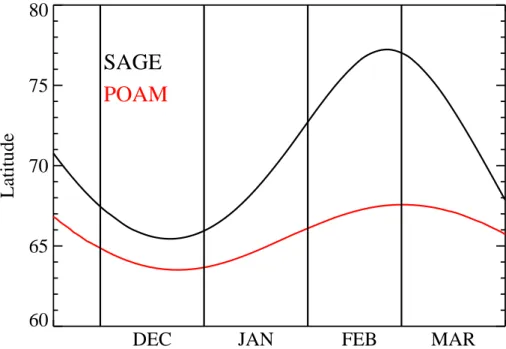
higher latitudes than POAM in the NH. Figure 1 shows the measurement latitude of both the SAGE and POAM instruments as a function of time throughout the 2002/2003 NH winter, with the SAGE latitudinal coverage shown in black, and that of POAM in red. Given the latitudinal range of coverage for the SAGE and POAM instruments, both are very well suited to observe PSCs in the NH. Combining measurements from the
5
two instruments allows for a wider range of coverage than would be available from one instrument only.
Figure 2 shows the equivalent latitude on the 500 K potential temperature surface (approximately 20 km) for all of the SAGE and POAM NH measurements during the SOLVE II/VINTERSOL winter. Equivalent latitude is an Ertel’s potential vorticity (EPV)
10
based vortex centered coordinate system. For this analysis EPV values were obtained from the daily values (12:00 UTC) from the United Kingdom Meteorological Office (MetOffice) (Swinbank and O’Neill, 1994) analysis, and interpolated in latitude, lon-gitude, altitude and time to the measurement locations of each instrument throughout the winter. On the figure, the polar vortex region is denoted with curves indicating the
15
equatorward, middle and poleward edges as determined by the vortex discrimination algorithm developed by Nash et al. (1996) (further references to the vortex edge will refer to the middle edge). Figure 2 indicates that both SAGE and POAM sample air inside, outside and on the edge of the polar vortex on the 500 K surface every day from November through April. As most PSCs occur inside the polar vortex, the extensive
20
coverage provided by combining the POAM and SAGE measurements should provide a fair characterization of the morphology of PSCs during the winter.
To illustrate the temperatures obtained during the SOLVE II/VINTERSOL winter, Fig. 3 shows a time series of the minimum temperature (Tmin) with respect to the
nitric acid trihydrate (NAT) condensation temperature (TNAT) from November through
25
April. For the calculation of TNAT we use the formulation given in Hanson and Mauers-burger (1988) assuming constant mixing ratios of water vapor and nitric acid of 6 ppmv and 9 ppbv respectively and the minima were calculated over the 150 to 10 hPa range. Temperatures were obtained from the MetOffice gridded analysis. Figure 3 shows the
ACPD
6, 11391–11426, 2006POAM and SAGE PSC observations during SOLVE II/VINTERSOL J. Alfred et al. Title Page Abstract Introduction Conclusions References Tables Figures ◭ ◮ ◭ ◮ Back Close Full Screen / Esc
Printer-friendly Version Interactive Discussion
vortex Tmin, as well as Tmin in a ±2◦ latitude band around the SAGE and POAM
mea-surement latitudes. The range of vortex Tmin from 1994 to 2004 is also shown, as
a reference. The early 2002/2003 winter was unusually cold, with a major warming in late-January. Temperatures were cold again in early-February, and late-February/early-March with a near major warming in mid-February and early-late-February/early-March (Manney et al.,
5
2005). All of these features are clearly illustrated in Fig. 3. From the beginning of De-cember until the late-January warming, minimum vortex temperatures were persistently sub-TNAT. In fact, in the first half of December the 2002/2003 vortex minimum
temper-atures were the coldest obtained in the 1994–2004 period. Both SAGE and POAM sample at or near the coldest air at this time as both are only separated by roughly 2
10
degrees of latitude. As the SAGE and POAM measurement latitudes begin to separate beginning in early January (see Fig. 1) the POAM and SAGE temperature sampling also begins to separate. Interestingly, however, although SAGE measures at increas-ingly higher latitudes than POAM, POAM generally samples closer to the coldest vortex air, suggesting that the cold pool was offset from the North Pole during this period.
Af-15
ter the January warming but before the mid-February warming minimum temperatures generally fluctuated near TNAT. After the mid-February warming the vortex then again
experienced a ten-to-twelve day period of temperatures below TNATwith another short
sub-TNAT period in early-March. This sub-TNAT air was sampled by POAM (which gen-erally sampled the coldest vortex air during these periods), but not by SAGE, again
20
suggesting that the cold pool was offset from the North Pole. In fact, except for two very brief periods in early and late February, after the mid-January warming SAGE did not sample sub- TNAT air for the duration of the winter.
ACPD
6, 11391–11426, 2006POAM and SAGE PSC observations during SOLVE II/VINTERSOL J. Alfred et al. Title Page Abstract Introduction Conclusions References Tables Figures ◭ ◮ ◭ ◮ Back Close Full Screen / Esc
Printer-friendly Version Interactive Discussion
EGU
3 Overview of SAGE and POAM PSC observations during the 2002/2003 winter
3.1 PSC detection
PSC detection was performed using the Unified detection algorithm developed by Fromm et al. (2003). For both POAM and SAGE, the algorithm uses measured aerosol extinction at 1 µm (POAM: channel 9 at 1.018 µm, and SAGE: 1.021 µm). The
al-5
gorithm objectively determines a reference background modal value (BG) for aerosol extinction and a measure of variance (sigma), about the background for each instru-ment independently. The BG and sigma are determined for both an inside and outside of the polar vortex air mass. The BG and sigma are calculated in 30-day increments, and interpolated to a daily grid. PSC detection is conducted by delineating each profile,
10
at each individual altitude, with respect to the polar vortex edge. The extinction at each altitude in the profile is then compared to the appropriate in- or out-of-vortex BG and sigma values for the day of the measurement. Perturbations in extinction are defined in multiples of sigma. A PSC is presumed to exist when the measured aerosol extinction exceeds the background level by >3 sigma, and the ambient temperature from the
co-15
located MetOffice grid (as described in Sect. 2, for the collocation to the MetOffice PV field) is less than five Kelvin above TNAT, calculated assuming a constant water vapor
and HNO3content of 6 ppmv and 9 ppbv respectively.
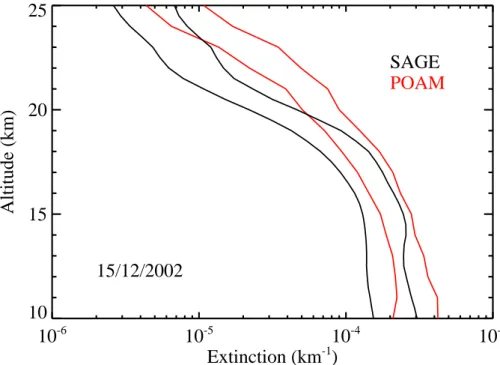
Figure 4 shows the BG and three-sigma extinction thresholds, inside the vortex and interpolated to 15 December 2002, for both SAGE and POAM instruments, as a
func-20
tion of altitude. This shows that there is a clear disagreement at some altitudes between the POAM and SAGE in-vortex background and 3-sigma aerosol extinction levels dur-ing the 2002/2003 winter. We have found that this level of disagreement is present in the vortex in all subsequent NH winter seasons. Differences in out-of-vortex BGs be-tween the two instruments are less pronounced. Russell et al. (2004) show the mean
25
ratio of SAGE/POAM out-of-vortex extinction measurements of 0.68 at 20 km, in Jan-uary, 2003. The out-of-vortex difference also does not vary over the season. The char-acterization and possible origin of the large POAM/SAGE bias in background aerosol
ACPD
6, 11391–11426, 2006POAM and SAGE PSC observations during SOLVE II/VINTERSOL J. Alfred et al. Title Page Abstract Introduction Conclusions References Tables Figures ◭ ◮ ◭ ◮ Back Close Full Screen / Esc
Printer-friendly Version Interactive Discussion
extinction in the vortex exhibited in Fig. 4 is discussed in detail by Randall et al. (2006)1. The difference is time-varying, with the SAGE extinction continuing to decrease to much lower values than POAM as the season progresses. The very low values measured by SAGE may be caused by aerosol cleansing inside the vortex. We also note that Russell et al. (2004) have compared SAGE and POAM aerosol optical depth (AOD)
5
with the NASA Ames Airborne Tracking Sunphotometer (AATS-14), which compares the SAGE and POAM measurements to an independent measurement. Russell et al. (2005) compare AATS-14 AOD to four SAGE and six POAM near-coincident (the SAGE and POAM profiles were not coincident with one another) profiles in January, 2003. POAM and SAGE AOD were determined from direct integration of the extinction
10
profiles. Russell et al. (2005) show that the AATS-14 one-micron optical-depth had a mean difference with respect to SAGE ((SAGE-AATS-14)/AATS-14) of −59.3%, but only −30% difference with respect to POAM. On the other hand, an analysis by Thoma-son et al. (2006) concludes that SAGE aerosol extinction values inside the vortex are not biased low, and that low extinction values are a product of geophysical process.
15
While the origin of the POAM/SAGE background aerosol extinction differences is be-yond the scope of this paper, the implications of this large bias for PSC detection with the two instruments must be understood because an important goal of this paper is to combine the two data sets to obtain more complete coverage of the polar vortex. In order to do this, in Fig. 5 we plot the SAGE and POAM extinction measurements
20
(black and red circles respectively) at 20 km as a function of measurement tempera-ture, inside the polar vortex in December, 2002, as well as the POAM and SAGE PSC extinction threshold (i.e. BG + 3 sigma) interpolated to 15 December 2002. In the warm-temperature/low-aerosol extinction regime, the bias indicated in Fig. 4 is clearly seen, yet in the low-temperature/high-aerosol extinction regime (PSC conditions) both
25
the SAGE and POAM data sets are in very good agreement. However, at temperatures between 0 K<T−TNAT<10 K the SAGE aerosol extinction values tend to increase with
1
ACPD
6, 11391–11426, 2006POAM and SAGE PSC observations during SOLVE II/VINTERSOL J. Alfred et al. Title Page Abstract Introduction Conclusions References Tables Figures ◭ ◮ ◭ ◮ Back Close Full Screen / Esc
Printer-friendly Version Interactive Discussion
EGU
decreasing temperature while those of POAM remain flat such that at relative temper-atures <0 K the two data sets agree very well, with both suggesting PSC activation at about the same temperature very near TNAT. Thus, the POAM/SAGE bias indicated in
Fig. 4 is a low aerosol extinction issue. The cause is not clear; however, we note that in such a low aerosol extinction environment, small systematic radiometric or
point-5
ing errors can result in large fractional aerosol extinction errors. As we have already noted, the SAGE data shown in Fig. 5 do indicate a slow increase in aerosol extinction in the 0 K<T−TNAT<10 K range. This may be the result of swelling of sulfate particles
as the ambient temperature decreases (Carslaw et al., 1994). Of course, in that case, the point at which the aerosol growth is sufficiently large to be designated a PSC is
10
somewhat arbitrary. It is not unreasonable to assume that the modest enhancements in aerosol extinction just above the TNAT temperature observed in the SAGE data set
is the result of the beginning of PSC activity that POAM does not detect. These small aerosol extinction enhancement PSCs would be detected in the SAGE data set. They would not be detected in the POAM data set, thus the lower SAGE threshold would
15
lead to more PSCs being detected by SAGE than by POAM. It is evident that, in devel-oping a consistent combined data set we therefore cannot use the instrument-specific PSC threshold values. If we are to use a common threshold value, we must then com-pensate for any bias between the two instruments. Because the BG of each instrument is interpolated to a daily value, we can calculate the average POAM-SAGE bias – the
20
difference between the POAM and SAGE BG – on a daily basis. To compensate for this bias, we add the POAM-SAGE bias to the SAGE data. In Fig. 5 we also show the bias-compensated SAGE data set (shown in black asterisks). The bias-compensated SAGE data now agree very well with the POAM data in the 0 K<T−TNAT<10 K
temper-ature range while the very good agreement at the low tempertemper-ature region remains.
25
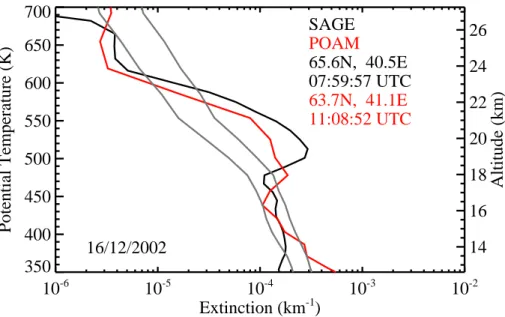
As an example to illustrate the combined POAM/ SAGE PSC detection approach developed here, in Fig. 6, we show the SAGE and POAM one-micron extinction profiles for a pair of coincident (separated by 3 h in time and 243 km in space) measurements conducted on 16 December 2002, in which a PSC was indicated for both POAM and
ACPD
6, 11391–11426, 2006POAM and SAGE PSC observations during SOLVE II/VINTERSOL J. Alfred et al. Title Page Abstract Introduction Conclusions References Tables Figures ◭ ◮ ◭ ◮ Back Close Full Screen / Esc
Printer-friendly Version Interactive Discussion
SAGE. The POAM in-vortex BG and the three-sigma extinction profiles (which are used as the PSC extinction threshold for both the POAM and SAGE data sets) interpolated to 16 December 2002 are also shown. It should be noted that, although the aerosol extinction is shown as a function of potential temperature, the PSC detection algorithm is conducted on the altitude grid native to the POAM and SAGE datasets (POAM data
5
are on an integer one-kilometer grid, while SAGE data are on a half-kilometer grid). The measurements agree very well, indicating a layer of enhanced extinction which exceeds the PSC threshold (and is therefore designated a PSC) from 460 to 575 K. The altitude of the peak of the aerosol extinction is also in good agreement in both measurements. However, in agreement with Fig. 5, outside of the PSC regime where
10
aerosol extinction is lower, the POAM aerosol extinction values tend to be larger than those of SAGE. The temperature screen in the PSC detection algorithm precluded the POAM measurements below 14 km from being a PSC.
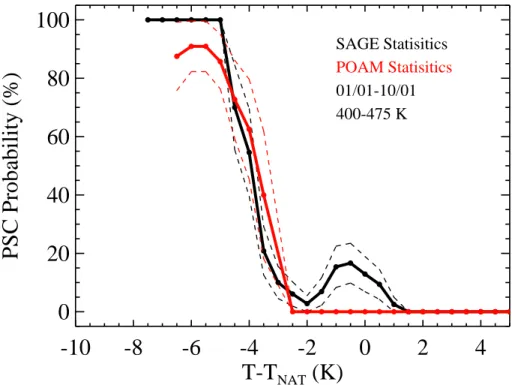
As a more comprehensive test of our combined POAM/SAGE PSC detection ap-proach in Fig. 7 we show the PSC observation probability as a function of ambient
15
temperature with respect to TNAT for the 400–475 K potential temperature range, from
1–10 January 2003 for SAGE and POAM separately (black and red curves respec-tively). For these calculations the data within the given time-range from each instrument were binned into two-Kelvin temperature bins. The occurrence probability is defined simply the number of observed PSCs inside the vortex divided by the total number
20
of observations, inside the vortex, within each bin. The temperature bins, while be-ing two-Kelvin wide, were calculated in overlappbe-ing half-Kelvin intervals to smooth the data, thus, each datapoint represents the probability for PSCs at temperatures within ±1 K of the indicated temperature. A probability was only calculated if the number of measurements within a given temperature bin was five or greater. The one-sigma
25
uncertainty level is plotted for both instruments in the dashed curves. To calculate the one-sigma uncertainty, we assume the PSC probability in a given bin follows a binomial distribution. The standard deviation of a binomial distribution is given by Bevington and
ACPD
6, 11391–11426, 2006POAM and SAGE PSC observations during SOLVE II/VINTERSOL J. Alfred et al. Title Page Abstract Introduction Conclusions References Tables Figures ◭ ◮ ◭ ◮ Back Close Full Screen / Esc
Printer-friendly Version Interactive Discussion EGU Robinson (1992) σ= pNp(1 − p) N , (1)
where σ is the calculated uncertainty for a given temperature bin, N is the number of observations in a given temperature bin and p is the PSC probability in a given tem-perature bin. It should be noted that the SAGE uncertainties are lower than those
5
of POAM as SAGE generally yields twice the number of observations due to its half-kilometer binning, compared to the one-half-kilometer binning of POAM. The SAGE and POAM PSC observation probabilities agree to within 20% through the entire tempera-ture range. This gives confidence that our PSC detection approach is consistent across both instruments.
10
3.2 PSC seasonal evolution
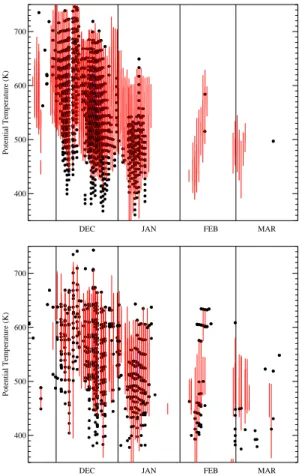
In Fig. 8 we show all PSCs obtained in both the SAGE and POAM datasets during the 2002/2003 NH winter. The increased density of SAGE PSC observations is the result of the fact that SAGE retrievals are reported on a 0.5 km grid, while the POAM version 4 retrievals are reported on a 1.0 km grid. The vertical bars in Fig. 8 denote the regions
15
of the atmosphere, at the location of each measurement, which were saturated with respect to NAT. That is, regions in which T<TNAT. TNAT values shown in Fig. 8, and
subsequent analyses were computed using POAM in-vortex monthly average water vapor measurements, obtained over the 2002/2003 NH winter, interpolated to a daily grid. The POAM water vapor measurements used in the calculation are not shown
20
here, but are similar to those obtained for the 1999/2000 winter shown in Bevilacqua et al. (2002). For HNO3mixing ratios, also needed in the TNAT calculation, we use the balloon-borne MARK IV (MKIV) measured profile obtained on 3 December 1999 from Kiruna Sweden (Coffey et al., 2003) with no time dependence. The MKIV instrument also made a measurement from Kiruna on 16 December 2002. However, in this study
25
ACPD
6, 11391–11426, 2006POAM and SAGE PSC observations during SOLVE II/VINTERSOL J. Alfred et al. Title Page Abstract Introduction Conclusions References Tables Figures ◭ ◮ ◭ ◮ Back Close Full Screen / Esc
Printer-friendly Version Interactive Discussion
evident in the 16 December 2002 measurement (Grooß et al., 2004). For reasons that will become clear in the next section, for the TNATcalculations used in this paper, it was
important to use a polar, early winter HNO3 profile, before irreversible denitrification
occurred.
Overall, in the 2002/2003 NH winter PSCs were notably abundant. In fact, over the
5
POAM data record, only in the 1999/2000 NH winter (SOLVE I) were more PSCs ob-served than in 2002/2003. However in the 1999/2000 winter, PSCs were obob-served extensively from mid-December through early February, and in late February through mid-March (Bevilacqua, et al., 2002), whereas-in the 2002/2003 winter, PSCs were pri-marily concentrated in the six-week period from early December through mid-January.
10
POAM observed PSCs in 151 profiles from 14 November to 21 March. SAGE ob-served PSCs in 122 measurements from 15 November to 18 March. Both instruments observe PSCs almost daily throughout the month of December through the middle of January. This is consistent with Fig. 2, which shows temperatures well below the TNAT throughout this period, and both POAM and SAGE sampling in the regions of the
cold-15
est air. Relatively few PSCs were observed by either instrument after mid-January. Figure 8 also shows the PSC altitudes tend to decrease from early December (where PSCs were observed by both SAGE and POAM at potential temperatures >700 K), through mid-January, coincident with the descent of sub-TNAT air. Poole et al. (2003)
and Spang et al. (2005) also note the decrease of PSC altitude in December. In early
20
December PSCs were observed at potential temperatures below 500 K although am-bient temperatures were above TNAT. These low altitude PSCs were likely the result of
early denitrification at higher altitudes which then precipitated HNO3to lower altitudes. In the presence of early denitrification HNO3concentrations would be elevated relative
to the fixed profile used to calculate the NAT saturation temperature. MKIV
measure-25
ments (Grooß et al., 2004) from 16 December 2002 suggest that denitrification had already occurred, and elevated nitric acid levels at 15 km were observed. Elevated nitric acid would raise the effective TNAT.
ACPD
6, 11391–11426, 2006POAM and SAGE PSC observations during SOLVE II/VINTERSOL J. Alfred et al. Title Page Abstract Introduction Conclusions References Tables Figures ◭ ◮ ◭ ◮ Back Close Full Screen / Esc
Printer-friendly Version Interactive Discussion
EGU
3.3 PSC composition
Strawa et al. (2002) use the relation between the extinction color ratio (1018 nm extinc-tion/603 nm extinction) and the 1018 nm extinction to distinguish POAM observed PSC from the 1999/2000 NH winter among three categories, type 1A (presumed to be solid crystalline in composition), type 1B (small liquid droplets), and undetermined/mixed.
5
This analysis has since been modified, by using the relation between the modified Angstrom exponent and the 1018 nm extinction (Strawa et al., in preparation). The new discrimination methodology has the advantage of using all of the POAM aerosol extinction channels rather than just two, and also adds a new category of mixed clouds, which are presumed to be a combination of type 1A and type 1B. The new analysis has
10
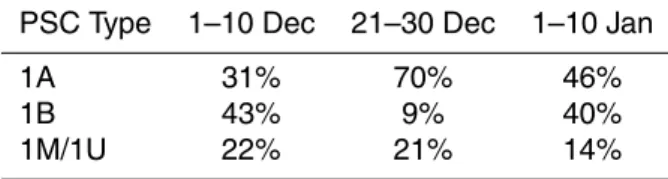
been applied to the 2002/2003 NH winter POAM PSC observations, and applied to SAGE observations as well. Table 1 summarizes the combined results for both SAGE and POAM for three ten-day periods in early December, late December and early Jan-uary over the 400–550 K potential temperature range. In general, the results show that, among the PSCs that were unambiguously characterized, the fraction of Type 1A
15
clouds increases in December to become the dominant PSC phase by the end of the month. At the same time, Type 1B clouds decrease dramatically in fractional abun-dance while the relative number of undetermined and mixed clouds remains relatively constant. In early January the Type 1A clouds decrease in frequency while the Type 1B cloud frequency increases back to near the early December levels.
20
4 PSC temperature relationship
4.1 PSC occurrence temperature: seasonal evolution
As noted above, Fig. 8 also shows the region of air saturated with respect to NAT. In or-der to determine the NAT saturation temperature in this calculation we use time-varying water vapor mixing ratios obtained from POAM measurements. However, for the HNO3
ACPD
6, 11391–11426, 2006POAM and SAGE PSC observations during SOLVE II/VINTERSOL J. Alfred et al. Title Page Abstract Introduction Conclusions References Tables Figures ◭ ◮ ◭ ◮ Back Close Full Screen / Esc
Printer-friendly Version Interactive Discussion
we use a fixed profile representative of early winter conditions. It can be readily seen that early in the first two weeks of December, PSCs are observed throughout the re-gions where the air is saturated with respect to TNAT. However, in February and March
when SAGE and POAM once again observe nominally NAT-saturated air, relatively few PSCs were observed.
5
To investigate PSC occurrence temperature and its evolution over the 2002/2003 winter in Fig. 9a and b we show the PSC observation probability as a function of tem-perature relative to TNAT (as described above in Sect. 3). In this analysis the data were binned in ten-day time bins beginning in early December, and the 400–475 K (Fig. 9a) and 475–550 K (Fig. 9b) potential temperature bins. These are both roughly 3 km
incre-10
ments ranging from approximately 16 to 22 km. This represents the range in which a sufficient number of PSCs were observed, over a large part of the winter, for statistical significance. In the calculations depicted in Fig. 9 we have combined the POAM and SAGE observations. The data sets have been combined to increase the sampling size, and thus the statistical significance of the results, and to increase the coverage of the
15
vortex relative to that obtained by either single instrument. The excellent agreement between the SAGE and POAM data sets illustrated in Figs. 5, 6 and (especially) 7 is taken here as justification for this approach.
There is a distinct shift to the left (lower temperatures) in the PSC probability curves in both potential temperature bins. In order to quantify this relative temperature shift,
20
we have calculated the area between the PSC probability from the first time bin (1–10 December), to each of the later time bins. Areas under the time-bins are calculated us-ing a five-point Newton-Cotes (Press et al., 1992) formula. We consider this approach to yield a more accurate representation of PSC occurrence temperature shifts than the approach taken by Bevilacqua et al. (2002), in which we simply used the temperature
25
at the 50% probability point, because it is averaged over all probabilities rather than one single value. The results of the temperature shift calculations are noted on Fig. 9a and b, and summarized in Table 3 (no temperature shift was calculated, in either po-tential temperature bin, for the 1–15 February time-bin because the probability never
ACPD
6, 11391–11426, 2006POAM and SAGE PSC observations during SOLVE II/VINTERSOL J. Alfred et al. Title Page Abstract Introduction Conclusions References Tables Figures ◭ ◮ ◭ ◮ Back Close Full Screen / Esc
Printer-friendly Version Interactive Discussion
EGU
reaches a high enough level for a reasonable area to be calculated). We find a 2.2 to 2.5 K decrease in PSC occurrence temperature, relative to the NAT saturation tem-perature, between the beginning of December and the beginning of January. Although there was not a sufficient number of PSC observations to make statistically meaningful calculations of PSC formation temperatures in the early February and late February/
5
early March time periods when POAM again observed cold air, the few observations do suggest that the PSC formation temperature remained suppressed at the end of the vortex season.
There are potentially several scenarios which could account for this shift toward lower PSC occurrence temperature as the season progresses, relative to the NAT saturation
10
temperature, illustrated in Fig. 10. These include: a change in the distribution of PSC composition (i.e. change in stable equilibrium temperatures of PSCs), a time-varying bias in the MetOffice analysis used the TNATcomputations, and irreversible dehydration
and/or irreversible denitrification. Next we discuss each of these.
As discussed in Bevilacqua et al. (2002), the approximately 4 K decrease in the Type
15
1B PSC formation temperature, relative to Type 1A for equivalent ambient conditions (Tabazadeh et al., 1994) means that a change in the relative abundance of Type 1A to 1B clouds as the season progresses will change the PSC formation temperature rela-tive to the NAT saturation temperature. In particular, an increase in the abundance of Type 1B clouds relative to Type 1A clouds will tend to decrease the formation
tempera-20
ture. Table 1 gives the relative abundance of Type 1A and 1B clouds for three ten-day periods in early December, late December, and early January for the 2002/2003 win-ter. Focusing on the early December and early January periods, as these exhibited the greatest temperature shift at all levels, these results suggest that the Type 1A/Type 1B ratio was higher in the later period than in early December. However, there was a large
25
amount of undetermined clouds in the early December period. The limiting assumption with regard to changes in PSC formation temperature because of composition changes would be to assume that the 22% undetermined/mixed clouds in early December be-haved thermodynamically as Type 1A clouds and the 14% undetermined/mixed in the
ACPD
6, 11391–11426, 2006POAM and SAGE PSC observations during SOLVE II/VINTERSOL J. Alfred et al. Title Page Abstract Introduction Conclusions References Tables Figures ◭ ◮ ◭ ◮ Back Close Full Screen / Esc
Printer-friendly Version Interactive Discussion
beginning of January behaved as Type 1B clouds. This limiting assumption implies a change in Type 1A/1B ratio from 53/47 in December to 46/54 in January. Assuming no Type 1A/1B bias in the POAM and SAGE data sets, this change in PSC composition would result in a 0.3 K lowering of the PSC formation temperature. This is an upper limit estimate. Because it is relatively small compared to the greater than 2 K observed
5
decrease in the net PSC formation temperature between early December and early January, we conclude that changes in PSC composition are unlikely to be responsible for the observed decrease.
In order to test for possible changes in the biases of the MetOffic temperatures over the measurement period we have conducted extensive comparisons between
MetOf-10
fice temperatures and Challenging Mini-Satellite Payload (CHAMP) Global Positioning System (GPS) radio occultation (Wang et al., 2004) version 005 temperatures. The GPS temperatures are an independent measurement, which are non-reliant on a-priori measurements below 30 km and have been extensively validated (Wickert et al., 2004). Table 2 summarizes the temperature bias for each of the five predefined time periods
15
at the 70 hPa (∼17 km) and 50 hPa (∼20 km). This analysis suggests the MetOffice temperatures become biased warm with respect to the CHAMP temperature measure-ments at both pressure heights. The small warming in the model temperature bias still lies within the one standard-deviation level of significance. An increase in the warm bias of the MetOffice temperatures would have the effect of PSC probabilities
20
increasing at warmer temperature as the season progresses, thus it is unlikely that the calculated decrease in PSC formation temperatures can be attributed to a time-varying bias in temperature.
NAT saturation temperature is highly dependent upon water vapor mixing ratio. As such, irreversible dehydration would have a significant effect in lowering TNAT.
Irre-25
versible dehydration occurs when ice clouds form and the ice crystals sediment out. It should be noted that the calculation of TNAT uses the POAM water vapor, which would
account for any large-scale dehydration, but an analysis of POAM water vapor mea-surements did not detect dehydration within the noise level of the meamea-surements (not
ACPD
6, 11391–11426, 2006POAM and SAGE PSC observations during SOLVE II/VINTERSOL J. Alfred et al. Title Page Abstract Introduction Conclusions References Tables Figures ◭ ◮ ◭ ◮ Back Close Full Screen / Esc
Printer-friendly Version Interactive Discussion
EGU
shown). Figure 3 suggests that on a few days in December, temperatures were be-low that of the ice saturation (approximately 7 K bebe-low TNAT) temperature, thus there exists a possibility that dehydration was a factor in decreasing the PSC observation probability as the season progressed. POAM aerosol extinction profiles exhibit a phe-nomenon know as a HiZmin in the presence of an ice PSC (Fromm et al., 1999). In the
5
2002/2003 NH winter none were observed. SAGE did not observe any HiZmin profiles either, however, Poole et al. (2003) show three measurements between 1–10 Decem-ber and three more between 11–20 DecemDecem-ber that appear to be ice PSCs. The fact that POAM did not unambiguously observe ice-PSCs, and that SAGE conducted only six measurements on two separate days that may have observed ice-PSCs, suggests
10
that if they were present, they would only have existed for a short period of time be-fore the growth of large ice crystals could occur and sediment out of the atmosphere. Nedoluha et al. (2002) show evidence of air parcels below ice saturation temperatures and supersaturated for greater than two days with no clear evidence of dehydration. Schiller et al. (2002) show evidence of local dehydration at levels of 0.5 ppmv in the NH
15
during the 1999/2000 winter. Meteorological conditions for the formation of ice PSCs in the 1999/2000 winter were more favorable than for the 2002/2003 winter. On a vortex wide scale, in 1999/2000 temperatures were observed below the ice saturation temper-ature (Tice) on a daily basis for three weeks in late December and early January (see
Fig. 2, Bevilacqua et al., 2002). Figure 3 does not suggest such a sustained,
uninter-20
rupted, time with temperatures below Tice, thus, even had dehydration occurred during
the 2002/2003 winter, dehydration levels would likely be less than those observed by Schiller et al in 1999/2000. If dehydration did occur, the maximum amount of decrease in water vapor would have been 0.5 ppmv. This small level of dehydration would result in a maximum decrease of the NAT saturation temperature of 0.4 K, which is less than
25
the random error in the temperature measurements. We conclude that dehydration had little to no effect on the shift of PSC occurrence temperature.
ACPD
6, 11391–11426, 2006POAM and SAGE PSC observations during SOLVE II/VINTERSOL J. Alfred et al. Title Page Abstract Introduction Conclusions References Tables Figures ◭ ◮ ◭ ◮ Back Close Full Screen / Esc
Printer-friendly Version Interactive Discussion
4.2 Inferring denitrification
Having largely eliminated all other possible scenarios to explain the observed greater than 2 K shift in PSC formation temperatures between early December and early Jan-uary, we conclude that this shift is most likely a manifestation of irreversible denitrifi-cation. This conclusion was also reached for the 1999/2000 winter by Bevilacqua et
5
al. (2002). Here we follow up by estimating the amount of irreversible denitrification that would be required to cause the observed shifts in PSC formation temperature. We invert the Hanson and Mauersburger (1988) formulation assuming a constant water va-por mixing ratio in order to determine the amount of HNO3mixing ratio change required
to produce changes in the NAT saturation temperature equal to the net PSC formation
10
temperature changes listed in Table 3. The results of these calculations are shown in Table 4. We find that in order to attribute the observed decreases in the net PSC formation temperature to decreases in TNAT resulting from denitrification would require HNO3 decreases of nearly 80% between early December and early January. If we
assume an upper bound of a 0.4 K uncertainty in the temperature shifts due to
unac-15
counted impacts from the factors listed in Sect. 4.1, this results in a 7–10% uncertainty in the inferred denitrification. Denitrification likely maximized at the end of December, as seen from Table 1 this is when 70% of PSCs were of Type 1A. As pointed out above, the evidence suggests that PSC formation temperature remained low through the re-mainder of the winter. This, in turn, suggests that vortex remained denitrified at the
20
levels found in early January through early March.
The levels of denitrification inferred above exceed the 50% (Voigt et al., 2005; Grooß et al., 2004) based upon in situ measurements from the High Altitude Gas AnalyseR (HAGAR) and SIOUX instruments. While this disagreement is large, Bevilacqua et al. (2002) showed good agreement from their inferred levels of denitrification with
in-25
situ measurements during the 1999/2000 winter. Repeating the technique outlined above with the POAM data from 1999/2000 produces results which are consistent with those of Bevilacqua et al. (2002), with inferred levels of denitrification between 75 and
ACPD
6, 11391–11426, 2006POAM and SAGE PSC observations during SOLVE II/VINTERSOL J. Alfred et al. Title Page Abstract Introduction Conclusions References Tables Figures ◭ ◮ ◭ ◮ Back Close Full Screen / Esc
Printer-friendly Version Interactive Discussion
EGU
80% at both the 16–18 and 19–21 km regions.
The levels of denitrification inferred for the 2002/2003 winter slightly exceed those inferred during the 1999/2000 winter, yet the 1999/2000 winter experienced lower tem-peratures, and experienced temperatures below TNAT for a longer period of time, than
that of 2002/2003. However, the month of December 2002, when most of the
denitri-5
fication occurred, was unique in that temperatures early in the season were cold at a broad altitude range. This may have allowed NAT particles to descend to much lower altitudes than in 1999/2000, thus premanenetly denitrifying a thicker layer than in that year and thereby producing a larger temperature shift in our 75 K layer PSC statistics.
5 Summary and conclusions
10
We have presented an overview of PSC measurements made by SAGE III and POAM III during the 2002/2003 NH winter. Throughout the SOLVE II/VINTERSOL winter SAGE observed PSCs in 122 one-micron aerosol extinction profiles, while POAM ob-served PSCs in 151 profiles. PSCs were first unambiguously obob-served on 15 Novem-ber 2002 with SAGE and 14 NovemNovem-ber 2002 with POAM. PSCs were observed
ex-15
tensively, and on a near-daily basis, from the end of November to January 15. After 4 February 2003, PSCs were again observed, but less frequently than the Decem-ber/January time period. The last PSC observed by SAGE was on 18 March 2003, and the last observed by POAM was on 21 March 2003. In early December PSCs were observed at potential temperatures from roughly 375 K to 750 K. Throughout
De-20
cember the top of this range decreases to near 600 K. In February and March, PSC observations were primarily constrained to potential temperatures below 500 K.
We have also shown good agreement using the Unified PSC detection methodology (Fromm et al., 2003) between SAGE and POAM. Extinction measurements at PSC levels of enhancement agree well qualitatively between the two instruments. PSC
oc-25
currence as a function of ambient temperature from SAGE and POAM agree well with one another.
ACPD
6, 11391–11426, 2006POAM and SAGE PSC observations during SOLVE II/VINTERSOL J. Alfred et al. Title Page Abstract Introduction Conclusions References Tables Figures ◭ ◮ ◭ ◮ Back Close Full Screen / Esc
Printer-friendly Version Interactive Discussion
We have calculated the PSC probability as a function of temperature. We conclude that variations in PSC probability are a result of irreversible denitrification. Denitrifi-cation occurred extensively throughout the month of December and into mid-January. We infer that the stratospheric air was irreversibly denitrified by 80% by early Jan-uary in both the 400–475 and 475–550 K potential temperature regimes. The lower
5
stratosphere likely remained denitrified through early-March. Most of the denitrification occurred in late December, when the preponderance of PSCs was Type 1A.
The refinement of the methodology of inferring denitrification from PSC observations from solar occultation measurements can serve as a valuable tool to estimate levels of denitrification using other platforms such as SAM II and SAGE I and SAGE II. This
10
could yield a valuable long-term Arctic denitrification record, and should be pursued. Acknowledgements. This work was supported by the NASA data purchase project and the
NASA SOSST project. SAGE III and POAM III data were obtained from the NASA Langley Research Center Atmospheric Sciences Data Center. MetOffice data were obtained from the NASA Goddard Space Flight Center. CHAMP temperature profiles were obtained from the
15
GeoForschungsZentrum Information System and Data Center.
References
Bevilacqua, R. M., Fromm, M. D., Alfred, J. M., Hornstein, J., Nedoluha, G. E., Hoppel, K. W., Lumpe, J. D., Randall, C. E., Shettle, E. P., Browell, E. V., Butler, C., D ¨ornbrack, A., and Strawa, A. W.: Observations and analysis of polar stratospheric clouds detected
20
by POAM III during the 1999/2000 Northern Hemisphere winter, J. Geophys. Res., 107, doi:10.1029/2001JD000477, 2002.
Bevington, P. R. and Robinson, D. K.: Data Reduction and Error Analysis for the Physical Sciences, McGraw-Hill, New York, 1992.
Carslaw, K., Luo, B. P., Clegg, S. L., Peter, Th., Brimblecombe, P., and Crutzen, P. J.:
Strato-25
spheric aerosol growth and HNO3gas phase depletion from coupled HNO3and water uptake by liquid particles, Geophys. Res. Lett., 21(23), 2479–2482, 1994.
ACPD
6, 11391–11426, 2006POAM and SAGE PSC observations during SOLVE II/VINTERSOL J. Alfred et al. Title Page Abstract Introduction Conclusions References Tables Figures ◭ ◮ ◭ ◮ Back Close Full Screen / Esc
Printer-friendly Version Interactive Discussion
EGU
Coffey, M. T., Mankin, W. G., Hannigan, J. W., and Toon, G. C.: Airborne spectroscopic obser-vations of chlorine activation and denitrification of the 1999/2000 winter Arctic stratosphere during SOLVE, J. Geophys. Res., 107, 8303, doi:10.1029/2001JD001085, (printed 108(D5), 2003), 2002.
Fromm, M. D., Lumpe, J. D., Bevilacqua, R. M., Shettele, E. P., Hornstein, J., Massie, S. T., and
5
Fricke, K. H.: Observations of Antarctic polar stratospheric clouds by POAM II: 1994–1996, J. Geophys. Res., 102, 23 659–23 672, 1997.
Fromm, M. D., Bevilacqua, R. M., Hornstein, J., Shettle, E., Hoppel, K., and Lumpe, J. D.: An analysis of POAM II Arctic polar stratospheric cloud observations, 1993–1996, J. Geophys. Res., 104, 24 341–24 357, 1999.
10
Fromm, M. D., Alfred, J. M., and Pitts, M.: A unified long-term, high-latitude strato-spheric aerosol and cloud database using SAM II, SAGE II and POAM II/III data: Algo-rithm description, database definition and climatology, J. Geophys. Res., 108(D12), 4366, doi:10.1029/2002JD002772, 2003.
Grooß, J.-U., G ¨unther, G., M ¨uller, R., Konopka, P., Bausch, S., Schlager, H., Voight, C., Volk,
15
C. M., and Toon, G. C.: Simulation of denitrification and ozone loss for the Arctic winter 2002/2003, Atmos. Chem. Phys., 5, 1437–1448, 2005.
Hanson, D. and Mauersberger, K.: Laboratory studies of the nitric acid trihydrate: Implications for the south polar stratosphere, Geophys. Res. Lett., 15, 855–858, 1988.
Manney, G. L., Kr ¨uger, K., Sabutis, J. L., Sena, S. A., and Pawson, S.: The remarkable 2003–
20
2004 winter and other recent warm winters in the Arctic stratosphere since the late 1990s, J. Geophys. Res., 110, D04107, doi:10.1029/2004JD005367, 2005.
NASA Langley Research Center, SAGE III algorithm theoretical basis document: Solar and lunar algorithm, Rep. LaRC 475-00-109, Vers. 2.1, Hampton Va., 2002.
Nash, E. R., Newman, P. A., Rosenfield, J. E., and Schoeberl, M. R.: An objective determination
25
of the polar vortex using Ertel’s potential vorticity, J. Geophys. Res., 101, 9471–9478, 1996. Nedoluha, G. E., Bevilacqua, R. M., and Hoppel, K. W.: POAM measurements of water vapor
in the Arctic and Antarctic, J. Geophys. Res., 107, doi:10.1029/2001JD001184, 2002. Poole, L. R. and Pitts, M. C.: Polar stratospheric cloud climatology based on Stratospheric
Aerosol Measurement II observations from 1978 to 1989, J. Geophys. Res., 99, 13 083–
30
13 089, 1994.
Poole, L. R., Trepte, C. R., Harvey, V. L., Toon, G. C., and VanValkenburg, R. L.: SAGE III observations of Arctic polar stratospheric clouds – December 2002, Geophys. Res. Lett.,
ACPD
6, 11391–11426, 2006POAM and SAGE PSC observations during SOLVE II/VINTERSOL J. Alfred et al. Title Page Abstract Introduction Conclusions References Tables Figures ◭ ◮ ◭ ◮ Back Close Full Screen / Esc
Printer-friendly Version Interactive Discussion
30(23), 2216, doi:10.1029/2003GL018496, 2003.
Press, W. H., Teukolsky, S. A., Vetterling, W. T., and Flannery, B. P.: Numerical Recipes in C: The Art of Scientific Computing, Second Edition, Cambridge University Press, 1992.
Russell, P., Livingston, J., Schmid, B., Eilers, J., Kolyer, R., Redemann, J., Ramirez, S., Yee, J.-H., Swartz, W., Shetter, R., Trepte, C., Risley Jr., A., Wenny, B., Zawodny, J., Chu, W.,
5
Pitts, M., Lumpe, J., Fromm, M., Randall, C., Hoppel, K., and Bevilacqua, R.: Aerosol optical depth measurements by airborne sun photometer in SOLVE II: Comparisons to SAGE III, POAM III and airborne spectrometer measurements, Atmos. Chem. Phys., 5, 1311–1339, 2005.
Schiller, C., Bauer, R., Cairo, F., Deshler, T., D ¨ornbrack, A., Elkins, J., Engel, A., Flentje, H.,
10
Larsen, N., Levin, I., M ¨uller, M., Oltmans, S., Ovarlez, J., Schreiner, J., Stroh, F., Voigt, C., and V ¨omel, H.: Dehydration in the Arctic stratosphere during the THESEO2000/SOLVE campaigns, J. Geophys. Res., 107, doi:1029/2001JD000463, 2002.
Spang, R., Remedios, J. J., Kramer, L. J., Poole, L. R., Fromm, M. D., M ¨uller, M., Baumgarten, G., and Konopka, P.: Polar stratospheric cloud observations by MIPAS on ENVISAT:
detec-15
tion method, validation and analysis of the northern hemisphere winter 2002/2003, Atmos. Chem. Phys., 5, 679–692, 2005.
Strawa, A. W., Drdla, K., Fromm, M., Pueschel, P. F., Hoppel, K. W., Browell, E. V., Hostetler, C. A., and Hamill, P.: Discriminating Type Ia and Ib Polar Stratospheric Clouds in POAM satellite data, J. Geophys. Res., 107(D20), 8291, doi:10.1029/2001JD000458, 2002.
20
Swinbank, R. and O’Neill, A.: A stratosphere-troposphere data assimilation system, Mon. Weather Rev., 122, 686–602, 1994.
Tabazadeh, A., Turco, R. P., Drdla, K., Jacobson, M. Z., and Toon, O. B.: A study of Type I polar stratospheric cloud formation, Geophys. Res. Lett., 21, 1619–1622, 1994.
Thomason, L. W. and Taha, G.: SAGE III aerosol extinction measurements: Initial results,
25
Geophys. Res. Lett., 30(12),1631, doi:10.1029/2003GL017317, 2003.
Thomason, L. W., Poole, L. R., and Randall, C. E.: SAGE III aerosol extinction validation in the Arctic winter: Comparisons with SAGE II and POAM III, Atmos. Chem. Phys. Discuss., accepted, 2006.
Voigt, C., Schlager, H., Luo, B. P., D ¨ornbrack, A., Roiger, A., Stock, P., Curtius, J., V ¨ossing,
30
H., Borrmann, S., Davies, S., Konopka, P., Schiller, C., Shur, G., and Peter, T.: Nitric Acid Trihydrate (NAT) formation at low NAT supersaturation in Polar Stratospheric Clouds (PSCs), Atmos. Chem. Phys., 5, 1371–1380, 2005.
ACPD
6, 11391–11426, 2006POAM and SAGE PSC observations during SOLVE II/VINTERSOL J. Alfred et al. Title Page Abstract Introduction Conclusions References Tables Figures ◭ ◮ ◭ ◮ Back Close Full Screen / Esc
Printer-friendly Version Interactive Discussion
EGU
Wang, D., Stiller, G. P., Clarmann, T., Fischer, H., L ´opez-Puertas, M., Funke, B., Glatthor, N., Grabowski, U., H ¨opfner, M., Kellmann, S., Kiefer, M., Linden, A., Tsidu, G. M., Milz, M., Steck, T., Jiang, J., Ao, C., Manney, G., Hocke, K., Wu, D. L., Romans, L. J., Wickert, J., and Schmidt, T.: Cross-validation of MIPAS/ENVISAT and GPS-RO/CHAMP temperature profiles, J. Geophys. Res., 109, D19311, doi:10.1029/2004JD004963, 2004.
5
Wickert, J., Schmidt, T., Beyerle, G., K ¨onig, R., Reigber, C., and Jakowski, N.: The Radio Occultation Experiment aboard CHAMP: Operational Data Analysis and Validation of Vertical Atmospheric Profiles, J. Met. Soc. Jap., 82(1B), 381–395, 2004.
ACPD
6, 11391–11426, 2006POAM and SAGE PSC observations during SOLVE II/VINTERSOL J. Alfred et al. Title Page Abstract Introduction Conclusions References Tables Figures ◭ ◮ ◭ ◮ Back Close Full Screen / Esc
Printer-friendly Version Interactive Discussion
Table 1. Relative change in PSC phase-type during the 2002/2003 winter. Type 1A and 1B are
as indicated, and mixed-phase and undetermined PSCs are labeled 1M/1U. PSC Type 1–10 Dec 21–30 Dec 1–10 Jan
1A 31% 70% 46%
1B 43% 9% 40%
ACPD
6, 11391–11426, 2006POAM and SAGE PSC observations during SOLVE II/VINTERSOL J. Alfred et al. Title Page Abstract Introduction Conclusions References Tables Figures ◭ ◮ ◭ ◮ Back Close Full Screen / Esc
Printer-friendly Version Interactive Discussion
EGU
Table 2. MetOffice-GPS temperature comparison in the stratosphere during the 2002/2003
winter. Values shown are mean MetOffice-GPS and standard deviation. Numbers in parenthe-ses correspond to the number of GPS profiles.
Pressure 1–10 Dec 21–30 Dec 1–10 Jan 11–20 Jan
Level (K) (K) (K) (K)
(hPa)
50 −0.32±1.1 (78) 0.66±1.3 (177) 0.43±1.1 (162) 0.89±1.5 (105) 70 −0.27±0.85 (66) 0.14±1.1 (123) −0.03±0.8 (109) 0.32±1.2 (93)
ACPD
6, 11391–11426, 2006POAM and SAGE PSC observations during SOLVE II/VINTERSOL J. Alfred et al. Title Page Abstract Introduction Conclusions References Tables Figures ◭ ◮ ◭ ◮ Back Close Full Screen / Esc
Printer-friendly Version Interactive Discussion
Table 3. Change in PSC occurrence temperature over the 2002/2003 winter. Temperature
shifts are relative to 1–10 December and indicate a shift to colder temperatures.
Potential Temperature Shift Temperature Shift Temperature Shift Temperature Shift
Temperature (K) (K) (K) (K)
Range 1–10 Dec 21–30 Dec 1–10 Jan 11–20 Jan
400–475 K 0 0.7 2.3 2.2
ACPD
6, 11391–11426, 2006POAM and SAGE PSC observations during SOLVE II/VINTERSOL J. Alfred et al. Title Page Abstract Introduction Conclusions References Tables Figures ◭ ◮ ◭ ◮ Back Close Full Screen / Esc
Printer-friendly Version Interactive Discussion
EGU
Table 4. Combined SAGE/POAM inferred denitrification over the 2002/2003 winter.
Potential Denitrification Percent Percent Percent Temperature (%) Denitrification Denitrification Denitrification
Range 1–10 Dec 21–30 Dec 1–10 Jan 11–20 Jan
400–475 K 0 38 80 78
ACPD
6, 11391–11426, 2006POAM and SAGE PSC observations during SOLVE II/VINTERSOL J. Alfred et al. Title Page Abstract Introduction Conclusions References Tables Figures ◭ ◮ ◭ ◮ Back Close Full Screen / Esc
Printer-friendly Version Interactive Discussion
60
65
70
75
80
Latitude
SAGE
POAM
DEC
JAN
FEB
MAR
Fig. 1. SAGE and POAM measurement latitudes for the 2002/2003 NH winter. The black curve
denotes the SAGE measurement latitude, and the red curve denotes that of POAM. Both in-struments sample a complete circle of longitude per day performing roughly 14 measurements per day.
ACPD
6, 11391–11426, 2006POAM and SAGE PSC observations during SOLVE II/VINTERSOL J. Alfred et al. Title Page Abstract Introduction Conclusions References Tables Figures ◭ ◮ ◭ ◮ Back Close Full Screen / Esc
Printer-friendly Version Interactive Discussion EGU
50
60
70
80
90
Equivalent Latitude
DEC
JAN
FEB
MAR
Fig. 2. The equivalent latitude of each SAGE (black symbols) and POAM (red symbols)
mea-surement interpolated to the 500 K potential temperature surface. The Nash vortex edge is shown in the three blue curves, with the upper, middle and lower curves representing the inner, middle and outer vortex edges respectively.
ACPD
6, 11391–11426, 2006POAM and SAGE PSC observations during SOLVE II/VINTERSOL J. Alfred et al. Title Page Abstract Introduction Conclusions References Tables Figures ◭ ◮ ◭ ◮ Back Close Full Screen / Esc
Printer-friendly Version Interactive Discussion -15 -10 -5 0 5 10 T - T NAT (K)
Vortex
POAM Lat
SAGE Lat
DEC
JAN
FEB
MAR
Fig. 3. Time series of the minimum T−TNAT over the 10–150 hPa range for the 2002/2003 NH winter. The blue curve denotes the minimum temperature over the entire vortex, the black curve over a two-degree latitude band around the SAGE measurement latitude, and the red curve over a two-degree latitude band around the POAM measurement latitude. The shaded grey area denotes the range of vortex-wide minima over the 1994 to 2004 winters.
ACPD
6, 11391–11426, 2006POAM and SAGE PSC observations during SOLVE II/VINTERSOL J. Alfred et al. Title Page Abstract Introduction Conclusions References Tables Figures ◭ ◮ ◭ ◮ Back Close Full Screen / Esc
Printer-friendly Version Interactive Discussion EGU
10
-610
-510
-410
-3Extinction (km
-1)
10
15
20
25
Altitude (km)
SAGE
POAM
15/12/2002
Fig. 4. The inside-the-vortex POAM BG extinction (lower red curve), and BG + three-sigma
threshold (upper red curve) interpolated to 15 December 2002 are shown. The inside-the-vortex SAGE BG (lower black curve) and SAGE BG + three-sigma threshold (upper black curve) are also shown, interpolated to the same day. The difference between the POAM and SAGE curves illustrates the disagreement between the two measurements inside the vortex.
ACPD
6, 11391–11426, 2006POAM and SAGE PSC observations during SOLVE II/VINTERSOL J. Alfred et al. Title Page Abstract Introduction Conclusions References Tables Figures ◭ ◮ ◭ ◮ Back Close Full Screen / Esc
Printer-friendly Version Interactive Discussion
-10
0
10
20
T - T
NAT(K)
10
-510
-410
-310
-2Extinction (km
-1)
Fig. 5. SAGE (black circles) and POAM (red circles) one-micron extinction measurements
at 20 km, inside the polar vortex in December 2002. SAGE bias-compensated extinctions are shown in black asterisks. The bias compensation is the daily difference between the POAM and SAGE BG. The two solid black lines indicate the SAGE (lower) and POAM (upper) extinction threshold (i.e. BG + 3 sigma) for PSC detection interpolated to 15 December 2002.
ACPD
6, 11391–11426, 2006POAM and SAGE PSC observations during SOLVE II/VINTERSOL J. Alfred et al. Title Page Abstract Introduction Conclusions References Tables Figures ◭ ◮ ◭ ◮ Back Close Full Screen / Esc
Printer-friendly Version Interactive Discussion EGU 10-6 10-5 10-4 10-3 10-2 Extinction (km-1) 350 400 450 500 550 600 650 700 Potential Temperature (K) 14 16 18 20 22 24 26 Altitude (km) SAGE POAM 65.6N, 40.5E 07:59:57 UTC 63.7N, 41.1E 11:08:52 UTC 16/12/2002
Fig. 6. SAGE and POAM one-micron extinction profiles of an observed PSC on 16 December
2002, plotted as a function of potential temperature (altitude is shown on the right axis for reference). The black curve denotes the SAGE profile, and the red curve denotes the POAM profile. The two measurements were separated by roughly 243 km in space and three hours in time. The POAM BG (lower gray curve) and BG + three-sigma (upper gray curve) are shown. Both the SAGE and POAM profiles show a PSC where the extinction exceeds the PSC detection threshold, and likely depict the same PSC. The PSC detection algorithm did not detect a PSC in the POAM extinction profile below 400 K, as the collocated temperature was more than 5 K above TNAT.
ACPD
6, 11391–11426, 2006POAM and SAGE PSC observations during SOLVE II/VINTERSOL J. Alfred et al. Title Page Abstract Introduction Conclusions References Tables Figures ◭ ◮ ◭ ◮ Back Close Full Screen / Esc
Printer-friendly Version Interactive Discussion
-10
-8
-6
-4
-2
0
2
4
T-T
NAT(K)
0
20
40
60
80
100
PSC Probability (%)
SAGE Statisitics POAM Statisitics 01/01-10/01 400-475 KFig. 7. PSC observation probability is shown as a function of TNATfor both SAGE (black curve) and POAM (red curve), in the 400–475 K potential temperature level. The one-sigma level of uncertainty, calculated assuming a binomial distribution, is shown in dashed lines. For these calculations the data were binned in two-Kelvin temperature bins and calculated on a half-Kelvin grid. PSC probability is defined as the number of PSCs observed in a bin divided by the total number of measurements in that bin. PSC probability is only shown for temperature bins containing a minimum of five measurements.
ACPD
6, 11391–11426, 2006POAM and SAGE PSC observations during SOLVE II/VINTERSOL J. Alfred et al. Title Page Abstract Introduction Conclusions References Tables Figures ◭ ◮ ◭ ◮ Back Close Full Screen / Esc
Printer-friendly Version Interactive Discussion EGU 400 500 600 700 Potential Temperature (K)
DEC JAN FEB MAR
400 500 600 700
Potential Temperature (K)
DEC JAN FEB MAR
Fig. 8. The seasonal evolution of PSCs observed by SAGE and POAM plotted as a function of
potential temperature and time over the 2002/2003 NH winter. Black dots denote the potential temperature and date of an observed PSC. Red vertical lines denote regions where the ambient air was saturated with respect to NAT. Blue vertical lines denote regions where the ambient air was saturated with respect to ice.
ACPD
6, 11391–11426, 2006POAM and SAGE PSC observations during SOLVE II/VINTERSOL J. Alfred et al. Title Page Abstract Introduction Conclusions References Tables Figures ◭ ◮ ◭ ◮ Back Close Full Screen / Esc
Printer-friendly Version Interactive Discussion -10 -8 -6 -4 -2 0 2 4 T-TNAT (K) 0 20 40 60 80 100 PSC Probability (%) Date Range 01/12-10/12 21/12-30/12 01/01-10/01 11/01-20/01 01/02-15/02 Combined SAGE/POAM 475-550 K Temp Shift 0.0 0.7 2.4 2.5 -10 -8 -6 -4 -2 0 2 4 T-TNAT (K) 0 20 40 60 80 100 PSC Probability (%) Date Range 01/12-10/12 21/12-30/12 01/01-10/01 11/01-20/01 01/02-15/02 Combined SAGE/POAM 400-475 K Temp Shift 0.0 0.7 2.3 2.2
Fig. 9. The SAGE and POAM combined PSC observation probability as a function of T−TNAT. The data were binned in two separate potential temperature bins as indicated. Five different time bins are shown, as indicated by the start day and end day in months and days. For these calculations the data from each time bin were binned in two-Kelvin temperature bins and calculated on a half-Kelvin grid. PSC probability is defined as the number of PSCs observed in a bin divided by the total number of measurements in that bin. PSC probability is only shown for temperature bins containing a minimum of five measurements. There is a clear shift towards PSC occurrence at colder temperatures as the winter progresses. The magnitude of the shifts in PSC formation temperatures for each date-range relative to the 1–10 December period are indicated for each subsequent date-range. The PSC formation temperature shifts are calculated from the difference in the area of a given time-bin relative to the 1–10 December