HAL Id: hal-02993401
https://hal.archives-ouvertes.fr/hal-02993401
Submitted on 6 Nov 2020
HAL is a multi-disciplinary open access
archive for the deposit and dissemination of
sci-entific research documents, whether they are
pub-lished or not. The documents may come from
teaching and research institutions in France or
abroad, or from public or private research centers.
L’archive ouverte pluridisciplinaire HAL, est
destinée au dépôt et à la diffusion de documents
scientifiques de niveau recherche, publiés ou non,
émanant des établissements d’enseignement et de
recherche français ou étrangers, des laboratoires
publics ou privés.
Implications
Jian Ren, X Zheng, David Valls-Gabaud, Pierre-Alain Duc, Eric Bell,
Zhizheng Pan, Jianbo Qin, D Shi, Man Qiao, Yongqiang He, et al.
To cite this version:
Jian Ren, X Zheng, David Valls-Gabaud, Pierre-Alain Duc, Eric Bell, et al.. Long Tidal Tails in
Merg-ing Galaxies and Their Implications. MNRAS, 2020, 000 (3), pp.1 - 11. �10.1093/mnras/staa2985�.
�hal-02993401�
Long Tidal Tails in Merging Galaxies and Their Implications
Jian Ren,
1,2
?
X. Z. Zheng,
1,2
?
David Valls-Gabaud,
3
Pierre-Alain Duc,
4
Eric F. Bell,
5
Zhizheng Pan,
1,2
Jianbo Qin,
1,2
D. D. Shi,
1,2
Man Qiao,
1,2
Yongqiang He,
1,2
Run Wen
1,2
1Purple Mountain Observatory, Chinese Academy of Sciences, 10 Yuanhua Road, Nanjing 210023, China 2School of Astronomy and Space Sciences, University of Science and Technology of China, Hefei 230026, China 3LERMA, CNRS, PSL, Observatoire de Paris, 61 Avenue de l’Observatoire, 75014 Paris, France
4Observatoire Astronomique de Strasbourg, Université de Strasbourg, CNRS, 11 Rue de l’Université, F-67000 Strasbourg, France 5Department of Astronomy, University of Michigan, 1085 South University Avenue, Ann Arbor, MI 48109, USA
Accepted XXX. Received YYY; in original form ZZZ
ABSTRACT
We investigate the properties of long tidal tails using the largest to date sample of 461 merging galaxies withlog(M∗/M ) ≥ 9.5 within 0.2 ≤ z ≤ 1 from the COSMOS survey in
combi-nation with Hubble Space Telescope imaging data. Long tidal tails can be briefly divided into three shape types: straight (41 per cent), curved (47 per cent) and plume (12 per cent). Their host galaxies are mostly at late stages of merging, although 31 per cent are galaxy pairs with projected separations d > 20 kpc. The high formation rate of straight tidal tails needs to be understood as the projection of curved tidal tails accounts for only a small fraction of the straight tails. We identify 165 tidal dwarf galaxies (TDGs), yielding a TDG production rate of 0.36 per merger. Combined with a galaxy merger fraction and a TDG survival rate from the literature, we estimate that ∼ 5 per cent of local dwarf galaxies are of tidal origin, suggesting the tidal formation is not an important formation channel for the dwarf galaxies. More than half of TDGs are located at the tip of their host tails. These TDGs have stellar masses in the range of7.5 ≤ log(M∗/M ) ≤ 9.5 and appear compact with half-light radii following the
M∗- Rerelation of low-mass elliptical galaxies. However, their surface brightness profiles are
generally flatter than those of local disc galaxies. Only 10 out of 165 TDGs have effective radii larger than 1.5 kpc and would qualify as unusually bright ultra-diffuse galaxies. Key words: galaxies: evolution – galaxies: interactions – galaxies: tidal tails – galaxies: dwarf
1 INTRODUCTION
In the Λ Cold Dark Matter (ΛCDM) cosmological model, cos-mic structure and dark matter haloes grow in a hierarchical man-ner, placing galaxy mergers as major drivers of galaxy formation and evolution (e.g. Hopkins et al. 2006). The mergers of galax-ies not only drive the ex situ mass growth to form more mas-sive galaxies (e.g. Bundy et al. 2009;Fakhouri, Ma &
Boylan-Kolchin 2010;Oser et al. 2010;Moustakas et al. 2013;
Rodriguez-Gomez et al. 2016;Martin et al. 2017), but also invoke
gravita-tional torques/disruption to shape the kinematic and physical prop-erties of the merger remnants (e.g.Hopkins et al. 2007;Ellison et
al. 2013;De Propris et al. 2014;Thorp et al. 2019). The past two
decades have witnessed significant progress in our understanding of galaxy merger rate across cosmic age both observationally (
Pat-ton et al. 2002;Conselice et al. 2003b;Lin et al. 2004;Lotz et al.
2008a;Jogee et al. 2009;Robaina et al. 2009;Lotz et al. 2011;Xu
et al. 2012;Man, Zirm & Toft 2016;Wen & Zheng 2016;Mantha
? E-mail: [email protected] (JR); [email protected] (XZZ)
et al. 2018) and theoretically (Stewart et al. 2009;Hopkins et al.
2010b;Fakhouri, Ma & Boylan-Kolchin 2010;Rodriguez-Gomez
et al. 2015). Recently, more efforts have turned to characterizing
galaxy mergers of different types and their essential roles in regu-lating the evolution of galaxies over a wide range of properties.
Galaxy mergers are often classified into different types in terms of the properties of the merging galaxies, such as their mass ratio (major versus minor;Bournaud, Jog & Combes 2005;Lotz et
al. 2010,2011;Ownsworth et al. 2014) and gas fraction (wet versus
dry;Bell et al. 2006;Lin et al. 2008). Major mergers, often defined
by a mass ratio of m/M >0.3, have been widely studied in both simulations and observations. As the most violent process of galaxy interactions, major mergers trigger intense star formation (Sanders
& Mirabel 1996;Mihos & Hernquist 1996;Teyssier, Chapon &
Bournaud 2010), in at least some cases ignite active galactic
nu-clei (AGNs) (Sanders et al. 1988;Bahcall et al. 1997;Treister et
al. 2012;Barrows et al. 2017;Ricci et al. 2017) and induce
mor-phological transformation from discs into spheroids (e.g.Barnes
1992;Genzel et al. 2001;Naab & Burkert 2003;Lotz et al. 2008b;
Bournaud et al. 2011).
In contrast, minor mergers occur more often than major
ers and supply stars and gas into the primary galaxies. Observa-tional evidence suggests that minor mergers are dominantly respon-sible for the size growth of massive galaxies (e.g.Newman et al.
2012;Bluck et al. 2012;Hilz, Naab & Ostriker 2013) and for
trig-gering star formation in at least the nearby universe (Kaviraj 2014). The minor mergers might even induce morphological transforma-tion through disc instabilities for z >1 galaxies (e.g.Welker et al.
2014).
Gas-rich mergers behave very differently from gas-poor merg-ers. At least some mergers drive gas inflows which fuel star forma-tion and can trigger AGN activity. These gas inflows are expected to be important in influencing the growth of bulges (Hopkins et al.
2009,2010a), but the relationship between merger parameters and
bulge growth is far from straightforward (Bell et al. 2017;Gargiulo
et al. 2019). Disc survival and regrowth is expected to be impacted
by gas content also, where even gas-rich major mergers are pre-dicted to lead to disc-dominated remnants (Robertson et al. 2006).
On the contrary, dry mergers of gas-poor galaxies proceed with dissipationless processes and sustain little star formation, be-ing a key driver of the mass growth and structural evolution of mas-sive elliptical galaxies (van Dokkum 2005;Bell et al. 2006) and the Brightest Cluster Galaxies (BCGs) at z <1 (e.g.Lin et al. 2013). Moreover, the internal structure and orbital parameters (prograde versus retrograde) of the merging galaxies also influence the prop-erties of the post-merger galaxies (Darg et al. 2010;Martin et al. 2018). A comprehensive picture of shaping the detailed properties of present-day galaxies is still lacking.
Indeed, tidal features generated in a galaxy merger strongly depend on the mass ratio, gas fraction, internal structure and or-bital parameters of the merging galaxies, and thus can be used to characterize the merger (Duc & Renaud 2013;Barnes 2016). For instance, bridges and long tidal tails can be generated in ma-jor mergers between equal-mass discs (Toomre & Toomre 1972;
Barnes 1992), and tidal streams are often produced in the minor
merger events such that satellite galaxies fall into a more massive galaxy (Martínez-Delgado et al. 2010). Such tidal features are fre-quently detected around massive galaxies, tracing the merger events happened in the recent past (Duc et al. 2015;Morales et al. 2018;
Hood et al. 2018;Kado-Fong et al. 2018). In particular, long tidal
tails are exclusively created in the major mergers involving disc galaxies with preferentially prograde orbits (Struck & Smith 2012;
Duc & Renaud 2013). The shape of tidal tails may be influenced
by the shape of the gravitational potential wells and underlying dark matter haloes.Dubinski, Mihos & Hernquist(1996) showed through simulations that galaxies with a low halo-to-disc mass ra-tio can produce long tidal tails in the merging process.Springel &
White(1999) further pointed out that long tidal tails can be
gener-ated when the halo spin in sufficiently large for merging galaxies with a high halo-to-disc ratio. Moreover, using TDGs on tidal tails,
Bournaud, Duc & Masset (2003) found that dark matter haloes
around spiral galaxies are at least ten times larger than the stellar discs. Therefore, long tidal tails are useful probes for dark matter halo parameters and galaxy structures. The characteristics of tidal tails are affected by the orbital parameters, disc orientations as well as stellar and gas masses and the specific angular momentum of the merging galaxies (Struck & Smith 2012;Ploeckinger et al. 2018). Long tidal tails from mergers of disc galaxies thus provide hints on the orientation between their spin and orbital parameters.
Moreover, star clusters and tidal dwarf galaxies (TDGs) can be formed in tidal tails (Barnes & Hernquist 1992;Bournaud &
Duc 2006;Wetzstein, Naab & Burkert 2007). Previous
observa-tional studies of TDGs focused on individual objects or small
sam-ples (Duc et al. 2000;Duc & Mirabel 1998;Hancock et al. 2009;
Mohamed, Reshetnikov & Sotnikova 2011;Kaviraj et al. 2012). A
systematic investigation of tidal tails using a sufficiently large sam-ple of merging galaxies is required to address how the tidal tails are created in reality, draw constraints on how spiral galaxies merge with each other in the cosmic web, and examine the formation of TDGs and star formation under these extreme conditions.
Although there have been many simulations to study the mor-phology of merging galaxies and tidal tails. However, it is not clear how many shapes real tidal tails have, how do they relate to the merger parameters and how they are formed. At the same time, solving the problem of the relationship between the TDG formed in the tidal tail and the shape of the tidal tail will help understanding merging processes and star formation in tidal tails.
In this work, we analyse a sample of 461 merging galaxies with long tidal tails (defined as having sizes comparable to the ef-fective radii of the host galaxy,Wen & Zheng 2016) to character-ize tidal tails as well as their parent galaxies. We briefly introduce the sample and data in Section2. Section3presents our analysis and results and we discuss the implications in Section4. Through out this paper, we adopt a concordance cosmology of H0 = 70 km s−1Mpc−1, Ωm = 0.3 and ΩΛ= 0.7. All photometric
magni-tudes are given in the AB system.
2 SAMPLE AND DATA
We adopt the sample of 461 long-tidal-tail merging galaxies (LTTGs) in the COSMOS field fromWen & Zheng(2016). They identified these LTTGs using Hubble Space Telescope (HST)/ACS F814W (I) imaging data and multi-band deep survey data and cat-alogs in COSMOS (e.g.Leauthaud et al. 2007;Capak et al. 2007). The HST/ACS F814W science images have a scale of 0.0003 per pixel and reach a limiting magnitude limit of 25.6 mag for extended sources within a circular aperture radius of 0.003. The Full Width at Half Maximum (FWHM) of the point-spread function (PSF) of the F814W images is 0.0009, corresponding to a physical size of 297 pc at z = 0.2 and of 723 pc at z = 1 (Koekemoer et al. 2007). The HSTimaging data cover an area of 1.64 deg2 and provide high-resolution morphological information in the rest-frame optical for galaxies at z <1. The stellar mass and photometric redshift cata-logs come fromMuzzin et al.(2013), based on the UltraVISTA sur-vey, providing a total of 154,803 Ks-band-detected sources down to
5 σ= 23.4 mag with a 90 per cent completeness for point sources.
In Wen & Zheng (2016), a morphological classification
method, namely the AO-DO method, was used to select LTTGs.
As a non-parametric method for galaxy morphology, the AO-DO
method is dedicated to probing asymmetric structures in the out-skirts of a galaxy (Wen, Zheng & An 2014). In the method, the im-age of a galaxy is divided into two parts, the inner half-light region (IHR) and the outer half-light region (OHR). Each region contains half the total flux of the galaxy. Two parameters are used: the outer asymmetry, AO, measures the asymmetry of OHR and the outer
centroid deviation, DO, measures the deviation (or offset) between
the flux-weighted centroids of the IHR and the OHR. The parame-ters are sensitive to the asymmetric structures in the outskirts such as long tidal tails. Galaxies with more disturbed morphologies tend to have higher AOand DO. In practice, AOis calculated using the formula:
AO=
Í |I0− I180| −δ2 Í |I0| −δ1
, (1)
Figure 1. Distribution of nuclear separation distance in our sample merging galaxies. The distance set as zero is for galaxies with a single nucleus, as shown in the red bar. The blue bars show the distribution for two-nucleus galaxies. For the systems with more than two nuclei, the smallest separa-tion distance is adopted. The blank, half-shaded and filled regions represent contributions from0.2 < z < 0.39, 0.39 < z < 0.64 and 0.64 < z < 1.0 respectively, so that they correspond to the same time interval of 1.8 Gyr.
represents the180◦-rotation version of I0; I0-I180yields the resid-ual image; δ1 and δ2are corrections for the noise contributions to
the flux image I0and the residual image I0-I180, respectively. The outer centroid deviation DOis measured as below:
DO= p (xO− xI)2+ (y O− yI)2 Re f f , (2)
where (xI, yI) and (xO,yO) refer to the flux-weighted centroid po-sition of the IHR and of the OHR in pixels, respectively, and Re f f is the normalized effective radius in pixels estimated using Re f f = pnc/π. Here nc is the area in pixels of the IHR. More
details about the method can be found inWen, Zheng & An(2014). Two steps were adopted for identifying LTTGs in Wen &
Zheng(2016). Firstly, they pre-selected 13,227 galaxies with
mor-phologies showing a certain degree of disturbance using the AO
-DOmethod from 35,076 galaxies withlog(M∗/M ) ≥ 9.5 within
0.2 ≤ z ≤ 1 in the COSMOS field. Secondly, the 13,227 candi-dates were visually examined using the HST/ACS F814W science images. A total of 461 merging galaxies were identified with long tidal tails. SeeWen & Zheng(2016) for more details about the sam-ple selection. We use this samsam-ple to analyse their morphologies and the substructures of their tidal tails.
3 ANALYSIS AND RESULTS
Using HST/ACS F814W imaging data, we characterize the mor-phological properties of our sample LTTGs, including the nuclear separation distance, the shape and length of tidal tails and substruc-tures of tidal tails such as clumps, TDGs and gaps.
3.1 Nuclear Separation Distance of Merging Galaxies Simulations show that the growth of tidal tails is closely coupled with the orbital parameters and the merging stage of a galaxy merger (Toomre & Toomre 1972;Barnes 1992). In a general merg-ing process, two galaxies approach each other, pass their pericentre, and undergo a damped oscillation with dynamical friction allowing the galaxies to lose energy and angular momentum, while violent relaxation happening in the final stages as they merge into a single remnant. A close passage of one galaxy next to the other would
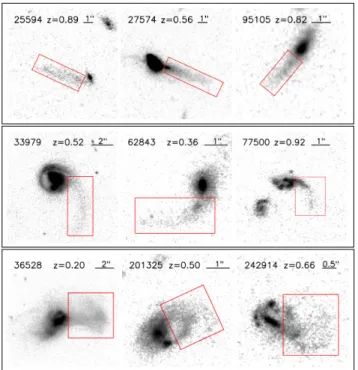
Figure 2. Example HST F814W images of three types of tidal tails in our sample: straight (top), curved (middle) and plume (bottom). The image size, target ID and redshift are labelled on each image. Red boxes mark the tidal tails.
lead to varying gravitational forces across the extended galaxies. The sides of the galaxies facing each other are more attracted than the opposite sides (Duc & Renaud 2013). This effect allows galax-ies to produce a long tidal tail and a short counter tail during the merging process. The nuclear separation distance is a crude tracer of the merging stage, although the separation oscillates a bit before the final collision. In particular, after the first pass the nuclear sepa-ration distance increases but the two galaxies appear different from the approaching pair before the first pass. The merging galaxies af-ter the first pass are strongly disturbed and thus can be distinguished from the galaxy pair in the beginning of merging without apparent tidal features (e.g., tidal tails).
If tidal tails are associated with the remnant of a previous merger event, the nuclear separation distance in the ongoing merger is irrelevant with the status of the tidal tails. We argue that such cases should be rare and have marginal effects on our analysis, con-sidering that massive galaxies statistically underwent even less than one major merger event over 8 Gyrs (e.g.,Jogee et al. 2009).
We measure the nuclear separation distance (d) from the HST images of our sample galaxies. For galaxy pairs, it is easy to find the centre of merging galaxies. For galaxies in their late merger phase, we use the method fromCui et al.(2001) to find galactic nuclei. We visually examine the light distribution of a merging system to find the core of the merging galaxies. If there is a dust lane, the single nucleus of a galaxy could be mistaken as a double-nucleus galaxy. In this sample, dust lanes are found in only a few merging galaxies in the final stage. If a galactic core is obscured by a dust lane, then we count it as a single core. Note that some sample galaxies contain only a single galactic nucleus, being most likely in the final stage of the merging process. We set d= 0 for these single-nucleus mergers. In contrast, two nuclei are distinguishable even in a merger remnant with disturbed morphology. We refer such systems to as merger remnants with d <5 kpc. On the other hand, 8 per cent of our sam-ple merging systems contain more than two galaxies (or galactic
Figure 3. Histogram of tail lengths for three types of tidal tails. The total number is 192, 213 and 56 for straight, curved and plume, respectively. The data bin width is 5 kpc and data bars are placed at the centre of correspond-ing data bins. Red and blue bars are shifted for clarification. The blank, half-shaded and filled regions represent contributions from0.2 < z < 0.39, 0.39 < z < 0.64 and 0.64 < z < 1.0 respectively, so that they correspond to the same time interval of 1.8 Gyr.
nuclei) with d < 30 kpc. For these multiple-galaxy merging sys-tems, the smallest separation distance to the galaxy with long tidal tails is taken as the nuclear separation distance.
Figure1shows the distribution of the measured nuclear sep-aration distance for our 461 sample LTTGs. The uncertainties of our measurements of the nuclear separation distance are typically 10 per cent, and increase at decreasing separation. The typical phot-zerror (δz/(1+ z) ∼ 0.013 at z < 1.5) induces negligible uncer-tainties in size measurement (0.05 kpc in the transverse distance at 1" at z = 1). Our sample consists of 98 (21 per cent) single-nucleus mergers, and 90 (20 per cent) mergers with d < 5 kpc, 128 (28 per cent) close pairs with 5 ≤ d ≤ 20 kpc, and 145 (31 per cent) galaxy pairs with d >20 kpc. It is clear that the long tidal tails are mostly associated with the merging galaxies in the later stages (d <20 kpc). This is not surprising because long tidal tails are caused by strong interactions. For the galaxy pairs with 20 < d < 55 kpc, we suspect that these galaxy pairs have under-gone the first pass as the long tidal tails can be seen as a sign of violent interaction. Simulations indicate that long tidal tails can be visible over ∼1 Gyr, mostly between the first pass and the final co-alescence in the observations similar to these adopted here (Barnes
1992;Lotz et al. 2008b;Ji, Peirani & Yi 2014). Roughly speaking,
the phase with d > 20 kpc accounts for 50 per cent of the time-scale, while the phase with d < 5 kpc represents 35 per cent (Ji,
Peirani & Yi 2014). Considering the projection effect, a large
frac-tion of widely-separated merger pairs (d >20 kpc) may appear as 5 ≤ d ≤ 20 kpc. The three bins of d < 5 kpc, 5 ≤ d ≤ 20 kpc and d> 20 kpc account for roughly 30, 30 and 40 per cent of the long-tail-visible time-scale. We thus conclude that the results shown in Figure1are globally consistent with the time-scales given by the simulations, although the uncertainties of time-scales are large.
3.2 The Shape of Tidal Tails
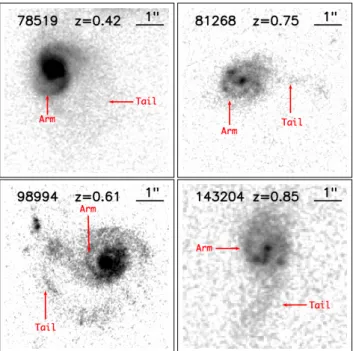
We visually examine the shapes of long tidal tails in our sample galaxies. A pair of tidal tails is often generated by one disc galaxy while merging. Due to the projection effect and low surface bright-ness of counter tails, only one tidal tail is visible in some cases. Moreover, we note that the shape of a tidal tail seen from the HST image is not the same as the configuration in the real space. Three of us (J.R., M.Q. and R.W.) independently classified the
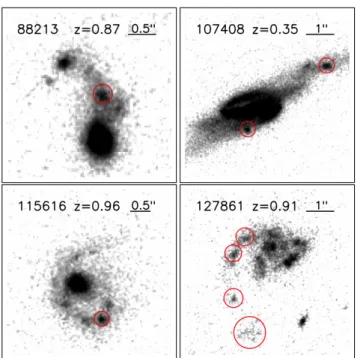
morpholo-Figure 4. Clumps on the tidal tails in four LTTGs from our sample. The red circles mark the identified clumps.
gies of the long tidal tails. The agreed classification by at least two of us is adopted. Controversial results were obtained for about 10 per cent targets. We were re-examined to set classification. Our vi-sual examination of all long tidal tails in our sample shows that these long tidal tails can be roughly classified into three shapes.
Figure2presents example images of the three types of tidal tails, defined as straight, curved, and plume. The key features of the three shape types are as follows:
Straight — the tidal tails are straight or slightly curved. The width of the tails is usually significantly smaller than their length and the size of their host galaxies.
Curved — the tidal tails are strongly curved with a shape like “S”, “U” or “V”. The tails are relatively thin and their width is much smaller than their length. We also include ring-shape tails into this type.
Plume — the tidal tails spread widely in a form without a certain figure. Such tails usually have low surface brightness (SB), sticking to the outskirts of the host galaxies.
In interacting galaxies with two tidal tails, one is a long tail and the other is usually shorter. The long tail is often curved or straight, and the counter tail sometimes appears to be a plume tail. In our classification, we count a merging system with a plume tail as the plume type if the plume tail is the major one or comparable to the other tail in size. If there is no plume tail, we use the longest tail to identify the shape type, even though the shorter tails might have a different type.
The number of our sample LTTGs with straight, curved or plume tails is 192 (41 per cent), 213 (47 per cent) and 56 (12 per cent), respectively. It is clear that the long tidal tails in our sample mostly have straight and curved shapes. The plume tails are relatively rare. We notice that the number of the straight tails is comparable to that of the curved tails. This is inconsistent with the idea that the straight tails are the projected curved tails as curved tails seen edge-on should account for only a small fraction of all viewing angles. A quantitative analysis on the separation of the
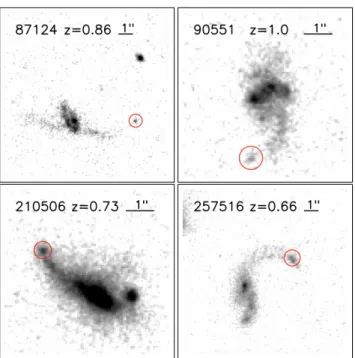
Figure 5. HST/ACS F814W images of four tidal dwarf galaxies identified at the tip of long tidal tails. The red circles mark the massive TDGs at the tip of the tidal tails.
two kinds of straight tails would need a larger sample limited in stellar mass and redshift in order to eliminate various effects. The future wide and deep imaging surveys (e.g., EUCLID,Laureijs et
al. 2011; China Space Station Telescope, Gong et al. 2019; and
MESSIER,Valls-Gabaud et al. 2017) will provide sufficiently large data sets to address this issue.
We measure the length of tidal tails based on the optical brightness of the stellar component of a tail. The H I gas of the tail may extend to much longer distances (e.g.,Duc et al. 2000). A surface brightness threshold to 0.5 σ of background noise level is adopted to draw the boundaries of the tail. For the straight tails, we enclose the entire tail within a rectangle, and the length of the long side of the rectangle is taken as the length of the tail. For the curved tails, we draw a curved line along the ridge of the tail and measure its length. For plume tails, we use an ellipse to fit the boundaries of a tail and adopt as the length of the tail the major axis of the ellipse. We point out that the cosmic dimming effect may influence the tail length measurements. Our sample LTTGs span over a wide redshift range of0.2 < z < 1 and tail lengths tend to be underestimated at higher z. We will address this issue in Section3.3.3.
Figure3shows the histogram of the tail length for the straight, curved and plume tails. We can see that the optically-detected tails in our sample mostly distribute in the length range of7.5−22.5 kpc. Assuming a rotating velocity of 200 km s−1, it would take0.04 − 0.1 Gyr to produce these lengths, a time-scale much shorter than the typical merger time-scale of ∼1 Gyr (Lotz et al. 2008b;Ji, Peirani
& Yi 2014). The three types of tails are similar in the length
distri-bution, although the straight tails tend to be slightly shorter.
3.3 Substructures of Tidal Tails
Gravitational collapse drives gas to form clumps in a tidal tail. The clumps can form Super Star Clusters (SSCs) or TDGs within a rel-atively short time-scale. In contrast, the stellar component in low surface brightness along the tidal tail is not often bounded into these
⋆⊙
Figure 6. Distributions of all 165 TDGs in stellar mass, effective radius, the average rest-frame surface brightness within effective radius and TDG-to-host mass ratio.
clumps. A detailed investigation of the substructures of tidal tails enables to shed light into the formation of the clumps (Barnes &
Hernquist 1992;Bournaud & Duc 2006;Wetzstein, Naab &
Burk-ert 2007).
3.3.1 Clumps
We visually examine the substructures of all tidal tails and identify clumps formed on the tails. We identify a clump from the knot with the largest closed contour with encircled area large than 28 pixels2 (r=FWHM) and the central surface brightness higher than 1.2 times the surface brightness of the surrounding tidal tail (Wen et al. 2012). This criterion allows us to pick up clumps of PSF-corrected size Re> 0.2 kpc at z = 1 and smaller clumps at z = 0.2, indicating to
our identified clumps are only complete at Re> 0.2 kpc over 0.2 <
z < 1. Figure4shows the examples of clumps identified on tidal tails of four merging galaxies. In total, we identify 177 clumps from our sample of 461 LTTGs. Clumps are often present in curved and straight tails especially at the tip of tidal tails. Plume tails usually have smooth surface brightness and barely contain clumps in this sample.
It is challenging to determine the background in conducting photometry on a clump and its boundaries from the host tidal tail. The mean surface brightness of the surrounding area of the host tidal tail is estimated first and taken as the background for the clump photometry. At the tip of the tails, the background is directly de-rived from an annulus close to the clump. We use a set of evenly increasing apertures to measure fluxes for the clump and draw the growth curve to pinpoint the turnover radius where the curve turns flat. The radial light profile is converted from the growth curve. The outer part of the profile, where the surface brightness is lower than that of the tidal tails, is fitted with a power-law function Σflux
= αrβ+ γ and we derive the missing flux out of the turnover radius using the light-weighted best-fitting radial profile. The total flux and the half-light radius (i.e., effective radius Re) are derived from
the composite radial profile (inner observed + outer best-fitting) of the clump after correcting for the PSF effect using an empirical PSF radial profile derived from stars. We also measure the radius within which 90 per cent of light is enclosed from the radial profile. The central surface brightness, i.e., the mean surface brightness within
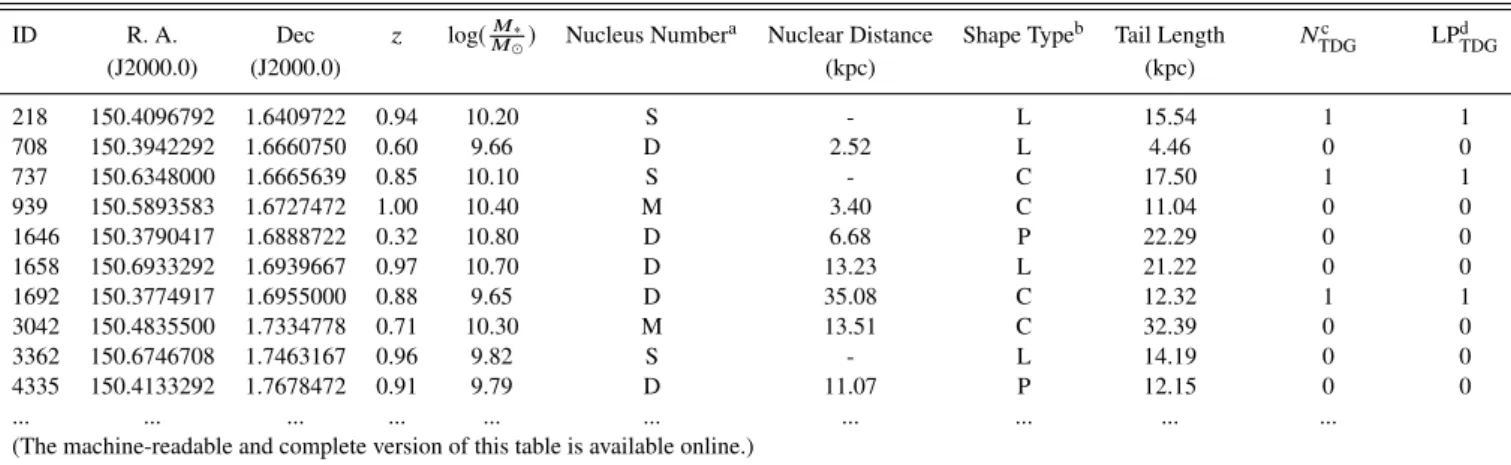
Table 1. The properties and measured tail parameters of our sample of 461 LTTGs.
ID R. A. Dec z log(M∗
M ) Nucleus Number
a Nuclear Distance Shape Typeb Tail Length Nc
TDG LP d TDG (J2000.0) (J2000.0) (kpc) (kpc) 218 150.4096792 1.6409722 0.94 10.20 S - L 15.54 1 1 708 150.3942292 1.6660750 0.60 9.66 D 2.52 L 4.46 0 0 737 150.6348000 1.6665639 0.85 10.10 S - C 17.50 1 1 939 150.5893583 1.6727472 1.00 10.40 M 3.40 C 11.04 0 0 1646 150.3790417 1.6888722 0.32 10.80 D 6.68 P 22.29 0 0 1658 150.6933292 1.6939667 0.97 10.70 D 13.23 L 21.22 0 0 1692 150.3774917 1.6955000 0.88 9.65 D 35.08 C 12.32 1 1 3042 150.4835500 1.7334778 0.71 10.30 M 13.51 C 32.39 0 0 3362 150.6746708 1.7463167 0.96 9.82 S - L 14.19 0 0 4335 150.4133292 1.7678472 0.91 9.79 D 11.07 P 12.15 0 0 ... ... ... ... ... ... ... ... ... ...
(The machine-readable and complete version of this table is available online.)
aNucleus Number — S: single; D: double; M: multiple.bShape Type — L: straight, C: curved, P: plume.cN
TDG– Number of TDGs on tidal tail. dLP
TDG– Location Parameter, 0: no TDG; 1: TDGs at the tip of tidal tails; 2: TDGs on tidal tails; 3: TDGs at the tip and on the tidal tails.
Figure 7. Stellar mass versus concentration parameter (c= R90/R50) for
165 TDGs identified from our LTTG sample (red circles) and 49 dwarf galaxies fromConselice et al.(2003a) (blue squares).
Re, is also calculated. We use the stellar mass-to-light ratio (M/L)
of the host galaxy to estimate stellar mass for the clump. We caution that this may lead to a slight overestimate of stellar mass as clumps usually have younger stellar populations than their host galaxies.
Table1presents the catalog of 461 LTTGs and their measured tail parameters. The table columns include ID, R.A., Dec, redshift, stellar mass, number of nuclei, nuclear separation distance, shape type of tidal tail, tail length, number of TDG, and the location pa-rameter.
3.3.2 TDGs
Within the sample of 177 clumps we identify TDGs. The¢acon-firmed TDGs in the literature (Duc & Mirabel 1998;Monreal-Ibero
et al. 2007;Wen et al. 2012) show different properties from the
dwarf galaxies in the Local Group (Mateo 1998). FollowingWen et al.(2012), we adopt three criteria to determine if a clump is a TDG: 1) stellar mass M∗ > 107M ; 2) effective radius Re> 0.20 kpc ;
3) central surface brightness brighter than 1.2 times that of the host tidal tails. Note that we relax the lower limit of Refrom 0.5 kpc
given inWen et al.(2012) to 0.20 kpc because we find some TDGs
Figure 8. Stellar mass versus effective radius for TDGs and dwarf galaxy populations collected from the literature. Red filled circles represent TDGs from our sample. Blue stars refer to ultra-diffuse galaxies fromShi et al.
(2017). Green filled squares are the satellites of early-type galaxies from
Duc et al.(2014). Cyan filled triangles show TDGs in the Local Group fromDabringhausen & Kroupa(2013) and dark-purple triangles are TDGs at intermediate redshiftsWen et al.(2012). TDGs generated in simulations fromYang et al.(2014) are displayed with black open diamonds. The solid black line represent the best fit M∗- Rerelation of TDGs in this work. The
blue dot-dashed line, green dotted line and magenta dashed line represent respectively the M∗- Rerelation of elliptical galaxies with M∗< 1010M ,
little blue spheroid (LSB) and spiral galaxies fromLange et al.(2016).
at the tip of tidal tails to be more concentrated. Applying these cri-teria to all 177 clumps, we obtain 165 as TDGs residing in 126 LTTGs over the redshift range0.2 < z < 1. Four examples of TDGs identified at the tip of long tidal tails are shown in Figure5. The identification of 165 TDGs from 461 LTTGs gives a TDG pro-duction rate 0.36 per merger. We notice that TDGs can be found in tidal tails as well as at the tip of the tails. We introduce a param-eter to show the location of TDGs in their host tails. The location parameter can be found in Table1.
Figure6presents the distribution of stellar mass, F814W cen-tral SB, effective radius and TDG-to-host mass ratio for the 165 TDGs identified from our sample. The median of stellar mass is 3.4 × 10⁸M and the average of Re = 0.81 kpc. Compared with
Figure 9. HST F814W images of two merging galaxies in our sample. The contours shown with magenta lines mark the detection boundaries (1.2 times the sky background noise level). The surrounding clumps are clearly visible.
are statistically more massive. This is not surprising because these TDGs are distributed in the redshift range of0.2 < z < 1.
TDGs are believed to form through gas collapse followed by infall of stars (Duc & Mirabel 1998;Duc et al. 2000) and new stel-lar populations can be formed at the centre of TDGs. The com-petition between collapse time-scale and star formation time-scale controls the light concentration of the TDGs. We quantify the con-centration of TDGs using a concon-centration parameter c, defined as the ratio between the 90 per cent-light and 50 per cent-light radii (c = R90/R50) (e.g.Shimasaku et al. 2001;Strateva et al. 2001;
Kauffmann et al. 2003). This parameter c reaches a lower limit
ofp9/5 = 1.34 for a flat light distribution. Galaxies with more light concentrated in the inner part usually have a larger c. Early-type galaxies are usually with c ≥ 2.6 and late-type star-forming galaxies mostly have1.8 < c < 2.6 (e.g.,Strateva et al. 2001;
Kauffmann et al. 2003). The median of c is 1.65 for our sample of
165 TDGs. Figure7shows stellar mass versus c for the 165 TDGs in comparison with dwarf galaxies (DGs) adopted fromConselice
et al.(2003a). It is clear that the TDGs are dramatically less
con-centrated than DGs, no cores and rather flat surface brightness dis-tribution in the inner parts. We note that Sérsic models are also often used to describe the surface brightness profile of a galaxy. The concentration parameter c is a proxy of Sérsic index n. Fit-ting the PSF-corrected surface brightness profile of TDGs in our sample with a single Sérsic function, we obtain that the majority of our TDGs are with n < 1, being consistent with c < 2.3 for these TDGs. Table2, we present the stellar mass, effective radius, F814W absolute magnitude and concentration parameter of the 165 TDGs.
We examine the mass-size relation of TDGs in comparison with different populations of dwarf galaxies. We collect samples of dwarf galaxies from the literature and show them in Figure8. The TDGs from our sample are comparable to those in the nearby universe given inDabringhausen & Kroupa(2013) and in interme-diate redshifts fromWen et al.(2012). Interestingly, the early-type satellite galaxies of the nearby galaxies fromDuc et al.(2014) fall into the same region as TDGs, implying that some of the satellites might be tidally originated.
We fit the M∗− Rerelation of TDGs with a power-law, giving
the best fit aslog Re= 0.24 (log(M∗/M ) − 10)+ 1.84, shown with
the black-solid line in Figure8. We also present the M∗− Re
rela-tions fromLange et al.(2016) for spiral galaxies (magenta-dashed line), elliptical galaxies (blue dot-dashed line) and blue spheroids (green-dotted line). We can see that TDGs obey the same M∗− Re
relation as elliptical galaxies and blue spheriods of similar stellar
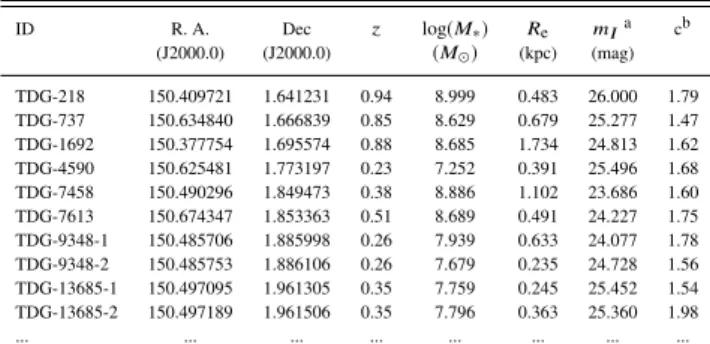
Table 2. The parameters of 165 tidal dwarf galaxies identified from 126 merging galaxies with long tidal tails.
ID R. A. Dec z log(M∗) Re mIa cb (J2000.0) (J2000.0) (M ) (kpc) (mag) TDG-218 150.409721 1.641231 0.94 8.999 0.483 26.000 1.79 TDG-737 150.634840 1.666839 0.85 8.629 0.679 25.277 1.47 TDG-1692 150.377754 1.695574 0.88 8.685 1.734 24.813 1.62 TDG-4590 150.625481 1.773197 0.23 7.252 0.391 25.496 1.68 TDG-7458 150.490296 1.849473 0.38 8.886 1.102 23.686 1.60 TDG-7613 150.674347 1.853363 0.51 8.689 0.491 24.227 1.75 TDG-9348-1 150.485706 1.885998 0.26 7.939 0.633 24.077 1.78 TDG-9348-2 150.485753 1.886106 0.26 7.679 0.235 24.728 1.56 TDG-13685-1 150.497095 1.961305 0.35 7.759 0.245 25.452 1.54 TDG-13685-2 150.497189 1.961506 0.35 7.796 0.363 25.360 1.98 ... ... ... ... ... ... ... ...
(The machine-readable and complete version of this table is available online.)
a F814W magnitude; bconcentration (i.e.,R50/R90 ) .
masses. In contrast, spiral galaxies are more extended than ellipti-cals, blue spheroids and TDGs. In addition, we present ultra-diffuse galaxies (UDGs) fromShi et al.(2017) in Figure8for comparison. We can see that TDGs are much smaller than UDGs of similar stel-lar masses. Of 165 TDGs, only 10 TDGs are with Re > 1.5 kpc.
However, these extended TDGs have central surface brightness at least two magnitudes brighter than UDGs, as shown in Figure6, and therefore cannot be considered as bona-fide UDGs unless they constitute their brighter end.
3.3.3 Isolated Clumps Around the Merging Galaxies
Tidal tails gradually fade and eventually become undetectable af-ter coalescence of two galaxies. However, clumps formed on the tidal tails can still be detected after the tidal tail has dissipated. In such case, one may expect to see clumps around a merging system without clearly-visible tidal tails connecting them. Indeed, we find similar objects in our sample. Figure9shows two merging galax-ies with surrounding clumps. The two objects exhibit clear tidal features but the diffuse component of their tidal tails are hardly de-tectable. We point out that our selection for LTTGs disfavors such systems as their long tidal tails become fainter than the limiting surface brightness.
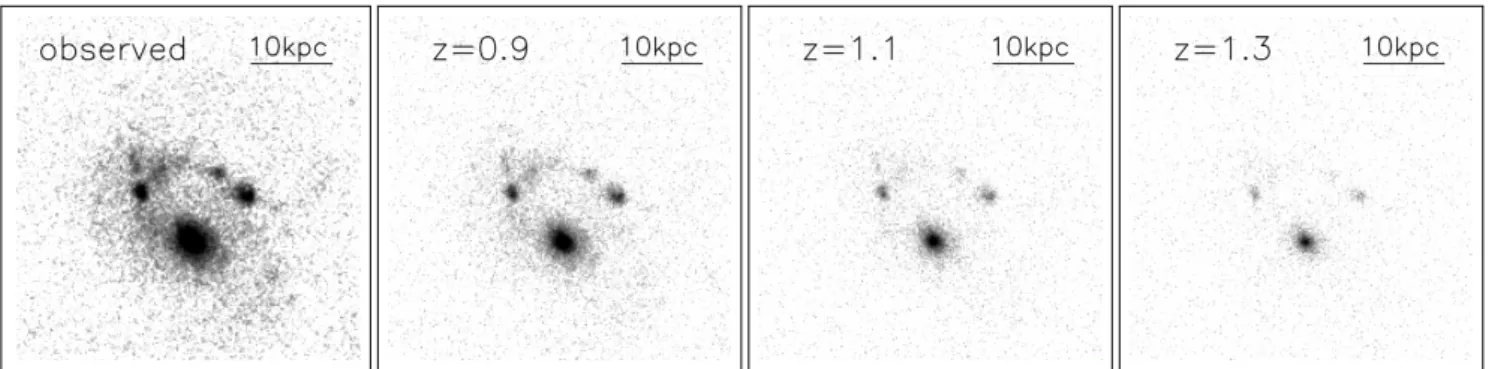
On the other hand, the cosmic dimming may lead to the same effect on the detection of the tidal tails. We demonstrate the case by redshifting merging galaxies to higher redshifts using low-z ob-served objects and counting for the cosmic dimming effect. In Fig-ure 10, the left panel gives one LTTG at z = 0.69 from our sam-ple; the right three panels present the simulated images of this ob-ject redshifted to z = 0.9, 1.1 and 1.3 with an unchanged limiting surface brightness. It can be seen that the tidal tail and the entire system gradually fade at increasing redshift and these clumps loss connections through the tail bridges at z >1. The simulated object at z >1 can not be identified as a merging system.
A clump at the tip of a tidal tail is often barely connected. The tip clump accretes surrounding materials and quickly creates a gap to the tail. The top two panels of Figure 5demonstrate such cases. However, such clumps can be clearly identified. We thus include them into our clump sample. The tip clumps are exclusively TDGs.
Figure 10. HST F814W image of a merging galaxy at z = 0.69 (top-left), and the corresponding images at the same observational depth when redshifting it to z = 0.90, 1.1 and 1.3 after accounting for the cosmic dimming effect. At z = 0.69, the the surrounding tidal tail and clumps can be clearly seen. At z >1 it is difficult to recognize the object as a merging system.
Figure 11. Comparison of a real merger in our sample (left) with a simu-lated merger (right) from the GalMer database (Chilingarian et al. 2010). The shape of the tidal tails in the two merger systems are similar.
4 DISCUSSION
4.1 Formation of Tidal Tails in Relation to Their Shapes In galaxy merging processes, the shape of tidal tails is governed by galaxy morphologies, kinematics, merger parameters, merger stage and the viewing angle (e.g.Toomre & Toomre 1972;Barnes 1992). An effective way to assess the formation of these tidal tails is to match an observed merger with simulated ones in morphol-ogy and take the merger parameters from the matched simulation to model the observed merger and formation of the associated tidal tails. Figure11illustrates a real merger from our sample and a sim-ulated merger from the GalMer database (Chilingarian et al. 2010). The snapshot of the simulated merger is chosen to be analog to the morphology of the real merger. This simulation models a prograde merger at the intermediate stage in which the tidal tails keep grow-ing. We point out that it is a big effort to pinpoint a close match of simulated mergers to each of all 461 LTTGs in our sample and figure out how these mergers were undergoing. It is worth doing but beyond the scope of this work. Here we discuss the formation mechanisms for the three types of tidal tails in our sample.
Straight tails — Our results show that the fractions of straight and curved tails are comparable in our sample. The straight tails represent a large fraction (∼ 40 per cent) of the overall tidal tails. Straight tails are statistically shorter than curved tails, as shown in Figure3. Their host galaxies are mostly single nucleus or close pairs, are likely being in the late stages of merging processes. In Figure12, we present three more examples of straight tails hosted by double-nucleus systems. Compared with the curved tails, the straight tails tend to have a lower mean surface brightness and host less clumps as well as TDGs.
We note that curved tidal tails mostly lie in the same plane of their rotating host galaxies. They could be viewed as straight from the edge-on angle. However, the fraction of the edge-on curved tidal tails is small if the inclination of these merging galaxies is not pref-erentially aligned. And such projection effect of the tidal tails can be clarified in nearby merging galaxies (Bournaud & Duc 2004). We thus believe that the majority of straight tidal tails were formed to be straight.
It is unclear how to generate straight tidal tails in galaxy merg-ers at a high rate. From the properties of the straight tails, we sus-pect that they are associated with the late stages of galaxy merg-ers, and probably strongly stretched by violent tidal forces. More-over, the lack of clumps and/or relatively short lengths may hint that their parent galaxies are not sufficiently massive. Further efforts are needed to interpret the formation of straight tidal tails.
Curved tails — Simulation suggest that long curved tails are often produced in the prograde mergers of disc galaxies. The length of the curved tails are significantly affected by the merger param-eters such as the different inclination angle and the mass ratio. It is clear that curved tails formed after their first pericentre passage. This stage represents a relatively long period of the entire merging process (Barnes 1992).
Plume tails — This type of tidal tails may be associated with the retrograde mergers of disc galaxies. In retrograde merging, the materials of the tails are driven away by tidal force, and then fall back to the host galaxies and form extended plume tails. Moreover, plume tails are in place after coalescence. Around the merger rem-nant, the tails and fallback materials dissipate and form a plume appearance located at the outskirts of the host galaxies.
4.2 Detection Completeness
Our sample of 461 LTTGs is increasingly incomplete at z & 0.4 in detecting long tidal tails down to the limiting surface bright-ness of 25.1 mag arcsec−2 (3 σ detection, Wen & Zheng 2016). Figure10 demonstrated the increasing detection incompleteness due to the cosmic dimming effect.Wen & Zheng (2016) exam-ined the F814W surface brightness of these tidal tails and estimated the detection completeness (as shown in their figure 9). The tidal tail detection is complete above an intrinsic surface brightness of 23.1 mag arcsec−2 at z <0.4 after correcting for the cosmic dim-ming effect, and the completeness becomes 78, 72, and 62 per cent at z ∼0.5, 0.7 and 0.9, respectively.
We classified the long tidal tails into three shape types. Among them, plume tails are statistically fainter in surface brightness than
Figure 12. Three example images of straight tails. Two galaxy nuclei can be clearly identified in these systems.
Figure 13. Four merging galaxies with spiral arms and tidal tails in our sample.
straight and curved tails. The detection completeness is thus lower than for plume tails than the other two types and our sample con-tains only a few plume tails at z >0.6. This bias lowers the fraction of the plume type in our sample.
4.3 Formation of TDGs
We identified 165 TDGs in 126 LTTGs. This is so far the largest sample of TDGs at0.2 < z < 1. The properties of TDGs in our sample, as shown in Figure6, are generally consistent with those reported in previous works for individual cases in the nearby uni-verse or small samples of TDGs. Based on the to date largest TDG sample, we estimated a production rate of TDGs to be 0.36 per ma-jor merger. In order to estimate the contribution of TDGs to the dwarf population in the local universe, we selected a subsample of TDGs with8.5 ≤ log(M∗/M ) ≤ 9.5 and calculate the
pro-duction rate of TDGs in this mass range. The propro-duction rate of TDGs in this mass range is ∼ 0.17 TDGs per long-tidal tail merger system. Combining galaxy mass functions at z < 4 fromLaigle
et al.(2016) with the LTTG merger fraction fromWen & Zheng
(2016), we obtain a TDG density function in the mass range of
log(M∗/M ) ≥ 9.5. Adopting the TDG survival rates from
Bour-naud & Duc(2006) , we calculate the accumulated number density
of survived TDGs to be1.2 × 10−4Mpc−3over the past1 − 12 Gyr and1.7 × 10−4Mpc−3over0 − 1 Gyr lookback time.
Considering that some TDGs in0 − 1 Gyr do not have enough time to escape from tidal tails and evolve into isolated dwarf galax-ies, we find that the number density of dwarf galaxies evolved from TDGs since 12 Gyr ago is about2 × 10−4Mpc−3. From the local galaxy mass function (Bell et al. 2003), we obtain that dwarf galax-ies with8.5 ≤ log(M∗/M ) ≤ 9.5 have a number density of about
7 × 10⁻³Mpc−3in the local universe. This means that about ∼ 3 per cent of dwarf galaxies are contributed by TDGs. Considering that half of the merging galaxies have long tidal tails and not all of the merging systems can produce TDGs (Bournaud & Duc 2006;
Wen & Zheng 2016), we estimate that ∼5 per cent of dwarf
galax-ies are of tidal origin. This is consistent with the result given inWen
et al.(2012). Such a low production rate indicates that the
tidally-originated dwarf galaxies do not represent a significant fraction of the dwarf population in the same stellar mass regime.
We denote that most of the TDGs are associated with curved (85/165) and straight (55/165) tails. Interestingly, about half of TDGs are located at the tip of their host tails. We compare the tidal tails hosting TDGs with those containing no TDGs, finding no sys-tematic difference in their properties. We suspect that gas fraction might be important for triggering the formation of TDGs (e.g.,Duc,
Bournaud & Masset 2004). Our current investigation is unable to
tell the reasons why some tidal tails can form TDGs at the tip while the others do not. Simulations of galaxy mergers can help to under-stand the formation mechanisms of TDGs.
TDGs are believed to contain little dark matter because of their tidal origin (Bournaud & Duc 2006). Our TDGs have spherical-like morphologies with stellar mass mostly in the range of log(M∗/M ) ∼ 7.5−9.5 and half-light radius around Re∼ 0.8 kpc.
Our results show that TDGs follow the mass-size relation of ellip-ticals and spheroids in the same stellar mass range (Figure8). This coincidence suggests that at the low-mass end the central part of el-lipticals and spheroids are likely dominated by the baryonic matter. In addition, our results reveal that the average surface brightness profile of TDGs is globally flatter than that of disc galaxies. We suspect that TDGs in our sample are still in the formation process and not dynamically relaxed yet, making them even more extended than disc galaxies. It is worth noting that the properties of TDGs, i.e., relatively small size and low Sérsic index, are similar to those of high-z star-forming galaxies. TDGs could be thus used to ex-plore the physical processes of rapid star formation that more often occur in high-z galaxies.
bary-onic matter and possibly tidal originated. We examine our TDGs to see if some of them could be the UDG candidates. We note that UDGs are defined to have Re > 1.5 kpc and the central
sur-face brightness of 24 − 26 mag arcsec−2 (e.g. Koda et al. 2015;
Shi et al. 2017). In our sample of 165 TDGs, there are only 10
with Re> 1.5 kpc. Their central surface brightness are, however, at
least two magnitudes brighter than that of UDGs. Indeed, the lim-iting surface brightness of the COSMOS HST imaging data does not allow us to detect UDGs associated with our sample LTTGs. On the other hand, all of the TDGs on tidal tails are likely forming new stars through attracting surrounding gas and thus show a high brightness temporarily. We cannot deny the possibility that at least some of the 10 extended UDGs would fade dramatically and satisfy the criteria for being UDGs. This is supported by the finding that some old TDGs exhibit properties similar to those of UDGs (e.g.,
Duc et al. 2014).
4.4 Spiral Arms and Curved Tails
Spiral arms in (barred) disc galaxies, in particular the “loose” ones, appear like curved tails and might contaminate our sample. We ar-gue that the contamination is marginal and our results are not af-fected. Our sample galaxies are selected to have disturbed mor-phologies with strong tidal features in the outskirts. As shown in Figure2,4and5, the long tidal tails in these galaxies are asymmet-ric and extended. We also check all 461 LTTGs and pick up these with arm structures. Figure13shows the HST images of four sam-ple galaxies with the least disturbed spiral arms. Both spiral arms and tidal tails can be seen in these galaxies. The spiral arms are symmetric and closely linked with the core of the host galaxies. In contrast, the tidal tails are diffuse and more extended. In some merging pairs of galaxies with "loose” spiral arms, tidal forces may drive the arms open and turn them into curved tails. This mecha-nism does not require strong tidal forces to break the original disc structures, likely responsible for part of the curved tails in galaxy pairs with nuclear separation distance d >20 kpc.
5 CONCLUSIONS
Using HST/ACS F814W imaging data in conjunction with publicly-available multi-wavelength data in the COSMOS field, we analyse the morphological properties for a sample of 461 merging galaxies with long tidal tails. We summarize our results as follows: • Of 461 LTTGs, 91 (21 per cent) are single-nucleus merging galaxies, 90 (20 per cent) are partially-coalesced with nuclear sep-aration distance d <20 kpc, 128 (28 per cent) are close pairs with d< 20 kpc, and 145 (31 per cent) are galaxy pairs with d > 20 kpc. Comparison of our sample galaxies with simulations suggests that long tidal tails are mostly generated in prograde galaxy mergers.
• The long tidal tails can be classified mainly into three shape types: straight, curved and plume. Our sample consists of 192 (41 per cent) LTTGs with straight tails, 213 (47 per cent) with curved tails, and 56 (12 per cent) with plume tails. We find that the curved tails viewed edge-on may be responsible for only a small fraction of the straight tails. It remains to be understood how galax-ies merge to generate straight tails at such a high rate. We argue that the shape of tidal tails is generally coupled with the stage of merging processes although it also relies on the merger parameters. • We identify 177 clumps from all long tidal tails of our 461
merging galaxies. Of them, 165 are classified as tidal dwarf galax-ies residing in 126 host merging galaxgalax-ies, yielding a production rate of 0.36. We estimate that ∼ 5 per cent of local dwarf galaxies are tidally originated. Our results show that most of the TDGs are associated with curved (85/165) and straight (55/165) tails. More than half of TDGs are located at the tip of their host tails.
• We find that TDGs follow the mass-size relation of local ellip-tical galaxies over7.5 ≤ log(M∗/M ) ≤ 9.5, while their surface
brightness profiles appear statistically flatter than an exponential disc. These indicate that TDGs are still in the formation process, make them analogous objects for studying rapid star formation that commonly occur in high-z star-forming galaxies.
DATA AVAILABILITY
The data underlying this article are available in the article and in its online supplementary material.
ACKNOWLEDGEMENTS
We thank the anonymous referee for her/his useful comments and suggestions that improved this manuscript. This work is sup-ported by the National Key Research and Development Program of China (2017YFA0402703), and the National Science Founda-tion of China (11773076, 11703092, 12073078), and the Chinese Academy of Sciences (CAS) through a China-Chile Joint Research Fund (CCJRF #1809) administered by the CAS South America Centre for Astronomy (CASSACA). DVG gratefully acknowledges the support from the CAS President’s International Fellowship Ini-tiative (PIFI) visiting scientists program (2019VMA0003).
REFERENCES
Bahcall J. N., Kirhakos S., Saxe D. H., Schneider D. P., 1997, ApJ, 479, 642 Barnes J. E., 1992, ApJ, 393, 484
Barnes J. E., 2016, MNRAS, 455, 1957 Barnes J. E., Hernquist L., 1992, Natur, 360, 715
Barrows R. S., Comerford J. M., Zakamska N. L., Cooper M. C., 2017, ApJ, 850, 27
Bell E. F., McIntosh D. H., Katz N., et al., 2003, ApJS, 149, 289 Bell E. F., Naab T., McIntosh D. H., et al., 2006, ApJ, 640, 241 Bell E. F., Monachesi A., Harmsen B., et al., 2017, ApJ, 837L, 8 Bluck A. F. L., Conselice C. J., Buitrago F., Grützbauch R., Hoyos C.,
Mort-lock A., Bauer A. E., 2012, ApJ, 747, 34 Bournaud F., Duc P.-A., Masset F., 2003, A&A, 411, 1 Bournaud F., Duc P.-A., et al., 2004, A&A, 425, 813 Bournaud F., Jog C. J., Combes F., 2005, A&A, 437, 69 Bournaud F., Duc P.-A., 2006, A&A, 456, 481
Bournaud F., Chapon D., Teyssier R., et al., 2011, ApJ, 730, 4
Bundy K., Fukugita M., Ellis R. S., Targett T. A., Belli S., Kodama T., 2009, ApJ, 697, 1369
Capak P., Aussel H., Ajiki M., et al., 2007, ApJS, 172, 99 Chilingarian I. V., Di Matteo P., et al., 2010, A&A, 518, 61 Conselice C. J., Gallagher J. S. III, Wyse, R. F.G., 2003, AJ, 125, 66 Conselice C. J., Bershady M. A., Dickinson M., Papovich C., 2003, AJ, 126,
1183
Cui J., Xia X-Y, Deng Z-G, et al., 2001, AJ, 122, 63 Dabringhausen J., Kroupa P., 2013, MNRAS, 429, 1858
Darg D. W., Kaviraj S., Lintott C. J., et al., 2010, MNRAS, 401, 1552 De Propris R., Baldry I. K., Bland-Hawthorn J., et al., 2014, MNRAS, 444,
2200
Duc P.-A., Bournaud F., Masset F., 2004, A&A, 427, 803
Duc P.-A., Brinks E., Springel V., Pichardo B., Weilbacher P., Mirabel I. F., 2000, AJ, 120, 1238
Duc P.-A., Mirabel I. F., 1998, A&A, 333, 813
Duc P.-A., Cuillandre J.-C., Karabal E., et al., 2015, MNRAS, 446, 120 Duc P.-A., Paudel S., McDermid R. M., Cuillandre J.-C., Serra P., Bournaud
F., Cappellari M., Emsellem E., 2014, MNRAS, 440, 1458 Duc P.-A., Renaud F., 2013, LNP, 861, 327
Ellison S. L., Mendel J. T., Patton D. R., Scudder J. M., 2013, MNRAS, 435, 3627
Fakhouri O., Ma C.-P., Boylan-Kolchin M., 2010, MNRAS, 406, 2267 Gargiulo I. D., Monachesi A., Gøsmez F. A., et al., 2019, MNRAS, 489,
5742
Genzel R., Tacconi L. J., Rigopoulou D., Lutz D., Tecza M., 2001, ApJ, 563, 527
Gong Y., Liu X. K., Cao Y., et al., 2019, ApJ, 883, 203
Hancock M., Smith B. J., Struck C., Giroux M. L., Hurlock S., 2009, AJ, 137, 4643
Hilz M., Naab T., Ostriker J. P., 2013, MNRAS, 429, 2924
Hood C. E., Kannappan S. J., Stark D. V., Dell’Antonio I. P., Moffett A. J., Eckert K. D., Norris M. A., Hendel D., 2018, ApJ, 857, 144
Hopkins P. F., Bundy K., Croton D., et al., 2010a, ApJ, 715, 202 Hopkins P. F., Bundy K., Hernquist L., Ellis R. S., 2007, ApJ, 659, 976 Hopkins P. F., Cox T. J., Younger J. D., Hernquist L., 2009, ApJ, 691, 1168 Hopkins P. F., Croton D., Bundy K., et al., 2010b, ApJ, 724, 915
Hopkins P. F., Hernquist L., Cox T. J., Di Matteo T., Robertson B., Springel V., 2006, ApJS, 163, 1
Ji I., Peirani S., Yi S. K., 2014, A&A, 566, A97
Jogee S., Miller S. H., Penner K., et al., 2009, ApJ, 697, 1971 Kado-Fong E., Greene J. E., Hendel D., et al., 2018, ApJ, 866, 103 Kauffmann G., Heckman T. M., White S. D. M., et al., 2003, MNRAS, 341,
54
Kaviraj S., 2014, MNRAS, 437, L41
Kaviraj S., Darg D., Lintott C., Schawinski K., Silk J., 2012, MNRAS, 419, 70
Koda J., Yagi M., et al., 2015, ApJ, 807, L2
Koekemoer A. M., Aussel H., et al., 2007, ApJS, 172, 196 Laigle C., et al., 2016, ApJS, 224, 24
Lange R., Moffett A. J., Driver S. P., et al., 2016, MNRAS, 462, 1470 Laureijs R., Amiaux J., Arduini S., et al., 2011, arXiv: 1110.3193 Leauthaud A., Massey R., Kneib J.-P., et al., 2007, ApJS, 172, 219 Lin L., Koo D. C., Willmer C. N. A., et al., 2004, ApJ, 617, L9 Lin L., Patton D. R., Koo D. C., et al., 2008, ApJ, 681, 232
Lin Y.-T., Brodwin M., Gonzalez A. H., Bode P., Eisenhardt P. R. M., Stan-ford S. A., Vikhlinin A., 2013, ApJ, 771, 61
Lotz J. M., Davis M., Faber S. M., et al., 2008a, ApJ, 672, 177
Lotz J. M., Jonsson P., Cox T. J., Croton D., Primack J. R., Somerville R. S., Stewart K., 2011, ApJ, 742, 103
Lotz J. M., Jonsson P., Cox T. J., Primack J. R., 2010a, MNRAS, 404, 575 Lotz J. M., Jonsson P., Cox T. J., Primack J. R., 2008b, MNRAS, 391, 1137 Man A. W. S., Zirm A. W., Toft S., 2016, ApJ, 830, 89
Mantha K. B., McIntosh D. H., Brennan R., et al., 2018, MNRAS, 475, 1549
Martínez-Delgado D., Gabany R. J., Crawford K., et al., 2010, AJ, 140, 962 Martin G., Kaviraj S., Devriendt J. E. G., Dubois Y., Laigle C., Pichon C.,
2017, MNRAS, 472, L50
Martin G., Kaviraj S., Devriendt J. E. G., Dubois Y., Pichon C., 2018, MN-RAS, 480, 2266
Mateo M. L., 1998, ARA&A, 36, 435 Mihos J. C., Hernquist L., 1996, ApJ, 464, 641
Mohamed Y. H., Reshetnikov V. P., Sotnikova N. Y., 2011, AstL, 37, 670 Monreal-Ibero A., Colina L., Arribas S., García-Marín M., 2007, A&A,
472, 421
Morales G., Martínez-Delgado D., Grebel E. K., Cooper A. P., Javanmardi B., Miskolczi A., 2018, A&A, 614, A143
Moustakas J., Coil A. L., Aird J., et al., 2013, ApJ, 767, 50 Muzzin A., Marchesini D., Stefannon M., et al., 2013, ApJS, 206, 8 Naab T., Burkert A., 2003, ApJ, 597, 893
Newman A. B., Ellis R. S., Bundy K., Treu T., 2012, ApJ, 746, 162 Oser L., Ostriker J. P., Naab T., Johansson P. H., Burkert A., 2010, ApJ,
725, 2312
Ownsworth J. R., Conselice C. J., Mortlock A., Hartley W. G., Almaini O., Duncan K., Mundy C. J., 2014, MNRAS, 445, 2198
Patton D. R., Pritchet C. J., Carlberg R. G., et al., 2002, ApJ, 565, 208 Ploeckinger S., Sharma K., Schaye J., Crain R. A., Schaller M., Barber C.,
2018, MNRAS, 474, 580
Ricci C., Bauer F. E., Treister E., et al., 2017, MNRAS, 468, 1273 Robaina A. R., Bell E. F., Skelton R. E., et al., 2009, ApJ, 704, 324 Robertson B., Bullock J. S., Cox T. J., Di Matteo T., Hernquist L., Springel
V., Yoshida N., 2006, ApJ, 645, 986
Rodriguez-Gomez V., Genel S., Vogelsberger M., et al., 2015, MNRAS, 449, 49 models
Rodriguez-Gomez V., Pillepich A., Sales L. V., et al., 2016, MNRAS, 458, 2371
Roman J., Trujillon I.,2017, MNRAS, 468, 4039 Sanders D. B., Mirabel I. F., 1996, ARA&A, 34, 749
Sanders D. B., Soifer B. T., Elias J. H., Madore B. F., Matthews K., Neuge-bauer G., Scoville N. Z., 1988, ApJ, 325, 74
Shi D. D., Zheng X. Z., Zhao H. B., et al., 2017, ApJ, 846, 26 Shimasaku K., Fukugita M., Doi M., et al., 2001, AJ, 122, 1238 Springel V., White S. D. M., 1999, MNRAS, 307, 162
Stewart K. R., Bullock J. S., Barton E. J., Wechsler R. H., 2009, ApJ, 702, 1005
Strateva I., Ivezic Z., Knapp G. R., et al., 2001, AJ, 122, 1861S Struck C., Smith B. J., 2012, MNRAS, 422, 2444
Teyssier R., Chapon D., Bournaud F., 2010, ApJ, 720, L149
Thorp M. D., Ellison S. L., Simard L., Sánchez S. F., Antonio B., 2019, MNRAS, 482, L55
Toomre A., Toomre J., 1972, ApJ, 178, 623
Treister E., Schawinski K., Urry C. M., Simmons B. D., 2012, ApJ, 758, L39
Valls-Gabaud D., MESSIER Collaboration, 2017, IAU Symposium 321, 199
van Dokkum P. G., 2005, AJ, 130, 2647
Welker C., Devriendt J., Dubois Y., Pichon C., Peirani S., 2014, MNRAS, 445, L46
Wen Z.-Z., Zheng X.-Z., Zhao Y.-H., Gao Y., 2012, Ap&SS, 337, 729 Wen Z. Z., Zheng X. Z., 2016, ApJ, 832, 90
Wen Z. Z., Zheng X. Z., An F. X., 2014, ApJ, 787, 130 Wetzstein M., Naab T., Burkert A., 2007, MNRAS, 375, 805 White S. D. M., Frenk C. S., 1991, ApJ, 379, 52
Xu C. K., Zhao Y., Scoville N., Capak P., Drory N., Gao Y., 2012, ApJ, 747, 85
Yang Y., Hammer F., Fouquet S., Flores H., Puech M., Pawlowski M. S., Kroupa P., 2014, MNRAS, 442, 2419