HAL Id: hal-00299107
https://hal.archives-ouvertes.fr/hal-00299107
Submitted on 3 Jan 2005
HAL is a multi-disciplinary open access
archive for the deposit and dissemination of
sci-entific research documents, whether they are
pub-lished or not. The documents may come from
teaching and research institutions in France or
abroad, or from public or private research centers.
L’archive ouverte pluridisciplinaire HAL, est
destinée au dépôt et à la diffusion de documents
scientifiques de niveau recherche, publiés ou non,
émanant des établissements d’enseignement et de
recherche français ou étrangers, des laboratoires
publics ou privés.
Integrated geophysical surveys to assess the structural
conditions of a karstic cave of archaeological importance
G. Leucci, L. de Giorgi
To cite this version:
G. Leucci, L. de Giorgi. Integrated geophysical surveys to assess the structural conditions of a karstic
cave of archaeological importance. Natural Hazards and Earth System Science, Copernicus
Publica-tions on behalf of the European Geosciences Union, 2005, 5 (1), pp.17-22. �hal-00299107�
SRef-ID: 1684-9981/nhess/2005-5-17 European Geosciences Union
© 2005 Author(s). This work is licensed under a Creative Commons License.
and Earth
System Sciences
Integrated geophysical surveys to assess the structural conditions of
a karstic cave of archaeological importance
G. Leucci and L. De Giorgi
Osservatorio di Chimica, Fisica e Geologia Ambientali, Dipartimento di Scienza dei Materiali, Universit`a di Lecce, Via Arnesano, 73100 LECCE, Italy
Received: 9 June 2004 – Revised: 7 August 2004 – Accepted: 6 October 2004 – Published: 3 January 2005 Part of Special Issue “Natural and anthropogenic hazards in karst areas”
Abstract. An integrated geophysical survey using both the electrical resistivity tomography (ERT) and ground-penetrating radar (GPR) methods was undertaken over a cave of great archaeological interest in southern Italy. The survey was performed to assess the stability of the carbonate rock roof of the cave. A geophysical survey was preferred to bore-holes and geotechnical tests, in order to avoid the risk of mass movements. The interpretation of integrated data from ERT and GPR resulted in an evaluation of some of the electromag-netic (EM) characteristics (such as the EM wave velocity) and the detection of discontinuities (fractures) in the carbon-ate rock. It is well known that rock fractures constitute a serious problem in cave maintenance, and progressive crack-ing within the bed rock is considered to be one of the main causes of collapse. An analysis of the back-scattered energy was also required for the GPR data interpretation. Cracks within the bedrock were detected to a depth of about 2 m by using GPR, which allowed for the identification of the loos-ened zone around the cave.
1 Introduction
Nowadays a valid alternative to direct investigation methods, in order to study the stability of galleries, foundations, etc., is the use of the geophysical surveys. Although in many cases in the assessment and monitoring phases, direct meth-ods, such as drillings, are used to establish the stability, yet such methods may damage the structure and may often be very costly and provide information that cannot always be extrapolated to large areas. On the other hand, geophysical techniques are generally non-destructive and may be applied to map fractures with accuracy in the shallow subsurface.
This paper reports the results of geophysical surveys us-ing 2-D electrical resistivity tomography (ERT) and Ground-Penetrating Radar (GPR), carried out in a karstic area
Correspondence to: G. Leucci
(“Grotta delle Veneri”), located 40 km south from Lecce near the Parabita village (Apulia Region, southern Italy). Human activity in the territory of Parabita is known since 80 000 B.C. In fact, in the cave denoted “Grotta delle Veneri”, Homo Sapiens Neanderthalensis (Neanderthal) and the Homo Sapiens-Sapiens (Cro-Magnon) (35 000–10 000 B.C.) artefact were discovered in 1966 (Cremonesi, 1987). In the same year two statuettes (2000–10 000 B.C.), representing two women in a state of pregnancy, were found. The “Grotta delle Veneri” (Cave of the Venus) is one of the most impor-tant archaeological sites of the Salento peninsula, since its discovery confirmed the presence of the Neanderthal man in the Mediterranean Basin. The studied area is located in a karstic area made of Miocene carbonate rocks. Since the sta-bility of the cave depends on the presence of the fractures in the massive rock, then the geophysical surveys were un-dertaken in order to achieve useful information for possible future restoration works.
The literature gives many investigations employing sev-eral geophysical methods combined together, like seismic and GPR (Benson, 1992; Cardarelli et al., 2003), or electric with seismic (Dobroka et al., 1991; Cardarelli and Bernabini, 1997; Heikkinen and Saksa, 1998), or electric with seismic and GPR (Leucci, 2004). On the other hand, the literature provides few examples of the combined use of electrical and GPR methods (Santarato et al., 1998), which are applications of a different nature from that described in the present paper. Other applications are related to the use of the GPR method (Toshioka et al., 1995; Grandjean and Gourry, 1996; Orlando, 2003). However, the use of more than the one method have resulted in a more accurate definition and in-terpretation of anomalies.
Karst terrain is a very difficult environment for geophysi-cal exploration because of high surface heterogeneities gen-erated by fractures and depressions filled with air, terra rossa or clay contained in the carbonate rocks. The degree of in-tegrity of a karst terrain can be estimated by:
18 G. Leucci and L. De Giorgi: Structural conditions of a karstic cave of archaeological importance
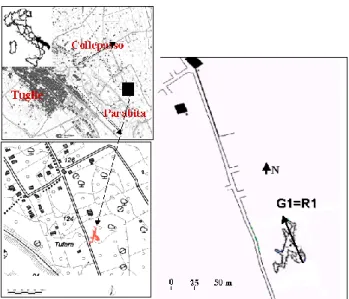
Fig. 1. Location of the survey area.
– resistivity values from 2-D electrical tomography; – the back-scattered energy in GPR surveys; – the EM wave velocity.
The geophysical survey described here allowed for an inte-grated interpretation which was very attractive in evidencing the characteristics of the investigated area (Lin et al., 1996; Cardarelli et al., 2003; Leucci et al., 2003).
2 Geological setting
The area of Parabita is located on a ridge, elongated in NNO-SSE direction, locally named “Serra di S. Eleuterio”. The “Serra di S. Eleuterio” is characterized by limestones and dolomitic limestones with thickness ranging by a few cen-timeters to about 1 m. East of the Serra, more recent sed-iments crop out on a flat surface widely covered by “terra rossa” deposits. They can be divided into:
– “Calcareniti of Salento”, made of coarse calcarenites of
Lower Pleistocene;
– Subapennine Clays, made of clayey deposits of Lower
Pleistocene;
– marine terraced deposits of beach and of plain coastline
of Middle–Upper Pleistocene.
3 Equipment and data acquisition
For GPR survey a SIR System manufactured by GSSI, equipped with 35, 100, 200 and 500 MHz antenna, was used. ERT and GPR profiles were overlapped (Fig. 1). Preliminary calibration tests were performed in order to select the most
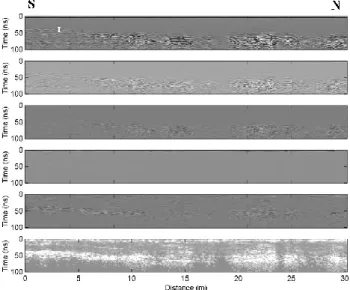
Fig. 2. Raw radar sections related to R1 profile acquired with: (a)
35 MHz antenna; (b) 100 MHz antenna; (c) 200 MHz antenna; (d) 500 MHz antenna.
appropriate antenna for the particular survey objective. The GPR profiles were carried out along the same line shown in Fig. 1.
The profile using the 35 MHz antenna (Fig. 2a) shows the maximum depth of penetration at about 150 ns (two-way travel time), corresponding to a depth of penetration of about 8 m (if the average EM wave velocity used is 0.1 m/ns). At about 50 ns most reflections appear in the southern side of the section, while other reflections appear to decrease their energy amplitude in the northern side of the section. These reflections have been interpreted as the roof of the cave. The profile using the 100 MHz antenna (Fig. 2b) shows the same results of the 35 MHz antenna. The profile using the 200 MHz antenna (Fig. 2c) shows the maximum depth of penetration at about 100 ns, corresponding to a depth of about 5 m. In the section the reflections due to the cave roof are better evidenced. The profile using the 500 MHz antenna (Fig. 2d) shows the maximum depth of a reflection at about 70 ns, corresponding to a depth of about 3 m. The improved resolution at 500 MHz, as compared to 200 MHz, indicates other reflections probably related to the bottom of the cave. The 500 MHz antenna was selected because it provided the best results in terms of resolution for the study of the shallow 3 m in depth.
For the ERT survey a 48-channel Syscal-R1 Resistivity-meter (manufactured by the Iris Instruments), in multielec-trode configuration was used. Resistivity field data were col-lected using 48 electrodes with 0.5 m spacing. The selection for electrode arrays was dipole-dipole. The dipole-dipole array is very sensitive to horizontal changes in resistivity, but relatively insensitive to vertical changes in the resistiv-ity. This means that it is good in mapping vertical struc-tures, such as voids, but relatively poor in mapping horizon-tal structures (Loke, 2001).
Fig. 3. Two-dimensional electrical resistivity model related to G1 profile: (a) inverse model resistivity section; (b) inverse model conductivity
section.
The above described electrodes array allows one to in-vestigate, with a good resolution, the shallow 3 m of sub-soil (Leucci, 2004). The measured data were processed by means of 2-D inverse modelling software, applying Loke and Barker inversion methods. The software employs a quasi-Newton technique to reduce the numerical calculations (Loke and Barker, 1996). It produces a 2-D resistivity model sat-isfying measured data in the form of a pseudosection. The goodness of the fit is expressed in terms of the relative RMS error. This method is more suitable where both strong lateral resistivity variations and depth changes occur and in complex geological models such as in a karstic area (Leucci, 2004).
4 Electrical Resistivity Tomography (ERT) results
A typical image from the ERT survey is shown in Fig. 3a: it shows a layered resistivity profile in the top 3.5 m, a zone of low resistivity (about 100 to 4000 m) from the surface to about 2.3 m depth in the north side, underlined by an high re-sistivity zone labelled G (ρ>16 000 m), and an upper layer that shows lateral discontinuities in some points of the image. The geological model established by means of a 2-D resis-tivity imaging profile (Fig. 3a), allows for two different zones to be detected. The first zone (upper 1–2 m):
– the high resistivity zone (about 4000 m), labelled (b)
in Fig. 3a, clearly indicates a zone of poor quality rock. The resistivity values indicate that the zone consists of fractured carbonate rock;
– the low resistivity zone (about 100 to 500 m), labelled
(C) in Fig. 3a, corresponds to the less fractured carbon-ate rock, although the resistivity values are low enough to indicate that the carbonate rock is fractured and the fractures could be filled with clay or “terra rossa”. The ambiguity in the interpretation (fractures filled with air or other materials) could be resolved using other geo-physical methods.
The second zone (below the first zone):
– the high resistivity zone (ρ>16 000 m), labelled (G)
in Fig. 3a, clearly indicates the presence of a cave. Figure 3b shows the conductivity model which will be useful to determine the average conductivity value in the shallow subsurface and therefore to calculate the electromagnetic en-ergy attenuation (see next paragraph).
5 GPR survey results
A 500-MHz centre frequency antenna was used; the data were acquired in continuous mode with 512 samples per scan, a 150 ns recording time window, a manual gain func-tion, and 1-m reference marks for distance.
Fractures can be identified from the properties of their con-tent in terms of nature and size, or quantity of air and water, or other materials, such as clay or terra rossa. This is possible if fractures are sufficiently open and filled with air or water, or with other materials, such as clay or terra rossa, as in the
20 G. Leucci and L. De Giorgi: Structural conditions of a karstic cave of archaeological importance
Fig. 4. Processing step performed on the radar data acquired with
500 MHz antenna: (a) raw radar section; (b) background removal filter; (c) Kirchhoff migration; (d) gain function removal; (e) ampli-tude compensation; (f) envelopes. The reflections (labelled T) are produced by the top of the cave.
case of karst, allowing for a high amount of radar energy to be backscattered (Grandjean et al., 1996); furthermore, radar wave propagation is influenced by both the relative dielec-tric permittivity (ε), and the elecdielec-trical conductivity (σ ) of the material through which the radar energy passes (Conyers and Goodman, 1997). Radar signal attenuation is commonly ex-pressed as a function of ε and σ parameters. The simplified relationship taken from Davis and Annan (1989) provides a rough estimate of the radar signal attenuation in a particular material:
α = 1.69 · 10
3·σ
√
ε (dB/m). (1)
The electromagnetic (EM) wave velocity plays an important role in defining the attenuation. For the frequency band of GPR, the velocity of the EM waves propagating in the ground depends on the relative dielectric permittivity of the material by the simplified equation:
v =√c
ε, (2)
where c is the EM wave velocity in empty space (0.3 m/ns). Hence, ε can be determined directly from EM wave veloc-ity, which can be more quickly and easily determined from the reflection profiles acquired in continuous mode, using the characteristic hyperbolic shape of the reflection from a point source (i.e. diffractions; Leucci et al., 2002).
In the radar profile undertaken in the surveyed area, several hyperbolic reflections (Fig. 4a), which allow for an accurate velocity analysis, are present. The application of this method points out an average velocity of 0.1 m/ns. Within the great quantity of reflections it is possible to note the main one, sub-horizontal and located at the time depth of 40 ns (about 2 m
in depth). This reflection (labelled T in Fig. 4a) is produced by the top of the cave.
The relatively low depth penetration related to the 500 MHz antenna does not allow one to put in evidence the bottom of the cave. To better evidence the fractures in the carbonate rock that constitute the roof of the cave, the radar profile must be processed. The radar data were processed us-ing the software Reflexw, produced by Sandmeier software (Sandmeier, 2002). The processing steps were:
– background removal filter; the average trace was
sub-tracted to remove the background;
– Kirchhoff migration; considering the amount of diffracted signal contained in the data, shown as hybolas on the raw data (Fig. 4a), the migration was per-formed to concentrate the diffracted energy into bright spots;
– gain function removal;
– amplitude compensation; in this case the function g(t )
is applied on the radar section. The function g(t) con-sists of a linear and an exponential part (Sandmeier, 2002): g(t ) = (1 + a · t ) · eb·t with (3) a = a 0 pulse width (4) b = α · v 8.69. (5)
The pulse width is automatically taken from the nominal fre-quency. The two parameters, a0 (linear gain, not dimen-sional) and α (exponential in dB/m), are the geometrical spreading and attenuation energy compensation:
– envelopes; due to the amount of diffracted arrivals
com-pared to reflected ones, amplitude envelopes were plot-ted versus time.
To estimate the average radar energy attenuation in the sub-soil the relationships (1) and (2) and the results of the ERT survey (Fig. 3b), were used. The average attenuation value of 1.13 dB/m was estimated.
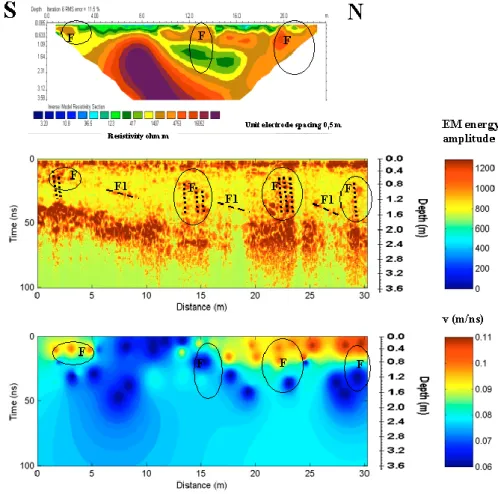
Figure 5b shows the processed data. Where radar energy is diffracted, the fractures are characterised by the presence of small discontinuities, representing karstic voids or recrystal-lyzed zones. Therefore, the zones with high back-scattered EM energy (labelled F) are related to more fractured carbon-atic rock. Furthermore, the processed radar profile (Fig. 5b) shows that most parts of the fractures (F zones in Fig. 5b) have vertical alignment while the other ones (labelled F1 in Fig. 5b) have almost horizontal alignment, slightly tilted to-ward north. By comparing the radar section (Fig. 5b) with the EM wave velocity profile (Fig. 5c), it is easy to identify the fractures filled with air (high velocity zone) and the frac-tures filled with other materials, such as clay or terra rossa (low velocity zone).
Fig. 5. Survey results: (a) 2-D electrical resistivity model; (b) envelopes processed radar section: the fracture with high EM energy scattering
are labelled F and F1; (c) EM wave velocity variation model. The integrated geophysical analyses outlined a highly unstable region in the investigated area.
6 Discussion
The GPR and ERT profiles were overlapped to compare and integrate the results (Fig. 5), in order to eliminate the ambigu-ity inherent in each method. To obtain information on rock quality from the radar section, the amplitude of the back-scatter signal was analysed. The amount of back-back-scattered energy depends on the quality of the rock (Cardarelli et al., 2003): the greater the degree of fracturing, the greater the energy backscatter, and vice versa. With regard to ERT, an estimate of the quality of the investigated rock in terms of re-sistivity values was carried out. Rere-sistivity values in a good quality carbonate rock ranges between 500 and 1500 m (Leucci et al., 2003), then a resistivity of about 4000 m suggests that the carbonate rock is highly fractured and filled with air. A lower resistivity value (100–500 m) suggests that the carbonate rock is highly fractured and filled with other materials, such as terra rossa.
Figure 5 shows the direct correspondence between the en-ergy content in the radar section (Fig. 5b) and the thickness of the high resistivity strata (4000 m) (Fig. 5a). There is also the direct correspondence between the energy content in the radar section and the EM wave velocity model (Fig. 5c).
In the radar section showed in Fig. 5b it is possible to also note the fractures geometry. The fractures, for the most part, are vertical and located close to each other (zones labelled F). Few fractures are almost horizontally aligned, slightly tilted toward north (labelled F1).
By superimposing the resistivity tomography and the 500-MHz antenna elaborated profile it is possible to observe that zones (F), with vertical fractures, correspond to not only highly loosened rock but also to instability areas of the cave. This illustrates the advantage of combining different methods which are based on different physical parameters and possess different sensitivity and resolution.
From the integration of ERT and 500 MHz GPR data, it was possible to eliminate ambiguity in the data interpreta-tion. From the ERT data the conductivity values allow one to estimate the radar energy attenuation in the shallow sub-soil, while the radar profile suggests the existence of frac-tured zones.
In the situations where direct methods, such as drilling, have the inconvenience of not being applicable, the ERT method supports the confirmation of results of the GPR method. In fact, the GPR method has a greater resolu-tion than the ERT method and therefore allows us to detect
22 G. Leucci and L. De Giorgi: Structural conditions of a karstic cave of archaeological importance isolated fractures and reconstruct their geometry, as shown
in Fig. 5b. The basic disadvantage of the GPR method is that many other heterogeneities appear in the sections that also could be mistaken for fractures.
7 Conclusions
The “Grotta delle Veneri” is one of the most important ar-chaeological site of the Salento peninsula, since its discov-ery confirmed the presence of the Neanderthal man in the Mediterranean Basin. For this motive it is important to safe-guard this archaeological site. The safesafe-guard of the “Grotta delle Veneri” and, therefore, its conservation can be per-formed by precise location of fractured zones.
In this research an integrated interpretation of the re-sults obtained from 2-D electrical resistivity tomography and ground penetrating radar data sets was used to identify frac-tures in a carbonate rock formation, in order to perform a preliminary evaluation of the stability of a karstic cave. Plot-ting the two data sets on the same scale produces reasonable data correlation and interpretation.
The 2-D electrical resistivity tomography method pro-vided estimates of the distribution of the resistivity in the shallow subsoil and, therefore, the mean conductivity dis-tribution that is a very important parameter in the radar en-ergy attenuation calculation. By combining EM wave ve-locity in the subsoil with the reflection geometry determined from GPR, ambiguities in the interpretation were minimised. The integration of the two geophysical methods is a use-ful tool in carrying out geognostic investigations at restricted sites, where invasive techniques, such as drillings, cannot be performed. The integrated geophysical analyses outlined, in the studied area, a highly unstable region in the zones la-belled F. The radar profile indicates very intense anomalies, most likely ascribable to open fractures. The electromagnetic wave velocity analysis, together with the ERT model analy-sis, allowed one to hypothesize if the fractures are void or filled with other materials (such as “terra rossa”).
This approach, if extended to the whole area of the cave, can be used to produce a 3-D map of the cave itself, to pro-vide more effective suggestions in order to obtain suitable conditions for the its conservation and safeguard.
Acknowledgements. The authors would like to thank S. Anchora
and the technicians, M. Luggeri and G. Fortuzzi, for their precious collaboration during data acquisition. The authors are also grateful to the reviewers for their valuable comments and remarks. Edited by: M. Parise
Reviewed by: H.-B. Havenith and another referee
References
Benson, A. K.: A case study of integrating and modelling seismic, gravity, radar, and geotechnical data to identify and characterise shallow geology especially concealed faulting, Proceedings of
the 28th Symposium on Engineering Geology and Geotechnical Engineering, Idaho State University, Rena, NV, 1–17, 1992. Cardarelli, E. and Bernabini, M.: Determination of parameters of
urban waste dumps, two case histories, J. Appl. Geophys., 36, 167–174, 1997.
Cardarelli, E., Marrone, C., and Orlando, L.: Evaluation of tun-nel stability using integrated geophysical methods, J. Appl. Geo-phys., 52, 93–102, 2003.
Conyers, L. B. and Goodman, D.: Ground-penetrating radar – An introduction for archaeologists, Alta Mira Press: Walnut Creek, 1997.
Cremonesi G.: La passione per l’origine, Giliano Cremonesi e la passione preistorica nel salento, 213–245, 1987.
Davis, J. L. and Annan A. P.: Ground-Penetrating Radar for high-resolution mapping of soil and rock stratigraphy, Geophys. Prosp., 37, 531–551, 1989.
Dobroka, M., Gyulai, A., Ormos, T., Csokas, J., and Dresen, L.: Join inversion algorithm of seismic and geoelectric data recorded in an underground coal mine, Geophys. Prosp., 39, 5, 643–666, 1991.
Grandjean, G. and Gourry, J. C.: GPR data processing for 3D frac-ture mapping in a marble quarry (Thassos, Greece), J. Appl. Geo-phys., 36, 19–30, 1996.
Heikkinen, E. J. and Saksa P. J.: Integrating geophysical data into bedrock model in site characterization for nuclear waste disposal, 60th Mtg. Eur. Assoc. Expl. Geophys., Expanded Abstracts, Vol. 1, EAGE, The Netherlands, Session 4–49, 1998.
Leucci, G., Negri, S., Carrozzo, M. T., and Nuzzo, L.: Use of ground penetrating radar to map subsurface moisture variations in an urban area, J. Env. Engin. Geophys. (JEEG), 7, 69–77, 2002.
Leucci, G., Margiotta, S., and Negri S.: Geophysical and geological investigations in a karstic environment (salice salentino, lecce, italy), J. Env. Engin. Geophys. (JEEG), 9, 25–34, 2003. Leucci, G.: I metodi elettromagnetico mpulsivo, elettrico e
sis-mico tomografico a rifrazione per la risoluzione di problem-atiche ambientali: sviluppi metodologici e applicazioni, PhD the-sis in Geophysics for Environmental and Territory, University of Messina, 2004.
Lin, Z., Hatherly, P., Vozoff, K., Engels, O. G., and Smith, G. H.: Joint application of seismic and electromagnetic methods to coal characterization at west cliff colliery, New South Wales, Experi-ment in Geophysics, 27, 4, 205–215, 1996.
Loke, M. H. and Barker R. D.: Rapid least-squares inversion of ap-parent resistivity pseudosections using a quasi-Newton method, Geophys. Prosp., 44, 131–152, 1996.
Loke, M. H.: Electrical imaging surveys for environmental and engineering studies, A practical guide to 2-D and 3-D surveys: RES2DINV Manual, IRIS Instruments, www.iris-instruments. com, 2001.
Orlando, L.: Semiquantitative evaluation of massive rock quality using ground penetrating radar, J. Appl. Geophys., 52, 1–9, 2003. Sandmeier, K. J.: Reflexw 3.0 manual, Sandmeier Software, Zipser
Strabe 1, D-76227 Karlsruhe, Germany, 2002.
Santarato, G., Nasser, A., and Chiara, P.: Prospezioni geofisiche in area urbana, Geologia Tecnica e Ambiente 4/98, 43–52, 1998. Toshioka, T., Tsuchida, T., and Sasahara, K.: Application of GPR to
detecting and mapping cracks in rock slopes, J. Appl. Geophys., 33, 119–124, 1995.