HAL Id: hal-02350569
https://hal.archives-ouvertes.fr/hal-02350569
Submitted on 6 Nov 2019HAL is a multi-disciplinary open access archive for the deposit and dissemination of sci-entific research documents, whether they are pub-lished or not. The documents may come from teaching and research institutions in France or abroad, or from public or private research centers.
L’archive ouverte pluridisciplinaire HAL, est destinée au dépôt et à la diffusion de documents scientifiques de niveau recherche, publiés ou non, émanant des établissements d’enseignement et de recherche français ou étrangers, des laboratoires publics ou privés.
Forced oscillation measurements of seismic wave
attenuation and stiffness moduli dispersion in
glycerine-saturated Berea sandstone
Samuel Chapman, Jan Borgomano, Hanjun Yin, Jerome Fortin, Beatriz
Quintal
To cite this version:
Samuel Chapman, Jan Borgomano, Hanjun Yin, Jerome Fortin, Beatriz Quintal. Forced oscillation measurements of seismic wave attenuation and stiffness moduli dispersion in glycerine-saturated Berea sandstone. Geophysical Prospecting, Wiley, 2018, �10.1111/1365-2478.12710�. �hal-02350569�
1
Forced oscillation measurements of seismic wave attenuation and stiffness moduli
1
dispersion in glycerine‐saturated Berea sandstone
2
3
Samuel Chapman1,2 (samuel.chapman@unil.ch), Jan V. M. Borgomano2, Hanjun Yin2,3,
4
Jerome Fortin2, and Beatriz Quintal1 5
6
1) Institute of Earth Sciences, University of Lausanne, Lausanne, Switzerland. 7
2) Laboratoire de Géologie, Ecole Normale Supérieure / CNRS UMR 8538, PSL Research 8
University, Paris, France. 9
3) State Key Laboratory of Petroleum Resources and Prospecting, China University of 10
Petroleum-Beijing, Beijing, China. 11
12
Abstract
13
Fluid pressure diffusion occurring on the microscopic scale is believed to be a significant 14
source of intrinsic attenuation of seismic waves propagating through fully saturated porous 15
rocks. The so-called squirt flow arises from compressibility heterogeneities in the 16
microstructure of the rocks. To study squirt flow experimentally at seismic frequencies the 17
forced oscillation method is the most adequate, but these studies are still scarce. Here we 18
present the results of forced hydrostatic and axial oscillation experiments on dry and 19
glycerine-saturated Berea sandstone, from which we determine the dynamic stiffness moduli 20
and attenuation at micro-seismic and seismic frequencies (0.004 – 30 Hz). We observe 21
frequency-dependent attenuation in response to the drained-undrained transition (~0.1 Hz) 22
and squirt flow (>10 Hz). The frequency-dependent attenuation and associated modulus 23
dispersion at 5 MPa effective stress is in fairly good agreement with the results of the 24
analytical solutions for the drained-undrained transition and squirt flow. The comparison with 25
2 very similar experiments performed also on Berea sandstone indicates that squirt flow can 26
potentially be a source of seismic wave attenuation across a large range of frequencies 27
because of its sensitivity to small variations in the rock microstructure, especially in the 28
aspect ratio of micro-cracks or grain contacts. 29 30 Key Words 31 - Attenuation 32 - Rock physics 33 34 1. Introduction 35 36
Porous rocks saturated with fluids can strongly attenuate seismic waves. Different forms of 37
wave-induced fluid flow (WIFF) are thought to be the primary intrinsic mechanism for 38
seismic wave attenuation (e.g. Pride et al. 2004). Fluid flow arises predominantly from 39
contrasts in compressibility either in the solid matrix of the rock, for instance between 40
compliant grain contacts and stiff pores, or in the saturating fluids, such as a heterogeneous 41
distribution of water and gas. In response to such compressibility contrasts, seismic waves 42
induce pressure gradients, resulting in viscous fluid flow and the conversion of the waves 43
mechanical energy into heat. The frequency dependence of the associated seismic attenuation 44
depends strongly on the spatial distribution or geometry of the heterogeneities in the rock 45
matrix and/or in the saturating fluids (Masson and Pride 2007, 2011; Müller et al. 2008). A 46
direct consequence of the frequency dependent attenuation is that the corresponding stiffness 47
modulus of the rock will also be frequency dependent. 48
3 Much focus has been given to squirt flow, pressure diffusion arising from microscopic 50
compressibility heterogeneities in the rock, as one of the dominant mechanisms for wave 51
attenuation in fluid saturated rocks. Numerous theoretical models (e.g. O’Connell and 52
Budiansky 1977; Mavko and Jizba 1991; Chapman et al. 2002; Gurevich et al. 2010; Adelinet 53
et al. 2011) have been developed to try to explain laboratory observations at sonic and
54
ultrasonic frequencies. More recently, with the progress made in using the forced oscillation 55
method (e.g. McKavanagh and Stacey 1974), squirt flow has been studied also at seismic 56
frequencies by using high viscosity fluids such as glycerine. 57
58
On a Fontainebleau sandstone sample saturated with glycerine, Pimienta et al. (2015a) 59
observe an extensional mode attenuation peak at between 1 and 10 Hz, which was reduced in 60
amplitude with increasing effective stress. Subramanyian et al. (2015) also measured the 61
extensional mode attenuation and Young’s modulus in Fontainebleau sandstone with similar 62
properties, in this case varying the fluid viscosity by mixing water and glycerine. For the fully 63
glycerine-saturated sample they observe an attenuation peak in a similar frequency range and 64
with similar amplitude, supporting the observation of Pimienta et al. (2015a). In addition 65
Subramanyian et al. (2015) used Gurevich et al.’s (2010) analytical solution of squirt flow to 66
interpret their observations, however the analytical solution consistently underestimated the 67
attenuation magnitude measured in the laboratory. The broad attenuation peaks observed were 68
attributed to a distribution of crack aspect ratios. 69
70
In a glycerine saturated Berea sandstone sample Mikhaltsevtich et al. (2015; 2016) measured 71
the dynamic Young’s modulus and Poisson ratio, from which they inferred the bulk and shear 72
moduli as well as the corresponding attenuation modes. By performing measurements at 73
temperatures from 31 to 23 °C, they observe a shift of the extensional-mode attenuation peak 74
4 from ~ 2 to ~ 0.4 Hz, associated with the reduction of the glycerine viscosity. Mikhaltsevtich 75
et al. (2015) interpreted the attenuation as being caused by squirt flow. Spencer and Shine
76
(2016) also performed forced oscillation experiments on a fully saturated Berea sandstone 77
sample, however only observing a partial attenuation curve. Similar to Mikhaltsevtich et al. 78
(2016) the impact of fluid viscosity was studied, however instead of modifying the 79
temperature, fluids of varying degrees of viscosity where used. Pimienta et al. (2017) 80
investigated frequency-dependent attenuation and modulus dispersion in four different types 81
of sandstone, including Berea sandstone, under full water and glycerine saturation. In the 82
Wilkenson and Bentheim sandstones both showed frequency dependent attenuation likely in 83
response to squirt-flow, showing a strong sensitivity to changes in effective pressure. 84
However in the Berea sandstone samples the presence of squirt flow could not be verified in 85
the considered frequency range. 86
87
Even though there has been a recent surge in the availability of laboratory data from fully 88
saturated sandstones at seismic frequencies (<100 Hz), the overall understanding of the 89
physical processes responsible for the frequency-dependent attenuation and modulus 90
dispersion remains incomplete. Comparing experiments is especially challenging given the 91
variation in microstructure between samples and the use of a range of different saturating 92
fluids. Furthermore the analysis is considerably complicated by the impact or not of boundary 93
conditions on the observed frequency-dependent attenuation, which is associated with the 94
design of the experimental apparatus (e.g., Pimienta et al., 2016). 95
96
To contribute to the available data, we present in the following sections the results of forced 97
hydrostatic and axial oscillation experiments on a Berea sandstone sample. The experiments 98
where performed on the dry and fully glycerine-saturated sample for a range of effective 99
5 stresses. We will provide a description of the sample and the experimental conditions. The 100
discussion of our results for the dispersion of the stiffness moduli and corresponding 101
attenuation modes will focus on the uncertainty in our measurements, the physical processes 102
responsible for our observations, how the theoretical predictions compare to our observations, 103
and how our observations compare to those of Mikhaltsevtich et al. (2016), whose 104
experiments are the most similar to ours. 105
106
2. Samples and experimental methodology
107
108
2.1 Sample description 109
110
Three samples with a ~4 cm diameter and ~8 cm length were cored from a block of Berea 111
sandstone with poorly defined bedding planes, running parallel to the samples vertical axis. 112
The Berea sandstone was acquired from Cleveland Quarries in the United States with a brine 113
permeability estimated at 75 to 250 mD. The glycerine permeability of sample BS-V5 was 114
subsequently measured at an effective stress of 2.5 MPa by imposing a pressure gradient 115
across the sample and measuring the associated flow. The porosity was determined with a 116
pyknometer, using a subsection of sample BS-V6. The dry density is the mean density 117
determined from the dry masses and dimensions of the three samples. These properties are 118
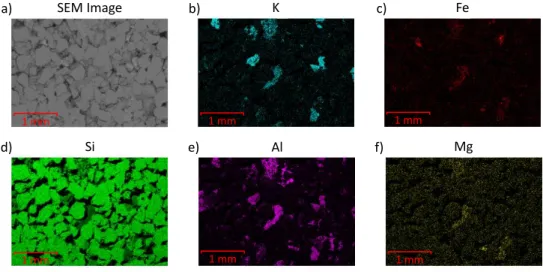
listed in Table 1. Scanning electron microscopy (SEM) and energy dispersion spectrometry 119
(SEM-EDS) analysis (Figure 1) shows that our sample is composed largely of quartz (Si), 120
with smaller amounts feldspar and clays (Al) [can we be more precise and give the 121
composition according Fig1?]. Kareem et al. (2017) performed an extensive characterisation 122
of Berea sandstone cores, also purchased from Cleveland Quarries, showing that clays make 123
up between 3 and 9 % of the bulk composition, with the predominant clay being kaolinite. 124
6 125
Table 1. Sample properties
126
BS-V4 to BS-V6 Glycerine Permeability (mD) 58.7 1.14* Porosity (%) 22.15 Dry Density (kg/m3) 2087 6.55 * Measured at 2.5 MPa effective stress.
127
128
129
Figure 1. a) Scanning electron microscopy (SEM) image of the polished surface of BS-V6.
130
Energy dispersion spectrometry (EDS‐SEM) images of the same sample portion showing the 131
distribution of b) potassium (K), c) iron (Fe), d) silicon (Si), e) aluminium (Al) and f) 132
magnesium (Mg). 133
134
2.2 Experimental setup - dynamic moduli and attenuation modes 135
136
Forced oscillation measurements were performed in a tri-axial cell at ENS Paris. Borgomano 137
et al. (2017) provide a detailed description of the experimental setup and data processing.
138
Pimienta et al. (2015a,b) provide further details on the calibration of the apparatus with 139 1 mm a) SEM Image 1 mm b) K 1 mm e) Al 1 mm d) Si 1 mm f) Mg 1 mm c) Fe
7 standard materials. We will briefly list the governing relations used to determine the various 140
moduli and associated attenuation modes. 141
142
Two types of stress oscillation on the sample, producing strains on the order of ~10-6, can be
143
performed in this cell: hydrostatic and axial. The hydrostatic oscillation (410-3 to ~1 Hz) is 144
induced by the confining pressure pump (Adelinet et al. 2010; David et al. 2013) and allows 145
for directly measuring the sample’s dynamic bulk modulus from the confining pressure 146
oscillation Pc = -ii/3, where ii (i = 1,2,3) are the principal stresses, and the associated
147
volumetric strain vol as follows: [In formula 1, we don t need the negative sign, if we 148
consider E_vol positive in compaction] 149
Khydro=-DPc
evol . (1)
150
The volumetric strain is determined from the average strain measured by 8 strain gauges, 151
comprising four pairs of radial and axial strain gauges, as vol = 3avg. 152
153
The axial oscillation (110-1 to ~20 Hz) is induced by a piezo-electric actuator placed
154
between the sample and the axial piston of the cell and allows for measuring the sample’s 155
Poisson ratio and Young’s modulus E: 156 n= -erad eax and E= sax eax , (2) 157
where the axial stress ax, is determined from the deformation of the aluminium end plate of 158
known Young’s modulus, and rad and ax are the average radial and axial strains on the 159
sample. Given the Poisson ratio and Young’s modulus, the axial bulk Kax and shear Gax
160
moduli can be inferred as follows: 161
8 Kax= E 3 1
(
-2n)
and Gax= E 2 1( )
+n . (3) 162 163For each mode of deformation, the attenuation can be determined from the phase shift 164
between the applied stress and resulting strain ( = stress - strain). The bulk attenuation for 165
the hydrostatic oscillation can be determined from the phase shift between the hydrostatic 166
stress Pc and the volumetric strain vol, such that:
167
Dfhydro=f-DPc-fevol. [Here again, the negative sign in Pc is not usefull]
168
(4) 169
The extensional mode attenuation is in turn determined from the phase shift between the axial 170
stress ax and strain ax, such that: 171
Dfextensional =fsax-ferad. (5)
172
Assuming that the sample is isotropic, the bulk and shear attenuation can be inferred from the 173
phase shift between the axial stress ax and the axial and radial strains ax and rad (Borgomano 174 et al. 2017): 175 Dfbulk=fs ax-feax+2erad and Df shear =fsax-feax-erad , (6) 176
where the phases of ax + 2rad and ax - rad are derived from combining equations 2 and 3. 177
The attenuation corresponding to each deformation mode can be calculated as (O’Connell and 178 Budiansky 1978): 179 Q-1=tan
( )
Df . (7) 180 181 2.3 Experimental conditions 182 1839 Axial and hydrostatic oscillations, were performed on the dry and glycerine-saturated sample 184
(BS-V5). Axial oscillations were performed at effective stresses between 2.5 and 25 MPa, 185
with an additional static axial load of 2 MPa. We will refer to the effective stress as the 186
difference between the confining and fluid pressure, eff = Pc – Pf. The static axial load is
187
applied to ensure coupling between the sample and the piezoelectric actuator. The hydrostatic 188
oscillations were performed for the same range of effective stresses, however without 189
imposing an additional static axial load. Before saturating the sample with glycerine, a 190
vacuum pump was used to remove air from its pore space. Glycerine was then pumped into 191
the sample using two Quizix pumps that subsequently regulated the fluid pressure at 4 MPa. 192
193
3. Results and Discussion
194
3.1 Measurement Uncertainty 195
196
To assess the uncertainty in our measured frequency-dependent moduli and attenuation we 197
look at the repeatability of the measurements and the variation of the data with respect to an 198
idealized model. The moduli and attenuation are inferred from the strain measured on the 199
sample. For hydrostatic forced oscillations we have eight measurements of strain, while for 200
axial forced oscillations we have a pair of averages consisting of two axial and radial 201
measurements of strain on opposing sides of the sample. We determine the repeatability of 202
our moduli and attenuation for hydrostatic oscillations by taking the standard deviation over 203
the eight measurements of strain. In the case of the axial oscillations we only have two 204
measurements of each moduli and its corresponding attenuation, we therefore estimate the 205
repeatability of our measurements from their range. To assess the variation of our data with 206
respect to an idealized model we follow Adam et al.’s (2006) procedure of fitting a linear 207
10 function of log10(frequency) to the mean of our measured data and determining the
root-208
mean-squared-error (RMSE). 209
210
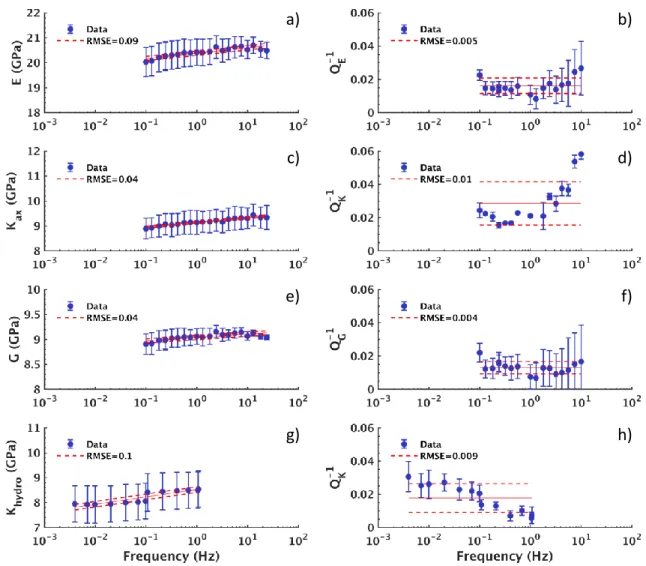
Figure 2 shows the moduli and corresponding attenuation inferred from axial and hydrostatic 211
oscillations performed on the dry sample at 5 MPa effective stress. The moduli increase 212
moderately towards higher frequencies and the measurement range generally exceeds the 213
variation of the measurement mean around the fit. For the corresponding attenuation the 214
measurement range is much more variable and, for the Young’s and shear components, it 215
increases towards higher frequencies. Attenuation is only shown up to 10 Hz, because at 216
higher frequencies it strongly deviates from the fitting trend (Figure 2b, d and f). The 217
measurement range appears to largely over estimate our uncertainty, however it also shows 218
that the uncertainty is not independent of frequency. In the following sections we will 219
therefore present the range when error bars are displayed. 220
221
222
11 224
Figure 2. Frequency-dependent moduli and corresponding attenuation inferred from axial and
225
hydrostatic forced oscillations on the dry sample at 5 MPa effective stress. The data points 226
represent the mean measurement and the error-bars indicate the range of the measurements 227
for axial oscillations (a – f) and the standard deviation in the measurements for hydrostatic 228
oscillations (g – h). A linear function of log10(frequency) is fit to the data and the
root-mean-229
squared-error (RMSE) is indicated in the legend. 230
231
3.2 Frequency dependence – glycerine saturation 232 233 a) b) c) d) e) f) g) h)
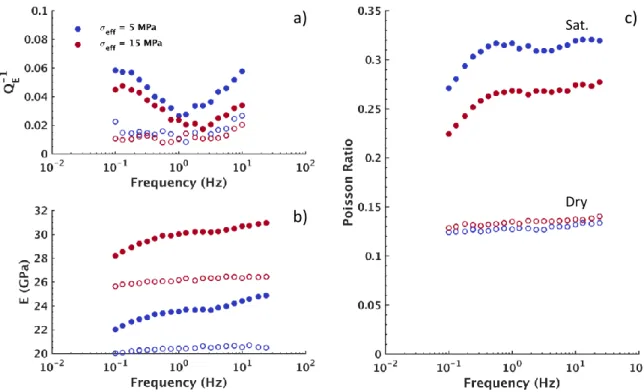
12 When the sample is glycerine saturated all modes show significant frequency dependent 234
attenuation (Figures 3a, 4a and 5a). For the extensional (Figure 3a) and bulk attenuation 235
(Figure 4a) two peaks are observed: one at ~0.1 Hz and another beginning at ~3 Hz and 236
above. For the shear attenuation (Figure 5a) however only the attenuation peak at higher 237
frequencies is observed. The attenuation peak at ~0.1 Hz is reduced in amplitude as the 238
effective stress is increased. The second partial peak at higher frequencies is likewise reduced 239
in amplitude, however at 15 MPa effective stress the measured attenuation is comparable in 240
amplitude to the attenuation measured for the dry sample. 241
242
As with the attenuation the various stiffness moduli are frequency-dependent once the sample 243
is saturated with glycerine (Figures 3b, 4b and 5b). The overall increase in the sample’s 244
stiffness from dry to glycerine saturated is particularly observed in the Young’s modulus 245
(Figure 3b). The shear modulus at low frequencies is on the order of the shear modulus of the 246
dry sample (Figure 5b). Towards higher frequencies the shear modulus shows some 247
dispersion. The Young’s and bulk moduli are dispersive at both ~0.1 Hz and again beginning 248
at ~3 Hz. Overall the moduli become less dispersive with increasing effective stress. At high 249
frequencies the bulk modulus possibly converges to a common limit. The Poisson ratio 250
(Figure 3c) is significantly increased with respect to the Poisson ratio measured in the dry 251
sample and is frequency dependent (Figure 3c). For the saturated sample, with increasing 252
effective stress the Poisson ratio is reduced and at high frequencies it is nearly frequency 253
independent. 254
255
Because the stress applied to the sample for the hydrostatic oscillation is determined from a 256
pressure transducer close to the sample in the confining oil, while for the axial oscillation the 257
stress it is determined from the deformation of the aluminium end plate on which the sample 258
13 is placed, the bulk modulus and attenuation can be measured independently by these two 259
methods. If the sample BS-V5 is in fact isotropic then the bulk modulus and attenuation 260
measured by these two methods should be the same. In Figure 4 we show the bulk modulus 261
and attenuation determined from both the hydrostatic and axial oscillations. We observe that 262
the bulk modulus and attenuation are generally independent of the measurement type. 263
However as the effective stress is increased the hydrostatic measurements do show a slightly 264
higher bulk modulus than the axial measurements. 265
266
In the dry measurements our measurement uncertainty increased with frequency and we 267
observed significant frequency dependent attenuation above 10 Hz, indicating misalignments 268
in the experimental set up or an inability of the piezo-electric actuator to generate a sinusoidal 269
signal. To verify the quality of our measurements on the glycerine-saturated sample we 270
therefore make use of the Kramers-Kronig relations to check for the causality between our 271
measured attenuation and moduli. We perform a linear interpolation to the attenuation and 272
apply the Kramers-Kronig relations given by Mikhaltsevitch et al. (2016). We do this for the 273
bulk (Figure 4) and shear (Figure 5) components and observe a satisfactory fit between the 274
moduli and the respective attenuation. 275
276
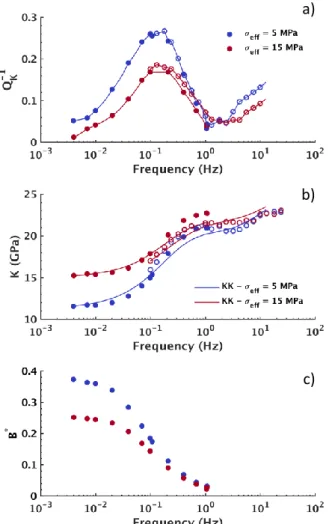
The attenuation peak observed at ~0.1 Hz is caused by the drained-undrained transition, 277
which is a boundary condition problem of fluid saturated samples. The forced oscillation of 278
the sample induces fluid pressure diffusion from the sample into the connecting pore fluid 279
lines. The diffusion of pore fluid pressure can be described in terms of a pseudo-skempton 280
coefficient, defined as (Pimienta et al. 2015b): 281
B*= Dpf
DPc, (10)
14 where pf is the fluid pressure amplitude measured in the pore fluid line and Pc is the
283
confining pressure amplitude. In Figure 4c we see that the pseudo-skempton coefficient is 284
elevated at low frequencies, indicating that the glycerine had enough time to flow in response 285
to the confining pressure oscillation and raise the pressure in the pore fluid lines. At low 286
frequencies (0.01 Hz) the sample can therefore be considered partially drained. The pseudo-287
skempton coefficient approached zero as the frequency of the confining pressure oscillation 288
increases, because the fluid no longer has the time to diffuse form the sample and raise the 289
pressure in the pore fluid lines. At high frequencies (1 Hz) the sample is therefore undrained. 290
Increasing the effective stress increases the sample stiffness, which means that a larger 291
portion of the load is carried by the frame of the sample and not transferred to the fluid. The 292
consequence of increasing the effective stress is that the pseudo-skempton coefficient is also 293
reduced, which is consistent with the observations of Hart and Wang (1999) for the variation 294
of the Skempton’s coefficient with effective stress for Berea sandstone. 295
296
The second partial attenuation peak observed at above ~3 Hz on the other hand is likely in 297
response to squirt flow arising from microscopic compressibility heterogeneities in the rock. 298
This is indicated in part by the sensitivity of the measured attenuation to an increase in 299
effective stress resulting in a reduction of the compliant porosity and a corresponding 300
reduction in attenuation. Indicative of squirt flow is also the dispersion in the shear modulus 301
and corresponding attenuation, which is not the case for attenuation associated with the 302
drained-undrained transition (Figure 5). 303
304
305
15 307
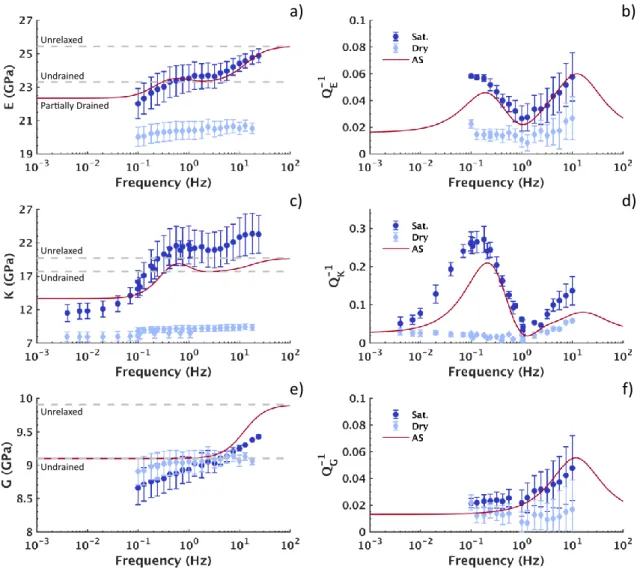
Figure 3. a) Extensional attenuation QE-1, b) Young’s modulus E and c) Poisson ratio for the
308
dry and glycerine-saturated sample BS-V5 inferred from forced axial oscillations. The sample 309
was subjected to a static axial stress of 2 MPa. The legend provides the applied effective 310
stress eff. Open symbols indicate the dry sample and filled symbols indicate glycerine-311 saturated sample. 312 313 a) c) b) Dry Sat.
16 314
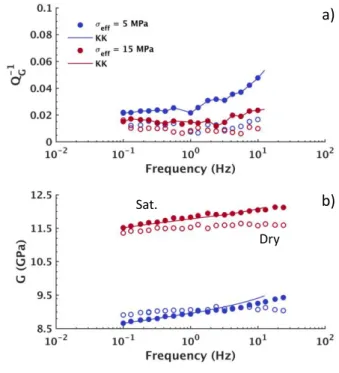
Figure 4. a) Attenuation QK-1, b) bulk modulus K and c) the Pseudo-Skempton coefficient B*
315
for the glycerine-saturated sample BS-V5 determined from forced axial (open symbols) and 316
hydrostatic oscillations. Also shown are the results of Kramers-Kronig (KK) relations 317
determined from a cubic spline fit to the measured attenuation. For the axial oscillations the 318
sample was subjected to a static axial stress of 2 MPa. The legend provides the applied 319
effective stress eff. 320
321
a)
b)
17 322
Figure 5. a) Attenuation QG-1 and b) shear modulus G for the dry and glycerine-saturated
323
sample BS-V5 determined from forced axial oscillations. Also shown are the results of 324
Kramers-Kronig (KK) relations. The sample was subjected to a static axial stress of 2 MPa. 325
The legend provides the applied effective stress eff. Open symbols indicate the dry sample 326
and filled symbols indicate the glycerine-saturated sample. 327
328 329
3.3 Drained-undrained transition and squirt flow 330
331
A number of analytical solutions have been developed to explain modulus dispersion and 332
attenuation related to squirt flow (e.g. Mavko and Jizba 1991; Chapman et al. 2002). Here we 333
will use Gurevich et al.’s (2010) analytical solution which describes the pressure diffusion 334
between compliant and stiff pores for an oscillating stress. At low frequencies the solution 335
converges to Gassmann’s (1951) undrained limit and at high frequencies converges to Mavko 336
and Jizba (1991) unrelaxed limit. The analytical solution assumes that the rock is isotropic, 337
making it applicable to sample BS-V5, with penny shaped cracks having a uniform aspect 338
a)
b) Dry
18 ratio. To investigate the drained-undrained transition we will in turn use the 1-D analytical 339
solution from Pimienta et al. (2016) for the fluid pressure diffusion along the vertical axis of a 340
sample subjected to a hydrostatic pressure oscillation. At high frequencies the solution 341
converges to Gassmann’s (1951) undrained limit. 342
343
The input parameters for both models are given in Tables 2 and 3 and correspond to a sample 344
subjected to an effective stress of 5 MPa. The drained bulk and shear moduli are measured 345
from the forced axial oscillations on the dry sample. The compliant porosity, c, was
346
estimated from the volumetric strain measured on the dry sample, following the procedure 347
described in Appendix A of Gurevitch et al. (2010). The high pressure bulk modulus required 348
by the squirt flow model corresponds to the bulk modulus measured at 25 MPa confining 349
pressure form the forced axial oscillations on the dry sample. The aspect ratio of the 350
compliant cracks cannot be accurately determined from the mechanical and SEM data and is 351
therefore used as a fitting parameter, as it only impacts the frequency dependence. However, 352
an order of magnitude estimation of the aspect ratio can be obtained from Walsh (1965): 353 a»4Pclosure 1-n 2
( )
pE , (11) 354 355where Pclosure is the confining pressure at which the compliant cracks closed in the dry sample,
356
while E is the Young’s modulus and is the Poisson’s ratio. Considering a closure pressure of 357
around 25 MPa, at which we measured a Young’s modulus of ~28 GPa and Poisson’s ratio of 358
~0.14, we can infer that the characteristic aspect ratio should be on the order of ~110-3, 359
which is consistent with our choice of aspect ratio (Table 4). 360
19 Figure 6 shows the combined result of the two analytical models together with the moduli and 362
attenuation measured on the dry and glycerine-saturated sample at 5 MPa effective stress. 363
Neither model accounts for the attenuation resulting from frictional dissipation along grain 364
contacts, therefore the attenuation measured in the dry sample is added to the model result 365
(Tisato and Quintal 2013; 2014). The Young’s modulus (Figure 6a) and attenuation (Figure 366
6b) derived form the models reproduce well the laboratory observation, while for the bulk 367
modulus dispersion (Figure 6c) and attenuation (Figure 6d) are slightly underestimated. The 368
shear modulus measured in the glycerine-saturated sample is reduced relative to the dry 369
sample (Figure 6e) and the model therefore does not fit it as well. However the shear-mode 370
attenuation (Figure 6f) is reasonably well reproduced. 371
20 373
Figure 6. The measured moduli and attenuation for the dry and glycerine saturated sample
374
BS-V5 at 5 MPa effective stress determined from both axial and hydrostatic oscillations 375
together with the results of the analytical solutions (AS) for the drained-undrained transition 376
and squirt flow. 377
378
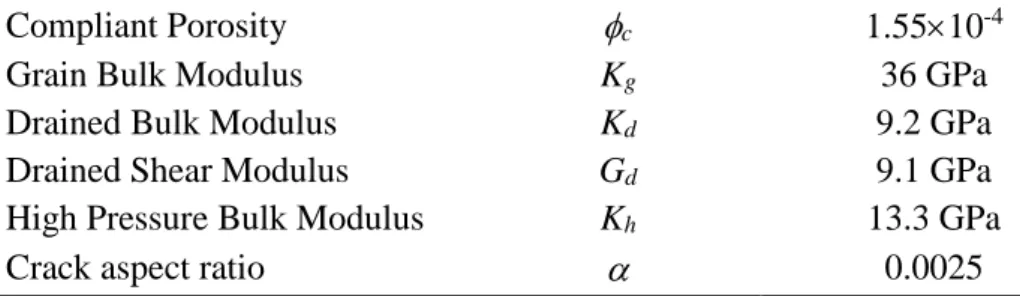
Table 2. Rock and fluid properties for the simple isotropic squirt flow model for sample
BS-379
V5 subjected to an effective stress of 5 MPa. 380
Parameters Symbol Model Input Fluid Fluid Bulk Modulus Kf 4.36 GPa
Viscosity 1.087 Pa s
21 Compliant Porosity c 1.5510-4
Grain Bulk Modulus Kg 36 GPa
Drained Bulk Modulus Kd 9.2 GPa
Drained Shear Modulus Gd 9.1 GPa
High Pressure Bulk Modulus Kh 13.3 GPa
Crack aspect ratio 0.0025 381
382
Table 3. Rock and fluid properties for the 1D-model of the drained-undrained transition for
383
sample BS-V5 subjected to an effective stress of 5 MPa. 384
Parameter Symbol Model Input
Fluid
Fluid Bulk Modulus Kf 4.36 GPa
Viscosity 1.087 Pa s Rock Length L 0.083 m Diameter D 0.04 m Porosity 0.2215 Permeability 58.7 mD Grain Bulk Modulus Kg 36 GPa
Drained Bulk Modulus Kd 9.2 GPa
Dead Volume Dead Volume Vdead vol. 2610-6 m3
385
3.4 Comparison with previous experimental results 386
387
Our experiments are very similar to those performed by Mikhaltsevitch et al. (2015; 2016), 388
also on a glycerine-saturated Berea sandstone sample. Their sample D had a permeability of 389
71 mD, a porosity of 19 %, and while mainly composed of quartz (80 %) and feldspar (12 %) 390
also had substantial amounts of kaolinite (8 %), making it very similar to our sample BS-V5. 391
In their study, the forced axial oscillation measurements were performed on both the dry and 392
glycerine-saturated sample at 10 MPa effective stress. Under glycerine saturation the pore 393
22 pressure was maintained at 3 MPa. The measurements were also preformed at different 394
temperatures ranging from 23 to 31 °C. For the sake of comparing our data to theirs we will 395
only consider the measurements performed at 23 °C. Mikhaltsevitch et al. (2015) are 396
confident that their measurements are performed under undrained conditions, based on 397
Gassmann’s predictions, matching well their measured bulk modulus at low frequencies. 398
They interpret the observed frequency-dependent attenuation to be in response to squirt flow. 399
400
In Figure 7 we compare the Young’s modulus and attenuation measured in the dry and 401
glycerine-saturate sample D of Mikhaltsevitch et al. (2016) (Figure 7a and b) to that measured 402
in our sample BS-V5 (Figure 7c and d). It is important to note that we are showing our 403
measurements performed at 5 MPa effective stress, because we did not perform 404
measurements at 10 MPa effective stress. However, as seen in section 3.2 we observed that 405
increasing the effective stress reduces the attenuation amplitude but does not result in a large 406
shift of the attenuation peaks with respect to frequency. While sample D is more 407
compressible, under dry conditions it is less attenuating than sample BS-V5, which could 408
indicate a minor dependence of our sample on the strain amplitude (e.g. Gordon and Davis 409
1968; Winkler et al. 1979). However frequency-dependent attenuation in response to wave-410
induced fluid flow should be approximately independent of strain (Tisato and Quintal 2014). 411
Mikhaltsevitch et al. (2016) observe the attenuation peak that they attribute to squirt flow at 412
~0.4 Hz (Figure 7b), while for our sample the attenuation peak we attribute to squirt flow is at 413
>10 Hz (Figure 7d). A shift of the attenuation peak by 1 to 2 orders of magnitude can be 414
explained by a minor variation in the characteristic crack aspect ratio of the sample, given that 415
the characteristic frequency of squirt flow is proportional to the cube of the aspect ratio 416
(O’Connell and Budiansky 1977; Gurevich et al. 2010). 417
23 Included in Figure 7a and b we show the result of Gurevich et al.’s (2010) squirt flow model. 419
As input parameters we use the bulk and shear modulus and porosity of the dry sample D 420
(Mikhaltsevitch et al. 2015). The other rock parameters for the model where not available, 421
therefore the other parameters are the same as for sample BS-V5 (Table 2), with the exception 422
of the crack aspect ratio which is again used as a fitting parameter. Both the Young’s modulus 423
(Figure 7a) and the attenuation (Figure 7b) are underestimated by the analytical solution, 424
which is possibly related to the choice of the high-pressure bulk modulus that controls the 425
bulk modulus dispersion. Mikhaltsevitch et al. 2015 show the frequency dependent bulk 426
modulus inferred from the measured Young’s modulus and Poisson’s, which is highly 427
dispersive and which the analytical solution cannot account for with the choice of parameters. 428
An important aspect of the analytical solution is that it does not account for a distribution of 429
aspect radii and therefore the asymptote of attenuation at low frequencies scales as Q-1 f, 430
while at high frequencies scales as Q-1 f -1 (Gurevich et al. 2010). The comparison between 431
the measured attenuation and result of the analytical indicates that the sample D indeed has a 432
distribution of aspect radii as would be expected (e.g. Cheng and Toksöz 1979, Subramanyian 433
et al. 2015). In sample BS-V5 (Figures 7c and d) it is not clear whether the sample has a
434
narrower distribution in aspect radii, given that the attenuation curve is only partially 435
observed. 436
437
Berea sandstone has been extensively studied in the past and it contains substantial amounts 438
of clay, which fills pores and coats grains (e.g. Kareem et al. 2017). Christensen and Wang 439
(1985) observed an increase in compressional wave velocities and a decrease in shear wave 440
velocities with pore pressure in water saturated Berea sandstone, attributing the observations 441
to the high compressibility of clays that make up parts of the cement. Zoback and Byerlee 442
(1975) also attribute the compressibility of clay to the increase in permeability with increasing 443
24 pore pressure in Berea sandstone. At seismic frequencies Pimienta et al (2017) observe a 444
sensitivity of the frequency dependent Poisson ratio to fluid pressure in a Berea sandstone 445
sample saturated with a glycerine-water mixture. They apply different fluid pressures up to 9 446
MPa at a constant effective stress of 1 MPa, however they do not elaborate on what may be 447
inducing the increase in Poisson’s ratio with fluid pressure. Although the experiments carried 448
out in our study are very similar to those of Mikhaltsevitch et al. (2016) in terms of rock type, 449
fluid properties and the range of effective stresses applied, the fluid pressure was 4 MPa in 450
sample BS-V5 and 3 MPa for sample D. The difference in fluid pressure is not very large, 451
however, for future research on squirt flow as an attenuation mechanism, the impact of 452
changes in fluid pressure could be very interesting because of the sensitivity of squirt flow to 453
crack aspect ratio. In Berea sandstone, where clays coat grains, a variation in fluid pressure at 454
constant effective stress could facilitate a change in crack aspect ratio, which could in turn be 455
identified in the measured frequency dependence of attenuation and modulus dispersion. 456
25 458
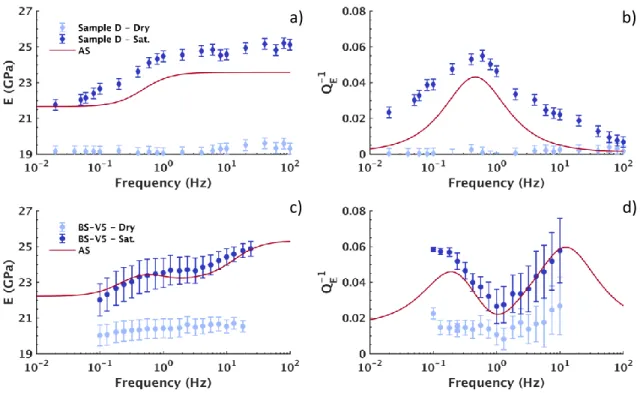
Figure 7. a) Young’s modulus and b) attenuation QE-1 for the dry and glycerine-saturated
459
Berea sandstone (sample D) measured at 10 MPa effective stress by Mikhaltsevitch et al. 460
(2016), together with the results of the analytical solution (AS) for squirt flow. For 461
comparison, c) the Young’s modulus and d) attenuation QE-1 of the dry and
glycerine-462
saturated sample BS-V5 at 5 MPa effective stress, together with the results of the analytical 463
solutions for the drained-undrained transition and squirt flow. 464
465
4. Conclusions
466
467
We performed hydrostatic and axial forced oscillations experiments on a dry and glycerine-468
saturated Berea sandstone sample. In the glycerine saturated sample the measured attenuation 469
is frequency dependent with an attenuation peak at ~0.1 Hz and a second, partial, peak 470
beginning at ~3 Hz. The first attenuation peak is in response to fluid pressure diffusion from 471
the sample into the pore fluid lines, referred to as the drained-undrained transition. The 472
second partial attenuation peak is likely in response to squirt flow, resulting from microscopic 473
a)
c)
b)
26 heterogeneities in the compressibility of the porous solid frame of the rock. The fit of 474
analytical solutions for the drained-undrained transition and squirt flow satisfactorily 475
reproduced the measured attenuation and moduli. A comparison with independently 476
conducted experiments on a very similar sample under comparable conditions appears to 477
confirm the sensitivity of squirt flow to variations in the characteristic aspect ratios of the 478 compliant porosity. 479 480 Acknowledgments 481 482
This work is supported by a grant from the Swiss National Science Foundation. We thank 483
Marie Violay for access to the EPFL Laboratory of Experimental Rock Mechanics, Laurent 484
Gastaldo for coring the samples from the source blocks and Lucas Pimienta for doing the 485
porosity measurements. We thank Jean-Pierre Burg for access to the ETH Zurich Rock 486
Deformation Laboratory and Claudio Madonna for helping with the sample preparation. The 487
data for this paper are available by contacting the authors. 488
489
References
490
491
Adam L., Batzle M. and Brevik I. 2006, Gassmann fluid substitution and shear modulus 492
variability in carbonates at laboratory seismic and ultrasonic frequencies. Geophysics, 71, 493
F173-F183. 494
495
Adelinet M., Fortin J., Gueguen Y., Schubnel A. and Geoffroy L. 2010. Frequency and fluid 496
effects on elastic properties of basalt: Experimental investigations. Geophysical Research 497
Letters, 37, L02303. 498
27 499
Adelinet M., Fortin J. and Gueguen Y. 2011. Dispersion of elastic moduli in a porous-cracked 500
rock: Theoretical predictions for squirt-flow. Tectonophysics, 503, 173-181. 501
502
Batzle M. L., Han D.-H. and Hofmann R. 2006. Fluid mobility and frequency-dependent 503
seismic velocity - Direct measurements. Geophysics, 71, N1-N9. 504
505
Borgomano J. V. M., Pimienta L., Fortin J. and Gueguen Y. 2017. Dispersion and attenuation 506
measurements of elastic moduli of a dual-porosity limestone. Journal of Geophysical 507
Research: Solid Earth, 122, doi:10.1002/2016JB013816. 508
509
Chapman M., Zatspin S. V. and Crampin S. 2002. Derivation of a microstructural poroelastic 510
model. Geophysical Journal International, 151, 427-451. 511
512
Cheng C. H. and Toksöz M. N. 1979. Inversion of Seismic Velocities for the Pore Aspect 513
Ratio Spectrum of Rock. Journal of Geophysical Research, 84, 7533-7543. 514
515
Christensen N. I. and Wang H. F. 1985. The influence of pore pressure and confining pressure 516
on dynamic elastic properties of Berea sandstone. Geophysics, 50, 207-213. 517
518
Collet O. and Gurevich B. 2016. Frequency dependence of anisotropy in fluid saturated rocks 519
– Part II: Stress-induced anisotropy case. Geophysical Prospecting, 64, 1085-1097. 520
28 David E. C., Fortin J., Schubnel A., Gueguen Y. and Zimmerman R. W. 2013. Laboratory 522
measurements of low- and high-frequency elastic moduli in Fontainebleau sandstone. 523
Geophysics, 78, D369-D379. 524
525
Dunn K.-J. 1987. Sample boundary effect in acoustic attenuation of fluid-saturated porous 526
cylinders. Journal of the Acoustical Society of America, 81, 1259-1266. 527
528
Gardner G. H. F. 1962. Extensional waves in fluid-saturated porous cylinders. Journal of the 529
Acoustical Society of America, 34, 36-40. 530
531
Gassmann F. 1951. Über die Elastizität poröser Medien: Vierteljahrsschrift der 532
Naturforschenden Gesellschaft in Zürich, 96, 1-23. 533
Gurevich B., Makaryska D., de Paula O. S. and Pervukhina M. 2010. A simple model for 534
squirt-flow dispersion and attenuation in fluid-saturated granular rocks. Geophysics, 75, 6. 535
536
Gordon R. B. and Davis L. A. 1968, Velocity and Attenuation of Seismic Waves in 537
Imperfectly Elastic Rock. Journal of Geophysical Research, 73, 3917-3935. 538
539
Hart D. J. and Wang H. F. 1999. Pore pressure and confining stress dependence of poroelastic 540
linear compressibilities and Skempton’s B coefficient for Berea sandstone. American Rock 541
Mechanics Association, 37th US Rock Mechanics Symposium. 542
543
Johnston D. H., Toksöz M. N. and Timur A. 1979. Attenuation of seismic waves in dry and 544
saturated rocks: II. Mechanisms. Geophysics, 44, 691-711. 545
29 Kareem R., Cubillas P., Gluyas J., Bowen L., Hillier S. and Greenwell H. C. 2017, Multi-547
technique approach to the petrophysical characterization of Berea sandstone core plugs 548
(Cleveland Quarries, USA). Journal of Petroleum Science and Engineering, 147, 436-455. 549
550
Masson Y. J. and Pride S. R. 2007. Poroelastic finite difference modeling of seismic 551
attenuation and dispersion due to mesoscopic-scale heterogeneity. Journal of Geophysical 552
Research, 112, B03204, doi:10.1029/2006JB004592. 553
554
Masson Y. J. and Pride S. R. 2011. Seismic attenuation due to patchy saturation. Journal of 555
Geophysical Research, 116, B03206, doi:10.1029/2010JB007983. 556
557
Mavko G. and Jizba D. 1991. Estimating grain-scale fluid effects on velocity dispersion in 558
rocks. Geophysics, 56, 1940-1949. 559
560
McKavanagh B. and Stacey F.D. 1974. Mechanical hysteresis in rocks at low strain 561
amplitudes and seismic frequencies. Physics of the Earth and Planetary Interiors, 8, 246–250. 562
563
Mikhaltsevitch V., Lebedev M. and Gurevich B. 2015. A laboratory study of attenuation and 564
dispersion effects in glycerol-saturated Berea sandstone at seismic frequencies. SEG, doi: 565
http://dx.doi.org/10.1190/segam2015-5898429.1.
566
567
Mikhaltsevitch V., Lebedev M. and Gurevich B. 2016. Validation of the laboratory 568
measurements at seismic frequencies using the Kramers-Kronig relationship. Geophysical 569
Research Letters, 43, 4986-4991. 570
30 Mörig R. and Burkhardt H. 1989. Experimental evidence for the Biot-Gardner theory.
572
Geophysics, 54, 524-527. 573
574
Müller T. M., Toms-Stewart J. and Wenzlau F. 2008. Velocity-saturation relation for partially 575
saturated rocks with fractal pore fluid distribution. Geophysical Research Letters, 35, L09306. 576
577
O’Connell R. J. and Budiansky B. 1977. Viscoelastic Properties of Fluid-Saturated Cracked 578
Solids. Journal of Geophysical Research, 5719-5735. 579
580
O'Connell R. J. and Budiansky B. 1978. Measures of dissipation in viscoelastic media. 581
Geophysical Research Letters, 5, 5-8. 582
583
Pimienta L., Fortin J. and Guéguen Y. 2015a. Experimental study of Young’s modulus 584
dispersion and attenuation in fully saturated sandstones. Geophysics, 80, L57-L72. 585
586
Pimienta L., Fortin J. and Guéguen Y. 2015b. Bulk modulus dispersion and attenuation in 587
sandstones. Geophysics, 80(2), D111-D127, doi: 10.1190/geo2014-0335.1. 588
589
Pimienta L., Borgomano J. V. M., Fortin J. and Guéguen Y. 2016a. Modelling the 590
drained/undrained transition: effect of the measuring method and the boundary conditions. 591
Geophysical Prospecting, 64, 1098-1111. 592
Pimienta, L., Fortin J., Guéguen Y. 2016b Effect of fluids and frequencies on Poisson’s ratio 593
of sandstone samples Geophysics 81 (2), D183-D195 594
595
Pimienta L., Borgomano J. V. M., Fortin J. and Guéguen Y. 2017, Elastic Dispersion and
596
Attenuation in Fully Saturated Sandstones: Role of Mineral Content, Porosity, and
31
Pressures. Journal of Geophysical Research: Solid Earth, 122, 9950–9965. 598
599
Pride S. R., Berryman J. G. and Harris J. M. 2004. Seismic attenuation due to wave-induced 600
flow. Journal of Geophysical Research, 109, B01201. 601
602
Spencer, J. W. and Shine J. 2016. Seismic wave attenuation and modulus dispersion in 603
sandstones. Geophysics, 81, D211-D231. 604
605
Subramaniyan S., Quintal B., Madonna C. and Saenger E. H. 2015. Laboratory-based seismic 606
attenuation in Fontainebleau sandstone: Evidence of squirt flow. Journal of Geophysical 607
Research: Solid Earth, 120, 7526-7535. 608
609
Tisato N. and Quintal B. 2013. Measurements of seismic attenuation and transient fluid 610
pressure in partially saturated Berea sandstone: evidence of fluid flow on the mesoscopic 611
scale, Geophysical Journal International, 195, 342-351. 612
613
Tisato N. and B. Quintal B. 2014. Laboratory measurements of seismic attenuation in 614
sandstone: Strain versus fluid saturation effects, Geophysics, 79, WB9–WB14. 615
616
Walsh J. B. 1965. The Effects of Cracks on the Compressibility of Rock. Journal of 617
Geophysical Research, 70, 381-389. 618
619
Winkler K., Nur A. and Gladwin M. 1979, Friction and seismic attenuation in rocks. Nature, 620
277, 528-531. 621
32 Zoback, M. D. and Byerlee, J. D. 1975. Permeability and effective stress. Bulletin - American 623
Association of Petroleum Geologists, 59, 154-158. 624
625