HAL Id: hal-01975352
https://hal.uca.fr/hal-01975352
Submitted on 9 Jan 2019
HAL is a multi-disciplinary open access
archive for the deposit and dissemination of
sci-entific research documents, whether they are
pub-lished or not. The documents may come from
teaching and research institutions in France or
abroad, or from public or private research centers.
L’archive ouverte pluridisciplinaire HAL, est
destinée au dépôt et à la diffusion de documents
scientifiques de niveau recherche, publiés ou non,
émanant des établissements d’enseignement et de
recherche français ou étrangers, des laboratoires
publics ou privés.
(HOMs) below and above a boreal forest canopy
Qiaozhi Zha, Chao Yan, Heikki Junninen, Matthieu Riva, Nina Sarnela, Juho
Aalto, Lauriane Quéléver, Simon Schallhart, Lubna Dada, Liine Heikkinen, et
al.
To cite this version:
Qiaozhi Zha, Chao Yan, Heikki Junninen, Matthieu Riva, Nina Sarnela, et al.. Vertical
characteriza-tion of highly oxygenated molecules (HOMs) below and above a boreal forest canopy. Atmospheric
Chemistry and Physics, European Geosciences Union, 2018, 18 (23), pp.17437-17450.
�10.5194/acp-18-17437-2018�. �hal-01975352�
https://doi.org/10.5194/acp-18-17437-2018 © Author(s) 2018. This work is distributed under the Creative Commons Attribution 4.0 License.
Vertical characterization of highly oxygenated molecules (HOMs)
below and above a boreal forest canopy
Qiaozhi Zha1, Chao Yan1, Heikki Junninen1, Matthieu Riva1, Nina Sarnela1, Juho Aalto1, Lauriane Quéléver1,
Simon Schallhart1, Lubna Dada1, Liine Heikkinen1, Otso Peräkylä1, Jun Zou2, Clémence Rose1, Yonghong Wang1,
Ivan Mammarella3, Gabriel Katul4,5, Timo Vesala1, Douglas R. Worsnop1,6, Markku Kulmala1, Tuukka Petäjä1,
Federico Bianchi1, and Mikael Ehn1
1Institute for Atmospheric and Earth System Research/Physics, Faculty of Science, University of Helsinki,
P.O. Box 64, 00014 Helsinki, Finland
2CMA-NJU Joint Laboratory for Climate Prediction Studies, Institute for Climate and Global Change Research,
School of Atmospheric Sciences, Nanjing University, Nanjing, China
3Institute for Atmospheric and Earth System Research/Physics, Faculty of Science, University of Helsinki,
P.O. Box 68, 00014 Helsinki, Finland
4Nicholas School of the Environment, Duke University, Durham, North Carolina, USA
5Department of Civil and Environmental Engineering, Duke University, Durham, North Carolina, USA
6Aerodyne Research, Inc., Billerica, MA 01821, USA
Correspondence: Qiaozhi Zha ([email protected]) and Chao Yan ([email protected]) Received: 24 November 2017 – Discussion started: 8 December 2017
Revised: 28 August 2018 – Accepted: 30 October 2018 – Published: 10 December 2018
Abstract. While the role of highly oxygenated molecules (HOMs) in new particle formation (NPF) and secondary or-ganic aerosol (SOA) formation is not in dispute, the interplay between HOM chemistry and atmospheric conditions contin-ues to draw significant research attention. During the Influ-ence of Biosphere-Atmosphere Interactions on the Reactive Nitrogen budget (IBAIRN) campaign in September 2016, profile measurements of neutral HOMs below and above the forest canopy were performed for the first time at the boreal forest SMEAR II station. The HOM concentrations and com-position distributions below and above the canopy were sim-ilar during daytime, supporting a well-mixed boundary layer approximation. However, much lower nighttime HOM con-centrations were frequently observed at ground level, which was likely due to the formation of a shallow decoupled layer below the canopy. Near the ground HOMs were influenced by the changes in the precursors and oxidants and enhance-ment of the loss on surfaces in this layer, while the HOMs above the canopy top were not significantly affected. Our findings clearly illustrate that near-ground HOM measure-ments conducted under stably stratified conditions at this site might only be representative of a small fraction of the
en-tire nocturnal boundary layer. This could, in turn, influence the growth of newly formed particles and SOA formation be-low the canopy where the large majority of measurements are typically conducted.
1 Introduction
Highly oxygenated molecules (HOMs), a subgroup of the ox-idation products of volatile organic compounds (VOCs) iden-tified by their high oxidation states, have been recognized as important precursors for organic aerosol in the atmosphere (Ehn et al., 2014). They have also been found to enhance new particle formation (NPF) and growth (Kulmala et al., 2013; Zhao et al., 2013; Ehn et al., 2014; Bianchi et al., 2016; Kirkby et al., 2016; Tröstl et al., 2016). The importance of HOMs has been confirmed in ambient environments, espe-cially in monoterpene-dominated regions such as the boreal forest (Kulmala et al., 2013; Ehn et al., 2014), but also in high-altitude mountain regions (Bianchi et al., 2016) and in rural areas (Jokinen et al., 2014; Kürten et al., 2016). In labo-ratory studies, HOM formation has been observed from
var-ious precursor molecules (Ehn et al., 2017), including both biogenic and anthropogenic emissions (Molteni et al., 2018). The direct observation of HOMs has only recently become possible, following the developments of the atmospheric-pressure-interface time-of-flight (APi-TOF, measures the naturally charged HOMs) (Junninen et al., 2010) and chemical-ionization atmospheric-pressure-interface time-of-flight (CI-APi-TOF, measures the neutral HOMs) (Jokinen et al., 2012) mass spectrometers. Ehn et al. (2010) and Bianchi et al. (2017) found that the naturally charged HOM clusters could be observed every night in the boreal forest during spring. Out of the observed ambient mass spectra, a signif-icant part could be reproduced in a chamber by introducing
the monoterpene α-pinene (C10H16, the major biogenic VOC
in the boreal forest) and ozone (O3) (Ehn et al., 2012).
Further investigations of HOM formation chemistry have been carried out in both laboratory and field studies. Based on current understanding from laboratory experiments, the formation of HOMs involves three main steps: (1) initial
formation of peroxy radicals (RO2) from VOC oxidation;
(2) RO2 autoxidation, that is, the isomerization of the RO2
via intramolecular H shifts and subsequent oxygen (O2)
ad-ditions; and (3) radical termination, forming closed-shell molecules (Crounse et al., 2013; Ehn et al., 2014; Joki-nen et al., 2014, 2016; RissaJoki-nen et al., 2014; Mentel et al., 2015). In the atmosphere, HOM formation studies are com-plicated by the plethora of different compounds and pro-cesses taking place. However, recent ambient measurements together with factor analysis were able to shed light on the HOM formation pathways in the boreal forest (Yan et al., 2016). They showed that the majority of the daytime pro-duction of HOMs was from reactions initiated by the oxi-dation of monoterpenes (MTs) with hydroxyl radicals (OH)
or O3. The RO2 after autoxidation were often terminated
by hydroperoxyl radicals (HO2) or self-termination (Orlando
and Tyndall, 2012) to form a non-nitrate HOM monomer
(CHOmonomer, mainly C9and C10 compounds, with masses
between 290 and 450 Th after clustering with the
charg-ing ion (NO−3) of the instrument), or reacting with
nitro-gen oxides (NOx=NO + NO2) to form organonitrate HOM
monomers (CHONmonomer). During nighttime, MTs were
mainly oxidized by O3and NO3radicals. Furthermore, due
to the lower nocturnal HO2and NOxconcentrations, in
addi-tion to the producaddi-tion of CHONmonomer, the RO2 products
readily reacted with other RO2 to form either non-nitrate
HOM dimers (CHOdimer, mainly C16–20 compounds with
masses between 450 and 600 Th after clustering with NO−3)
or organonitrate HOM dimers (CHONdimer), depending on
the oxidants forming the RO2(Ehn et al., 2014; Jokinen et
al., 2014; Yan et al., 2016; Berndt et al., 2018).
Beyond those chemical pathways, varied meteorological conditions are also factors influencing the MT and oxidants at different heights above the forest floor. Unsurprisingly, the
oxidants producing HOMs (e.g., O3) have been found
al-most uniformly distributed within the well-mixed daytime
boundary layer (Chen et al., 2018). In contrast, the nocturnal boundary layer was shallow with stability regimes that de-pended on radiative cooling within the canopy and turbulent shear stresses at the canopy top. In Hyytiälä, the depletion
of O3below the canopy has been frequently observed during
nighttime, while the O3above the canopy was less affected
(Chen et al., 2018). The MT concentration at ground level
in-creased when O3was depleted (Eerdekens et al., 2009). The
inhomogeneous distribution of the precursors and oxidants below and above the canopy might further impact nocturnal HOM distributions, which frames the scope of this study. Un-til now, all CI-APi-TOF deployments have been at ground level, and the main subject of inquiry here is the vertical in-formation on HOMs and the role of meteorological condition in shaping them. A characterization of the HOMs at different heights provides a decisive advantage in disentangling the role of nonuniform mixing within the atmospheric layers im-pacted by strong thermal stratification, especially inside the canopy volume.
The first measurements of the HOM concentrations at two different heights (36 m and 1.5 m a.g.l.) are presented and discussed. The influence of boundary layer dynamics on the HOMs at these different heights at SMEAR II station is ana-lyzed and characterized in conjunction with auxiliary turbu-lence and micrometeorological measurements.
2 Experimental
2.1 Measurement site description
The measurements were performed at the SMEAR II station (Station for Measuring Ecosystem–Atmosphere Relations)
in the boreal forest in Hyytiälä, southern Finland (61◦510N,
24◦170E, 181 m a.s.l.; Hari and Kulmala, 2005; Hari et al.,
2013) during September 2016. There is no large anthro-pogenic emission source at or near the site. The closest sources are the two sawmills ∼ 5 km southeast of the site and the city area of Tampere (∼ 60 km away). The forest surrounding the station is primarily Scots pine with a mean canopy height of ∼ 17.5 m, a total leaf area index (LAI) of ∼
6.5 m2m−2, a stand density of ∼ 1400 trees ha−1, and an
av-erage diameter at breast height (DBH) of ∼ 0.16 m (Bäck et al., 2012; Launiainen et al., 2013). The forest floor is majorly
covered with a shallow dwarf shrub (a LAI of ∼ 0.5 m2m−2)
and moss layer (a LAI of ∼ 1 m2m−2) (Kulmala et al., 2008;
Launiainen et al., 2013). The planetary boundary layer height at the SMEAR II station has been determined from previous studies using radiosondes (Lauros et al., 2007; Ouwersloot et al., 2012) and balloon soundings (Eerdekens et al., 2009). Roughly, these heights span some 400 m (March) to 1700 m (August) at noontime and 100 m (March) to < 160 m (April) at midnight.
2.2 Instrumentation
Concentration of HOMs was measured with two nitrate-ion-based CI-APi-TOF mass spectrometers. The CI-APi-TOF measuring at higher altitude was deployed at the top of a 35 m tower located ∼ 20 m horizontally from the ground measure-ment location. Both instrumeasure-ments were working in rooms with
air-conditioning and room temperatures controlled at 25◦C.
The inlets of the two instruments were pointed to the south-east direction and fixed at ∼ 36 and ∼ 1.5 m above ground. The tower measurement is at about twice the canopy height, which is still within the roughness sublayer of the forest (Raupach and Thom, 1981). The instrument setup of the two CI-APi-TOF mass spectrometers was similar. In brief, the CI-APi-TOF was the combination of a chemical ioniza-tion (CI) inlet and an APi-TOF mass spectrometer (Aero-dyne Research Inc., USA, and Tofwerk AG, Switzerland). The ambient air was first drawn into the inlet with a
sam-ple flow of 7 L min−1 (liter per minute) and then centered
to an ion reaction tube surrounded by sheath flow (filtered
air, 35 L min−1). Meanwhile, the nitrate ions carried by the
sheath gas, which were generated by exposing the nitric acid
(HNO3) to soft X-ray radiation, were guided into the sample
gas by an electrical field at ambient pressure (∼ 100 ms re-action time). Neutral molecules (M) in the sample air were ionized by either clustering with charged nitrate / nitric acid
((HNO3)n=0−2·NO−3) to form (M) · NO−3 cluster ions or
los-ing a proton to the charglos-ing ions to form deprotonated ions
(e.g., H2SO4+NO−3 →HSO−4 +HNO3). The ions then
en-tered the APi part, which was a three-stage vacuum cham-ber, through a pinhole. In the APi, two quadrupoles and a stack of ion lenses guided the ions into the TOF mass ana-lyzer, in which ions were separated based on their mass-to-charge (m/z) ratios. A more detailed description of this in-strument has been given by Junninen et al. (2010) and Joki-nen et al. (2012), and discussion on selectivity of this nitrate ion charging was provided by Hyttinen et al. (2015). Mass spectra obtained from the instrument were analyzed using the “tofTools” program described in Junninen et al. (2010). De-termination of the concentration of a measured molecule M was based on the following equation:
[M] = P M
P reagent ion count rates×C, (1)
where the sum of ion count rates (P M) in the numerator includes all detected ions relating to compound M, whether deprotonated or in clusters with reagent ions, and the sum of reagent ion count rates in the denominator is the total sig-nal of the nitrate ions. C is the calibration coefficient, which was assigned the same value for all detected compounds. This assignment is only valid for compounds that cluster with
the reagent ions at the collision limit, such as H2SO4
(Vig-giano et al., 1997), and have equal collision rates. The
col-lision rates of nitrate ions with H2SO4and with HOMs are
expected to be very close (Ehn et al., 2014). Here, a
cali-bration coefficient of 1 × 10¹⁰molec cm−3, estimated from
previous calibrations with similar settings using sulfuric acid and theoretical constraints (Ehn et al., 2014), with an uncer-tainty of at least −50 %/ + 100 %, was used in calculating the HOM concentrations for both instruments. Ultimately, the absolute HOM concentrations in this work are of sec-ondary importance, as we focus on the relative comparison of HOM concentrations measured at different heights. How-ever, the comparability of the two CI-APi-TOF instruments is of great importance, and results cannot be allowed to vary as a result of inevitable differences in the mass-dependent transmission efficiency (TE), for example. For a detailed dis-cussion on factors affecting the TE of a CI-APi-TOF, we re-fer to Heinritzi et al. (2016). To this end, instead of directly evaluating the TE of each instrument, a “relative” TE of the two CI-APi-TOFs was used for data correction: we selected a time period at noontime on 9 September with a well-mixed boundary layer, identified by the clear and sunny weather and homogeneous vertical distribution of monoterpene and other trace gases, and we assumed the HOM concentrations at the two heights to be the same. Thus, the relative TE was obtained from the concentration ratio between the two CI-APi-TOFs at each m/z (Fig. 1). A fitted relative TE curve
(R2=0.97), which represents how the TE of the tower
CI-APi-TOF was changed at each m/z over the TE of the ground one, was obtained using power-law regression. Weaker cor-relation was obtained in the 200–250 and 500–600 Th mass ranges, but in the mass range in which most of the HOMs were located (290–500 Th) there is very little scatter around the fitted curve, clearly suggesting that observed differences in the two instruments’ responses were mainly due to differ-ences in TE. To test our assumption of negligible vertical gra-dients of HOMs during daytime, we analyzed the behavior of sulfuric acid. We found that the uncertainty related to this as-sumption corresponds to a value of 26 % (see Fig. S1 in the Supplement). An upper limit of uncertainty relating to our TE correction (Fig. 1) was also estimated, yielding a value of 10 %, giving a total uncertainty from these two sources of 28 %. This value is much smaller than the observed devia-tion of HOM concentradevia-tions during inversion nights, as will be discussed later. Additionally, an intercomparison between the two instruments with a permeation tube containing
trini-trotriazinane (C3H6N6O6) was conducted in the field right
after the campaign. The results showed good agreement with the relative TE, lending confidence to the method used here. Finally, it should be noted that the difference in TE between the two instruments was larger than one would normally ex-pect since the tower CI-APi-TOF had been tuned for higher sensitivity at the largest masses (at the expense of transmis-sion at the lower masses).
In comparison to the direct determination of TE (Hein-ritzi et al., 2016), this method increases the uncertainty in the quantification of HOM concentrations. However, as men-tioned, a more accurate knowledge of the exact HOM
con-Figure 1. The relative transmission curve between the two CI-APi-TOF mass spectrometers, determined during a period of strong tur-bulent mixing. Intercomparison results using a permeation tube con-taining trinitrotriazinane (C3H6N6O6) are shown in red circles. The
fitted green line was used to scale the measured signals between the two instruments to match, in order to compare relative changes dur-ing times of limited vertical mixdur-ing.
centrations would not influence the main findings of this study.
The MT, trace gases, and meteorological parameters were continuously monitored at the different heights (4.2, 8.4, 16.8, 33.6, 50.4, 67.2, 101, and 125 m) on a 126 m mast
∼100 m away from the location of the CI-APi-TOFs. The
data at 4.2 and 33.6 m were used in this study to represent the concentrations at near ground and tower levels, respectively. MT concentrations were measured every third hour using a proton transfer reaction mass spectrometer with a lower de-tection limit of 1 pptv (PTR-MS, Ionicon Analytik GmbH;
Taipale et al., 2008). The O3 concentration was measured
with a UV light absorption analyzer that had a lower detec-tion limit of 1 ppbv (TEI model 49C, Thermo Fisher
Scien-tific, USA). The NOx measurement was conducted using a
chemiluminescence analyzer (TEI model 42C TL, Thermo
Fisher Scientific, USA). The lower detection limit of the NOx
analyzer is 100 pptv. The CO2measurement was performed
using an infrared detection system (LI-840, LI-COR Bio-sciences, Lincoln, NE, USA). The aerosol number concen-tration size distributions were obtained with a twin differen-tial mobility particle sizer (twin DMPS) for the size range from 3 to 1000 nm (Aalto et al., 2001) at 8 m in height above ground, and was used to calculate condensation sink (CS) based on the method from Kulmala et al. (2001). Air tem-perature was measured with PT-100 resistance thermome-ters. Air relative humidity (RH) was measured with RH sen-sors (Rotronic HygroMet model MP102H with HygroClip HC2S3, Rotronic AG, Switzerland). Global radiation (solar radiation in the wavelength range of 0.3–4.8 µm) was ob-tained with a Pyranometer (Reemann TP3, Astrodata, Esto-nia) above the canopy top at 18 m. All the data presented
are at 10 min averaging intervals, except for the MT (at a 1 h averaging interval). A schematic figure showing sampling lo-cations of all the measured parameters is provided in Fig. S2.
3 Results and discussion
3.1 Data overview
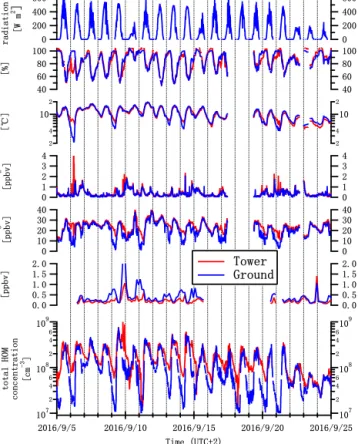
The Influence of Biosphere-Atmosphere Interactions on the Reactive Nitrogen budget (IBAIRN) campaign was con-ducted from 1 to 25 September 2016. After data quality checks, only the measurements collected after 5 September were used. Figure 2 shows the overall time series of the mete-orological parameters measured at ground and tower levels, including the temperature, RH, global radiation, concentra-tions of trace gases, MT, and total HOMs (Zha, 2018). The weather was generally sunny and clear during the campaign except for a few cloudy (10, 15, and 22–23 September) and drizzling (24 and 25 September) days. The mean air
tempera-ture and RH observed at ground level were 10.8 ± 3.3◦C and
87±13 % (1σ standard deviation) and at the tower level were
10.5 ± 3.0◦C and 88 ± 14 %, respectively. The O3
concentra-tions measured at ground and tower levels were 21 ± 8 and
25 ± 6 ppbv, respectively. The air temperature, RH, and O3
measured at the two heights were close to each other during
daytime. The NOx concentrations were quite low
through-out the campaign; the mean NOxconcentrations were mostly
around the reported detection limit at 0.4±0.4 ppbv (ground) and 0.4±0.5 ppbv (tower), yet showed an overall good agree-ment between the measureagree-ments at the different heights. The MT concentrations at ground level (0.38±0.34 ppbv on aver-age) were generally higher than those above the canopy level (0.20 ± 0.16 ppbv).
The estimated total HOM concentration is representative for the overall concentration level of HOMs and is here de-fined as the sum of the detected signals among ions from
m/z200 to 600 after removing identified background peaks.
The gaps in the estimated total HOM at ground level were due to automatic zero checks. During the campaign, a sig-nificant difference was found in the estimated total HOM concentrations below and above the canopy (mean and
me-dian concentrations of 1.1 ± 1.7 × 10⁸and 0.8 × 108cm−3at
ground level and 1.7 ± 1.3 × 10⁸and 1.3 × 108cm−3at tower
level). The causes of these differences (∼ 55 % in mean and
∼71 % in median) frame the upcoming discussion.
3.2 Intercomparison of estimated total HOM
concentrations
The estimated total HOM concentrations at the two heights were not different during the day (mean ±1σ standard
de-viation and median concentrations of 4.1 ± 2.3 × 10⁸ and
3.6 × 108cm−3 at ground level, 4.3 ± 2.6 × 10⁸ and 4.0 ×
108cm−3at tower level), which validates the use of only 1
Figure 2. The overall time series of the measured trace gases, mete-orological parameters, and estimated total HOM concentrations at the ground (blue) and tower (red) levels.
match the HOM signals of the two instruments. The good daytime agreement throughout the campaign period also ver-ifies that the response of each instrument stayed stable. Con-trary to the daytime results, the estimated total HOM con-centration at ground level usually diverged from the tower measurement in the nocturnal boundary layer. The concen-tration below the canopy became even lower when temper-ature inversions were observed, accompanied by a
decreas-ing ground-level O3and increasing MT concentrations.
Fig-ure 3 shows a comparison between the estimated total HOM concentrations observed at two heights. Herein, good agree-ment could be found for the group of points representing the
concentrations around noontime (R2=0.89). The points
in-dicating the nighttime estimated total HOM concentrations
were scattered (R2=0.28), and the ground concentrations
were found to be much lower than the tower ones.
Figure 4 shows the mean mass spectra (in unit mass resolu-tion, UMR, for m/z 200–600) obtained from the ground and tower. It is worth mentioning that there might be some sig-nals not attributable to HOMs in the plotted spectra, but only as a small proportion. Only selected periods (09:00–15:00 for daytime and 21:00–03:00 for nighttime; all the times are given in Finnish winter time, UTC + 2) are included in the averaging period to eliminate the effect of sunrise and
sun-Figure 3. Comparison between ground (x axis) and tower (y axis) measurements of the estimated total HOM concentrations. The black line denotes the 1 : 1 ratio. Color code indicates the sampling time of HOMs.
Figure 4. Mean mass spectra with the averaging periods of daytime (09:00–15:00) and nighttime (21:00–03:00) at the ground and tower levels.
set periods. During daytime, a good agreement (R2=0.87)
was obtained from the mass-by-mass comparison using the UMR concentrations extracted from daytime mean spectra, suggesting a uniform composition distribution in the day-time boundary layer condition. During nightday-time, the mean concentrations of all HOMs in the ground mean spectra were much lower than the tower spectra. The HOM concentrations shown in the ground and tower mean spectra were also less correlated. Therefore, a logical outcome is that the condi-tions below and above the canopy experience different
turbu-lent mixing strength and/or source–sink regimes during the night.
3.3 Influence of nocturnal boundary layer dynamics
and micrometeorological processes
The nighttime HOMs at ground level are likely influenced by transport processes below the canopy since the estimated total HOM concentrations were found much lower on the nights when temperature inversions were observed. To fur-ther investigate the potential impact of such micrometeoro-logical phenomena on ground-level HOMs, the nights dur-ing the campaign without precipitation or instrument fail-ure were selected (14 nights in total) and categorized into two types based on the occurrence of temperature inversions: (1) the “non-inversion night” type included seven nights when no temperature inversion was recorded; (2) the “inver-sion night” type category consisted of seven nights that had encountered temperature inversions, and the ground
temper-atures were generally ∼ 1◦C lower than tower temperatures
during these nights.
3.3.1 Statistics of the non-inversion night and inversion
night types
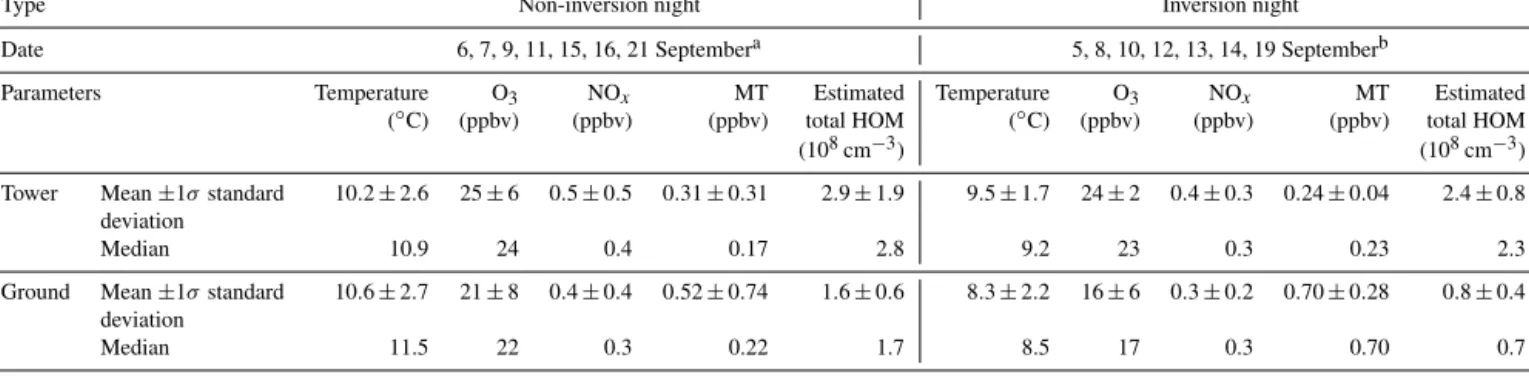
Table 1 shows the overall statistics including the mean and
median values of the temperatures, O3, NOx, MT, and
esti-mated total HOM concentrations for the non-inversion night and inversion night types. On the non-inversion nights, the air below and above the canopy was relatively well mixed. The
mean and median concentrations of the ground O3 (21 ± 8
and 22 ppbv) were close to the tower values (25 ± 6 and 24 ppbv). The slight difference might be attributed to the higher VOC emissions (Rantala et al., 2014) and larger sink near ground level. In contrast, during the inversion nights,
the mean estimated total HOM concentration and O3 at
ground level were generally much lower, only ∼ 33 % and
∼69 % of the tower concentrations, respectively. Instead,
the mean and median ground MT concentration (0.70 ± 0.28 and 0.70 ppbv) were ∼ 3 times higher than the tower ones
(0.24 ± 0.04 and 0.23 ppbv). The measured NOxlevels were
similar in both categories and at both heights, though the ambient concentrations were close to the detection limit and therefore small differences might not be observable.
3.3.2 Case study
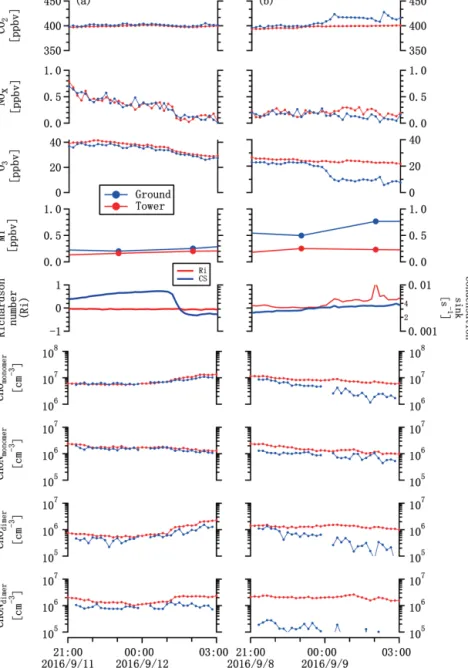
Two individual nights representing the non-inversion night and inversion night types were selected and further com-pared. Figure 5a shows the time series of the meteorological parameters, trace gases, and HOMs measured at ground and tower levels of one selected night for the non-inversion night type (11–12 September, from 21:00 to 03:00). A number of measures can be used to assess the local atmospheric stabil-ity conditions at a given layer. These measures are commonly based on either the Obukhov length and its associated
at-mospheric stability parameter or a Richardson number (flux based, gradient based, or bulk). Because of its simplicity and the availability of high-resolution mean air temperature pro-files, the bulk Richardson number (Ri) was used here (Mahrt et al., 2001; Mammarella et al., 2007; Vickers et al., 2012; Alekseychik et al., 2013). It is calculated using
Ri =g1θ 1z
θ (u)2 , (2)
where g is the gravitational acceleration, 1θ and 1z are the mean potential temperature (10 min averaging interval, same as measurement data) and height difference between the ground and tower levels, respectively, and θ and u are the mean potential temperature and mean wind velocity at tower level, respectively. During the selected non-inversion night,
Riwas generally positive but close to 0 (shown in Fig. 5a),
indicating a weakly stable and relatively well-mixed (i.e.,
1θ →0) condition (Mahrt, 1998; Mammarella et al., 2007).
This was also confirmed using the well-correlated ground and tower MT and trace gas concentrations.
Selected HOMs representing the major HOM types (and formation pathways) were summed up and categorized into four groups, as shown in Table 2. Each pathway might be influenced differently by boundary layer dynamics and micrometeorological processes. In this study, OH-initiated HOMs were assumed negligible due to the very low OH level in the nocturnal boundary layer.
All the HOM groups in Fig. 5a show stable patterns, and good agreement is observed between the ground and tower measurements in the first half of the night. Variations were observed when air mass change occurred at around 01:00,
as indicated by the drop of NOx concentration and
horizon-tal wind shift (not shown here). A rapid decrease was found in CS, which represents the rate of condensation of low-volatility vapors onto the existing aerosol particles (Dada et al., 2017), implying that the aerosol population also changed. However, the HOM groups were still well correlated with each other, suggesting well-mixed conditions in the non-inversion night.
Figure 5b shows the time series of the trace gases, MT, and HOM groups of both ground and tower measurements during an inversion night case (8–9 September, from 21:00 to 03:00). Ri was generally higher during this night, and in-creased from ∼ 0.03 (indicating a weakly stable condition; Mammarella et al., 2007), at around midnight, to a maxi-mum of ∼ 1.13 (indicating a very stable condition) for the rest of the night. Roughly, Ri values in excess of unity indi-cate that stably stratified conditions appreciably diminish the inverse turbulent Prandtl number (Pr) and the efficiency of turbulence to mix heat when compared to momentum (Katul et al., 2014). The parameters measured at tower level were not significantly affected by strong Ri fluctuations through-out the night; in contrast, significant variations were observed at ground level.
Table 1. Summary of the “Non-inversion night” and “Inversion night” types.
Type Non-inversion night Inversion night
Date 6, 7, 9, 11, 15, 16, 21 Septembera 5, 8, 10, 12, 13, 14, 19 Septemberb
Parameters Temperature O3 NOx MT Estimated Temperature O3 NOx MT Estimated
(◦C) (ppbv) (ppbv) (ppbv) total HOM (◦C) (ppbv) (ppbv) (ppbv) total HOM
(108cm−3) (108cm−3)
Tower Mean ±1σ standard 10.2 ± 2.6 25 ± 6 0.5 ± 0.5 0.31 ± 0.31 2.9 ± 1.9 9.5 ± 1.7 24 ± 2 0.4 ± 0.3 0.24 ± 0.04 2.4 ± 0.8
deviation
Median 10.9 24 0.4 0.17 2.8 9.2 23 0.3 0.23 2.3
Ground Mean ±1σ standard 10.6 ± 2.7 21 ± 8 0.4 ± 0.4 0.52 ± 0.74 1.6 ± 0.6 8.3 ± 2.2 16 ± 6 0.3 ± 0.2 0.70 ± 0.28 0.8 ± 0.4
deviation
Median 11.5 22 0.3 0.22 1.7 8.5 17 0.3 0.70 0.7
aMT data not available on 5 and 19 September.bMT data not available on 15 and 16 September.
Table 2. Compositions of selected HOMs and their main oxidants (Yan et al., 2016).
Molecule compositions Main oxidants Main terminators
CHOmonomer C10H14O7, C10H14O9 O3 Self-termination or RO2
CHONmonomer C10H15O9N, C10H15O11N O3or NO3 NO or self-termination–RO2
CHOdimer C19H28O11, C20H30O14 O3 RO2
CHONdimer C20H32O12N2, C20H31O13N NO3 RO2
The ground O3concentration experienced a rapid decrease
at midnight. In about an hour (from 23:30 to 00:30), ground
O3 concentration dropped by more than half (from 20 to
9 ppbv), and CO2concentration increased as well (from 404
to 423 ppbv). Conversely, the MT concentration at ground level almost doubled (from 0.49 to 0.80 ppbv) during the same period. Theoretically, the enhancement of HOM pre-cursor VOC and the decrease in oxidant would compen-sate for each other if the sink remained the same, and the ground HOM concentrations should also remain constant. However, all the HOM groups showed a significant decrease after midnight, despite the CS (generally the main sink for HOM in the atmosphere) staying practically constant. In
par-ticular, the concentration of the CHOmonomergroup dropped
∼80 %, from 8.6 × 10⁶to 1.7 × 106cm−3, and the
concen-tration of the CHOdimergroup decreased from 1.5 × 10⁶to ∼
0.1×106cm−3. The concentrations of the CHONmonomerand
CHONdimer groups also experienced large declines (∼ 34 %
and ∼ 50 %, respectively) in the latter half of the night. At
03:00, the CHONdimer concentration was already below the
detection limit (1 × 104cm−3). Therefore, the much lower
ground HOM concentrations might not be totally explained by the change of HOM production but rather due to some other processes such as additional losses.
A previous study by Alekseychik et al. (2013) at the SMEAR II station showed that nocturnal decoupled air lay-ers were frequently (with a fraction of 18.6 % based on a long-term dataset) observed under high-Ri conditions in the boreal forest. The decoupled layer could strongly influence
the ground O3, MT, and CO2concentrations (Rannik et al.,
2009, 2012; Alekseychik et al., 2013; Chen et al., 2018) and could also explain the occurrence of the strong temperature inversion during the inversion nights. To explore the possible
mechanism resulting in significantly different O3, MT, and
HOM concentrations below the canopy, the mean continuity equation for high-Reynolds-number flows within the canopy is formulated as (e.g., Katul et al., 2006)
∂C ∂t +U ∂C ∂x +W ∂C ∂z = −S − ∂w0c0 ∂z − ∂u0c0 ∂x , (3) N1+N2+N3=N4+N5+N6, (4)
where t is time, x and z are the longitudinal and vertical di-rections, respectively, C is the scalar concentration, U and W
are the longitudinal and vertical velocity components, w0c0
and u0c0 are the turbulent scalar fluxes in the vertical and
horizontal, respectively, S represents the net sources or sinks (physical, chemical, and biological) of C, and the overline represents time averaging over turbulent scales. The six terms in this equation represent the following (left to right): local
rate of change (N1), horizontal advection by the mean
ve-locity (N2), vertical advection by the mean velocity (N3),
net sources or sinks (N4), net vertical transport by the
ver-tical turbulent flux gradient (N5), and net horizontal
trans-port by the horizontal turbulent flux gradient (N6). Generally,
|N6| |N5| and is hereafter ignored in the discussion.
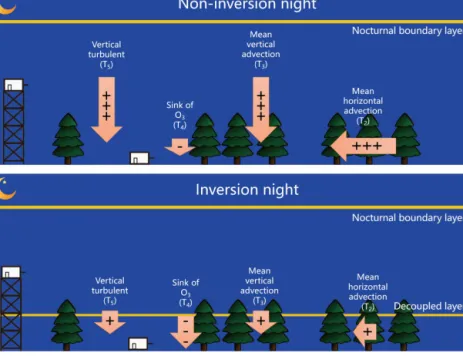
During the non-inversion night, the ground O3could be
re-plenished by vertical turbulent transport (N5), mean vertical
advection from the upper boundary layer (N3), or
horizon-tal advection below the canopy (N2) (as shown in Fig. 6).
Figure 5. (a) Time series of ground and tower concentrations of CO2, NOx, O3, MT, and selected HOM groups in the selected non-inversion
night (11 September) and (b) inversion night (8 September) types. Ri is calculated with the meteorology data of the ground and tower levels. CS is determined based on the aerosol data measured at 8 m above ground level.
the efficiency of turbulence to transport O3to layers near the
ground becomes weak (Katul et al., 2014). Vertical and hor-izontal advection were also small within such a stable layer, and the reduced mean velocity would result in smaller
con-tributions from N2and N3. Note that these advective terms
tend to be opposite in sign by the virtue of the mean fluid continuity equation (Katul et al., 2006). Instead, the sink of
O3 (N4) was stronger because of the increasing loss due to
a higher surface area-to-volume density (S/V ) in this
shal-low decoupled layer. Under this circumstance, the ground O3
concentration dramatically decreased when the air layer was
forming and eventually reached a much lower concentration.
The decoupled layer also affected MT and CO2 below the
canopy in the inversion night but resulted in concentration
increases as opposed to O3. The weakened vertical
turbu-lence (N5) tended to retain the emissions from ground and
understory vegetation within the layer, though N4 also
in-creased. In general, the increased CO2(primary source from
the ground) and MT (primary source from the canopy) at ground level are good indicators for the extent of the mix-ing in the shallow decoupled layer. At the same time, the
Figure 6. Schematic figure showing how vertical mixing, vertical advection, and horizontal advection influence ground-level O3
concentra-tions differently on non-inversion nights and inversion nights at the SMEAR II station.
no longer balanced by a large flux of O3from upper layers.
However, the stabilization of ground-level O3concentrations
at nonzero values after the initial fast decrease suggests that
a small amount of inflow, either via N3or N5, is still taking
place.
Therefore, the differences between the ground and tower measurements were due to the joint effects of (i) decou-pling between the stably stratified near-ground layer and the canopy top and the consequent formation of a shallow layer, (ii) weakening of advective and turbulent flux transport terms thereby inhibiting mass exchange between the ground decou-pled layer and the remaining nocturnal boundary layer, and (iii) an increased surface area-to-volume ratio within the
de-coupled layer thereby enhancing N4.
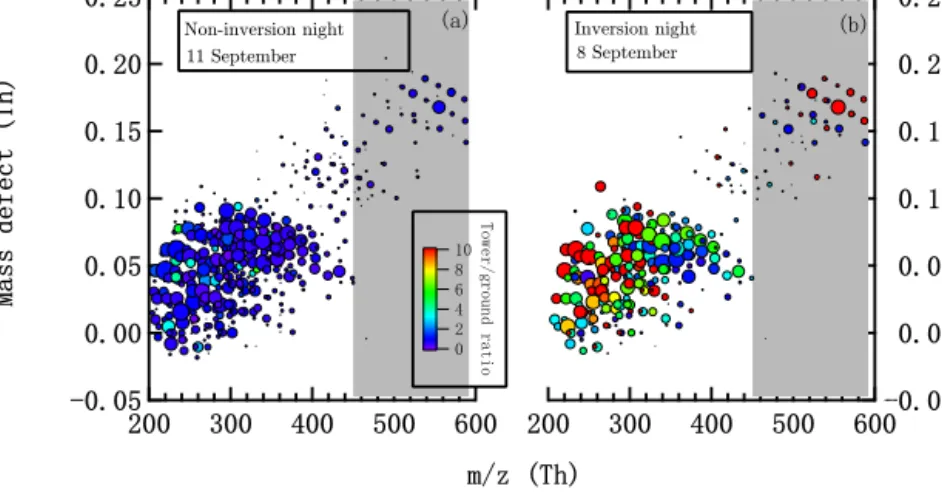
Examination of the selected HOMs was useful and effi-cient to assess the changes in HOMs; however, such an analy-sis might only indicate the major formation pathways. Hence, it was also worthwhile to have a holistic view of the entire mass spectra and all the detected HOMs. The mass defect (MD) plot (Fig. 7) separates all identified compounds accord-ing to their exact masses on the x axis and the deviation from the integer mass on the y axis. Each circle represents a com-pound, with the areas scaled by concentrations and colored by the ratios between tower and ground concentrations. Fig-ure 7a and b are MD plots showing the mean spectra of the selected non-inversion night (11 September) and inversion night (8 September), respectively. Without the formation of a decoupled layer, nearly the same concentration distributions of HOMs were observed. In contrast, during the inversion night (8 September, Fig. 7b), large differences could be found
between the two measurement heights. Moreover, a signifi-cant fraction of the ground HOMs disappeared on the inver-sion night, and the concentrations of the remaining HOMs were also lower, confirming the aforementioned results ob-tained with the selected HOM groups.
3.4 Study limitations
Several limitations still exist in this study. From the mea-surement side, one major concern was the comparability be-tween our two CI-APi-TOF mass spectrometers. In the worst case, our conclusion might be biased if instrument responses changed due to some parameter that correlated with the ob-served inversions. The main parameters in this case would be ambient temperature and RH. As both instruments were located in temperature-controlled containers and the sample flow was mixed 1 : 2 with dry sheath air in the CI-APi-TOF drift tube, neither of these were expected to yield such large changes. However, for confirmation, we compared the de-tailed spectral evolution during days and nights of the study. Figure 8 shows an example of hourly changes of the ratios between tower and ground HOMs, over a 24 h period without nighttime temperature inversion (11 September). During this
period, ambient temperatures changed from 19.1◦C (12:00)
to 8.8◦C (07:00) at ground level, and from 17.9 to 8.1◦C at
tower level. Ambient RHs also increased from 72 % to 96 % at ground level, and from 74 % to 98 % at tower level. While some scatter is visible in the 200–300 Th range during some parts of the night, good agreement was observed between the
Figure 7. Mass defect (MD) plots of the selected (a) non-inversion night case (11 September) and (b) inversion night case (8 September). Color code indicates the ratios between tower and ground HOM concentrations. The grey shaded area denotes the dimer range (m/z 450– 600 Th).
Figure 8. Hourly changes of the ratios between estimated tower and ground HOM concentrations from 12:00 on 11 September to 11:00 on 12 September (non-inversion night). Markers are sized by ground HOM concentrations and colored by the O3difference between the tower
and ground (O3tower−O3ground). Hourly ambient temperatures at ground (Tg) and tower (Tt) levels and RH at ground (RHg) and tower (RHt)
levels are shown in each subplot.
two instruments throughout the night, despite large variabil-ity in temperatures and RHs.
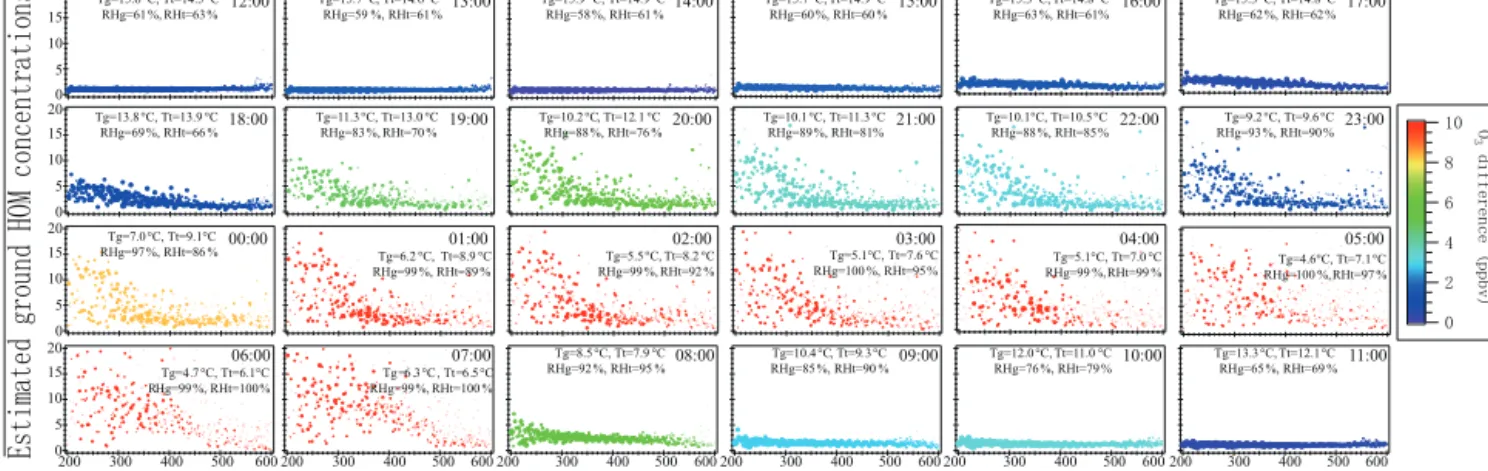
In contrast, during a 24h period with nighttime temper-ature inversion (8 September, shown in Fig. 9), the ratios agreed well only during daytime (from 12:00 to 17:00, and 09:00 to 11:00 on the next day). Between these two peri-ods, temperature and RH were most of the time in the same range as on 11 September (when no strong deviations were observed), but now the HOM behavior changed dramatically between the two heights. The ratios increased from ∼ 1 (dur-ing daytime) up to ∼ 20 at 07:00 for some of the measured molecules.
Figures 8 and 9 clearly imply that the large differences be-tween ground and tower HOM concentrations were driven by temperature inversions and consequent changes in the com-position of the air in the two detached layers. Large changes
in HOMs were observed only when the ground temperature was lower than the tower temperature and when the ozone concentration at ground level was several parts per billion lower than at the tower (shown as a color scale in Figs. 8 and 9). Absolute temperatures or RHs at the two heights were not able to explain the changes. As a concrete example, good agreement was observed at 07:00 on 12 September, while ambient temperatures were low (ground and tower
temper-atures were 9.3 and 8.6◦C, respectively) and RHs were
high (ground and tower RHs were 92 % and 96 %, respec-tively), but large deviations were found at 20:00, 8 Septem-ber, when higher temperatures (ground and tower
tempera-tures were 10.2 and 12.1◦C, respectively) and lower RHs
(ground and tower RHs were 88 % and 76 %, respectively) were observed. In other words, neither low temperatures nor high RHs caused large changes to our instruments. Instead,
20 15 10 5 0 20 15 10 5 0 20 15 10 5 0 20 15 10 5 0 200 300 400 500 600 200 300 400 500 600 200 300 400 500 600 200 300 400 500 600 200 300 400 500 600 200 300 400 500 600 13:00 Tg=15.7°C, Tt=14.6°C RHg=59 %, RHt=61% 14:00 Tg=15.9 °C, Tt=14.9 °C RHg=58%, RHt=61 % 15:00 Tg=15.7°C, Tt=14.9 °C RHg=60%, RHt=60 % 16:00 Tg=15.3°C, Tt=14.8 °C RHg=63%, RHt=61% 17:00 Tg=15.3°C, Tt=14.8°C RHg=62%, RHt=62% 12:00 Tg=15.6°C, Tt=14.5°C RHg=61%, RHt=63% 19:00 Tg=11.3°C, Tt=13.0 °C RHg=83%, RHt=70 % Tg=10.2°C, Tt=12.1 °C RHg=88%, RHt=76 % 20:00 Tg=10.1°C, Tt=11.3°C RHg=89%, RHt=81% 21:00 Tg=10.1°C, Tt=10.5°C RHg=88%, RHt=85%22:00 RHg=93%, RHt=90%Tg=9.2°C, Tt=9.6°C 23:00 18:00 Tg=13.8°C, Tt=13.9 °C RHg=69%, RHt=66 % 01:00 Tg=6.2 °C, Tt=8.9 °C RHg=99 %, RHt=89 % 02:00 Tg=5.5°C, Tt=8.2 °C RHg=99 %, RHt=92 % 03:00 Tg=5.1°C, Tt=7.6 °C RHg=100 %, RHt=95% 04:00 Tg=5.1°C, Tt=7.0 °C RHg=99 %, RHt=99 % 05:00 Tg=4.6°C, Tt=7.1°C RHg=100 %, RHt=97 % 00:00 Tg=7.0°C, Tt=9.1°C RHg=97%, RHt=86 % 07:00 Tg=6.3°C, Tt=6.5°C RHg=99%, RHt=100 % 08:00 Tg=8.5°C, Tt=7.9 °C RHg=92%, RHt=95 % 09:00 Tg=10.4°C, Tt=9.3°C RHg=85%, RHt=90 % 10:00 Tg=12.0°C, Tt=11.0 °C RHg=76%, RHt=79 % 11:00 Tg=13.3°C, Tt=12.1°C RHg=65%, RHt=69 % 06:00 Tg=4.7°C, Tt=6.1°C RHg=99%, RHt=100%
Figure 9. Hourly changes of the ratios between estimated tower and ground HOM concentrations from 12:00 on 8 September to 11:00 on 9 September (inversion night). Markers are sized by ground HOM concentrations and colored by the O3 difference between tower and ground (O3tower−O3ground). Hourly ambient temperatures at ground (Tg) and tower (Tt) levels and RH at ground (RHg) and tower (RHt) levels are
shown in each subplot.
the large discrepancies between the two CI-APi-TOFs were only observed when other key parameters (like ozone) were found to deviate considerably between the two heights.
From the micrometeorology side, the contribution from the potential micrometeorological processes in the layer be-tween 1.5 and 4.2 m (bebe-tween the sampling heights of the ground HOMs and other parameters) could not be estimated with the current experiment design (i.e., only two measure-ment heights). Similarly, the influence from horizontal ad-vection could not be entirely ruled out as a reason for the reduced ground-level HOM concentrations (and other signif-icantly changed species) because of the possible horizontal inhomogeneity of HOM precursors and oxidants below the canopy. However, our conclusion was confirmed by the in-compatibility between the increasing ground-level MT and
CO2 concentrations and the advection hypothesis (i.e., all
species would show similar tendencies if advection played a major role), indicating the influence of horizontal and ver-tical advection is probably minor when compared to the in-creasing sink. However, conclusive evidence is still needed, which highlights the need for joint vertical–planar HOM studies, measuring both vertical and horizontal distribution of HOM concentrations.
4 Conclusion
Highly oxygenated molecules (HOMs) were measured above the canopy and at ground level (below the canopy) in a bo-real forest environment during the IBAIRN campaign that took place in September 2016. Boundary layer dynamics and micrometeorology were found to be important factors that influence the abundance of and trends in HOMs at ground level, by perturbing both their sources and sinks. In the well-mixed boundary layer (e.g., during daytime or nights
with-out strong inversion), HOM concentrations and other mea-sured species were overall similar between the ground and tower measurements. In contrast, much lower ground-level HOM concentrations were observed when nighttime temper-ature inversion and formation of a decoupled layer occurred below the canopy. On the one hand, the production of the
ground-level HOMs could be affected by the decreasing O3
concentrations and the increasing MT concentration in the shallow layer. On the other hand, the surface area-to-volume ratio dramatically increased in the shallow layer compared to the nocturnal boundary layer. The possibility of losses on surfaces for ground-level HOMs became much larger than usual during inversion nights. The enhanced interaction of air in the decoupled layer with the forest floor was supported
by increased concentrations of CO2, emitted mainly from the
ground, in this layer.
We have presented the first detailed measurements of HOMs below and above the canopy across a wide range of at-mospheric stability conditions. The results highlight the sig-nificance of near-ground boundary layer dynamics and mi-crometeorological processes on the ambient HOMs, show-ing that ground-based HOM measurement at this site might not be representative for the entire nocturnal boundary layer. Conventionally, field measurements of HOMs and other pa-rameters are mostly performed close to the ground, and the possible effect of boundary layer dynamics and micromete-orological processes to the HOM concentrations has rarely been considered. Aerosol particle growth and SOA forma-tion rates at ground level are likely to be influenced by the reduced HOM concentrations on the inversion nights. How-ever, there are still limitations due to current experiment de-sign, such as horizontal separation in instrument setup, or the uncertainties from using point measurements at two heights to infer larger-scale exchange. Clearly, more vertical and planar measurements of HOMs are needed to confirm the
emerging picture presented here. Influence of boundary layer dynamics should be better characterized and evaluated in fu-ture field campaigns.
Data availability. The time series of the measured trace gases, meteorological parameters, and estimated total HOM concentra-tions at the ground and tower levels will be available at the end of December 2018 (https://doi.org/10.5281/zenodo.1489079, Zha, 2018). For other data please contact the first author via email ([email protected]).
Supplement. The supplement related to this article is available online at: https://doi.org/10.5194/acp-18-17437-2018-supplement.
Author contributions. QZ, MR, and ME designed the study. QZ, CY, HJ, MR, NS, JA, and SS collected the data. QZ and CY an-alyzed the data. QZ wrote the paper. All coauthors contributed to data interpretation and commented on the paper.
Competing interests. The authors declare that they have no con-flict of interest. Douglas R. Worsnop is affiliated with Aerodyne Research, who produce the CI-APi-TOF instruments used in this study.
Acknowledgements. This work was supported by the IBAIRN project, the Academy of Finland Center of Excellence in Atmo-spheric Science, European commission Actris2 and Actris PPP, the European Research Council (grant 638703-COALA), transnational access from ENVRI plus, and the SMEAR II technical team. Qiaozhi Zha thanks ATM-DP (Doctoral Program in Atmospheric Sciences) graduate programs, John Crowley and the Max Plank Institute in association with the IBAIRN proposal, and the tofTools team for providing tools for mass spectrometry analysis. Gabriel Katul acknowledges the support from the US National Science Foundation (NSF-EAR-1344703, NSF-AGS-1644382), the U.S. Department of Energy (DE-SC0011461), and the University of Helsinki for supporting a 3-month sabbatical leave at the Division of Atmospheric Sciences. Otso Peräkylä thanks the Vilho, Yrjö and Kalle Väisälä Foundation.
Edited by: Kyung-Eun Min
Reviewed by: two anonymous referees
References
Aalto, P., Hämeri, K., Becker, E., Weber, R., Salm, J., Mäkelä, J. M., Hoell, C., O’dowd, C. D., Hansson, H.-C., Väkevä, M., Koponen, I. K., Buzorius, G., and Kulmala, M.: Physical characterization of aerosol particles during nucleation events, Tellus B, 53, 344– 358, https://doi.org/10.3402/tellusb.v53i4.17127, 2001. Alekseychik, P., Mammarella, I., Launiainen, S., Rannik, Ü.,
and Vesala, T.: Evolution of the nocturnal decoupled layer
in a pine forest canopy, Agr. Forest. Meteorol., 174, 15–27, https://doi.org/10.1016/j.agrformet.2013.01.011, 2013.
Bäck, J., Aalto, J., Henriksson, M., Hakola, H., He, Q., and Boy, M.: Chemodiversity of a Scots pine stand and implica-tions for terpene air concentraimplica-tions, Biogeosciences, 9, 689–702, https://doi.org/10.5194/bg-9-689-2012, 2012.
Berndt, T., Scholz, W., Mentler, B., Fischer, L., Herrmann, H., Kulmala, M., and Hansel, A.: Accretion Product For-mation from Self- and Cross-Reactions of RO2 Radicals in
the Atmosphere, Angew. Chem. Int. Edit., 57, 3820–3824, https://doi.org/10.1002/anie.201710989, 2018.
Bianchi, F., Tröstl, J., Junninen, H., Frege, C., Henne, S., Hoyle, C. R., Molteni, U., Herrmann, E., Adamov, A., Bukowiecki, N., Chen, X., Duplissy, J., Gysel, M., Hutterli, M., Kangaslu-oma, J., Kontkanen, J., Kürten, A., Manninen, H. E., Münch, S., Peräkylä, O., Petäjä, T., Rondo, L., Williamson, C., Weingart-ner, E., Curtius, J., Worsnop, D. R., Kulmala, M., Dommen, J., and Baltensperger, U.: New particle formation in the free tropo-sphere: A question of chemistry and timing, Science, 352, 1109– 12, https://doi.org/10.1126/science.aad5456, 2016.
Bianchi, F., Garmash, O., He, X., Yan, C., Iyer, S., Rosendahl, I., Xu, Z., Rissanen, M. P., Riva, M., Taipale, R., Sarnela, N., Petäjä, T., Worsnop, D. R., Kulmala, M., Ehn, M., and Junninen, H.: The role of highly oxygenated molecules (HOMs) in determining the composition of ambient ions in the boreal forest, Atmos. Chem. Phys., 17, 13819–13831, https://doi.org/10.5194/acp-17-13819-2017, 2017.
Chen, X., Quéléver, L. L. J., Fung, P. L., Kesti, J., Rissanen, M. P., Bäck, J., Keronen, P., Junninen, H., Petäjä, T., Kerminen, V.-M., and Kulmala, M.: Observations of ozone depletion events in a Finnish boreal forest, Atmos. Chem. Phys., 18, 49–63, https://doi.org/10.5194/acp-18-49-2018, 2018.
Crounse, J. D., Nielsen, L. B., Jørgensen, S., Kjaergaard, H. G., and Wennberg, P. O.: Autoxidation of Organic Com-pounds in the Atmosphere, J. Phys. Chem. Lett., 4, 3513–3520, https://doi.org/10.1021/jz4019207, 2013.
Dada, L., Paasonen, P., Nieminen, T., Buenrostro Mazon, S., Kon-tkanen, J., Peräkylä, O., Lehtipalo, K., Hussein, T., Petäjä, T., Kerminen, V.-M., Bäck, J., and Kulmala, M.: Long-term analysis of clear-sky new particle formation events and non-events in Hyytiälä, Atmos. Chem. Phys., 17, 6227–6241, https://doi.org/10.5194/acp-17-6227-2017, 2017.
Eerdekens, G., Yassaa, N., Sinha, V., Aalto, P. P., Aufmhoff, H., Arnold, F., Fiedler, V., Kulmala, M., and Williams, J.: VOC mea-surements within a boreal forest during spring 2005: on the oc-currence of elevated monoterpene concentrations during night time intense particle concentration events, Atmos. Chem. Phys., 9, 8331–8350, https://doi.org/10.5194/acp-9-8331-2009, 2009. Ehn, M., Junninen, H., Petäjä, T., Kurtén, T., Kerminen, V.-M.,
Schobesberger, S., Manninen, H. E., Ortega, I. K., Vehkamäki, H., Kulmala, M., and Worsnop, D. R.: Composition and tem-poral behavior of ambient ions in the boreal forest, Atmos. Chem. Phys., 10, 8513–8530, https://doi.org/10.5194/acp-10-8513-2010, 2010.
Ehn, M., Kleist, E., Junninen, H., Petäjä, T., Lönn, G., Schobes-berger, S., Dal Maso, M., Trimborn, A., Kulmala, M., Worsnop, D. R., Wahner, A., Wildt, J., and Mentel, Th. F.: Gas phase formation of extremely oxidized pinene reaction products in
chamber and ambient air, Atmos. Chem. Phys., 12, 5113–5127, https://doi.org/10.5194/acp-12-5113-2012, 2012.
Ehn, M., Thornton, J. A., Kleist, E., Sipilä, M., Junninen, H., Pullinen, I., Springer, M., Rubach, F., Tillmann, R., Lee, B., Lopez-Hilfiker, F., Andres, S., Acir, I.-H., Rissanen, M., Joki-nen, T., Schobesberger, S., Kangasluoma, J., KontkaJoki-nen, J., Nieminen, T., Kurtén, T., Nielsen, L. B., Jørgensen, S., Kjaer-gaard, H. G., Canagaratna, M., Maso, M. D., Berndt, T., Petäjä, T., Wahner, A., Kerminen, V.-M., Kulmala, M., Worsnop, D. R., Wildt, J., and Mentel, T. F.: A large source of low-volatility secondary organic aerosol, Nature, 506, 476–479, https://doi.org/10.1038/nature13032, 2014.
Ehn, M., Berndt, T., Wildt, J., and Mentel, T.: Highly Oxygenated Molecules from Atmospheric Autoxidation of Hydrocarbons: A Prominent Challenge for Chemical Kinetics Studies, Int. J. Chem. Kinet., 49, 821–831, https://doi.org/10.1002/kin.21130, 2017.
Hari, P. and Kulmala, M.: Station for Measuring Ecosystem-Atmosphere Relations (SMEAR II), Boreal Environ. Res., 10, 315–322, 2005.
Hari, P., Nikinmaa, E., Pohja, T., Siivola, E., Bäck, J., Vesala, T., and Kulmala, M.: Station for measuring ecosystem-atmosphere relations: SMEAR, Phys. Physiol. For. Ecol., 9789400756, 471– 487, https://doi.org/10.1007/978-94-007-5603-8_9, 2013. Heinritzi, M., Simon, M., Steiner, G., Wagner, A. C., Kürten,
A., Hansel, A., and Curtius, J.: Characterization of the mass-dependent transmission efficiency of a CIMS, Atmos. Meas. Tech., 9, 1449–1460, https://doi.org/10.5194/amt-9-1449-2016, 2016.
Hyttinen, N., Kupiainen-Määttä, O., Rissanen, M. P., Muuro-nen, M., Ehn, M., and Kurtén, T.: Modeling the Charging of Highly Oxidized Cyclohexene Ozonolysis Products Using Nitrate-Based Chemical Ionization, J. Phys. Chem. A, 119, 6339–6345, https://doi.org/10.1021/acs.jpca.5b01818, 2015. Jokinen, T., Sipilä, M., Junninen, H., Ehn, M., Lönn, G., Hakala,
J., Petäjä, T., Mauldin III, R. L., Kulmala, M., and Worsnop, D. R.: Atmospheric sulphuric acid and neutral cluster measure-ments using CI-APi-TOF, Atmos. Chem. Phys., 12, 4117–4125, https://doi.org/10.5194/acp-12-4117-2012, 2012.
Jokinen, T., Sipilä, M., Richters, S., Kerminen, V.-M., Paasonen, P., Stratmann, F., Worsnop, D., Kulmala, M., Ehn, M., Herrmann, H., and Berndt, T.: Rapid Autoxidation Forms Highly Oxidized RO2Radicals in the Atmosphere, Angew. Chem. Int. Edit., 53,
14596–14600, https://doi.org/10.1002/anie.201408566, 2014. Jokinen, T., Kausiala, O., Garmash, O., Peräkylä, O., Junninen, H.,
Schobesberger, S., Yan, C., Sipilä, M., and Rissanen, M. P.: Pro-duction of highly oxidized organic compounds from ozonolysis of β-caryophyllene: laboratory and field measurements, Boreal Environ. Res., 21, 262–273, 2016.
Junninen, H., Ehn, M., Petäjä, T., Luosujärvi, L., Kotiaho, T., Kos-tiainen, R., Rohner, U., Gonin, M., Fuhrer, K., Kulmala, M., and Worsnop, D. R.: A high-resolution mass spectrometer to mea-sure atmospheric ion composition, Atmos. Meas. Tech., 3, 1039– 1053, https://doi.org/10.5194/amt-3-1039-2010, 2010.
Katul, G. G., Finnigan, J. J., Poggi, D., Leuning, R., and Belcher, S. E.: The Influence of Hilly Terrain on Canopy-Atmosphere Car-bon Dioxide Exchange, Bound.-Lay. Meteorol., 118, 189–216, https://doi.org/10.1007/s10546-005-6436-2, 2006.
Katul, G. G., Porporato, A., Shah, S., and Bou-Zeid, E.: Two phenomenological constants explain similarity laws in stably stratified turbulence, Phys. Rev. E, 89, 023007, https://doi.org/10.1103/PhysRevE.89.023007, 2014.
Kirkby, J., Duplissy, J., Sengupta, K., Frege, C., Gordon, H., Williamson, C., Heinritzi, M., Simon, M., Yan, C., Almeida, J., Tröstl, J., Nieminen, T., Ortega, I. K., Wagner, R., Adamov, A., Amorim, A., Bernhammer, A.-K., Bianchi, F., Breitenlechner, M., Brilke, S., Chen, X., Craven, J., Dias, A., Ehrhart, S., Flagan, R. C., Franchin, A., Fuchs, C., Guida, R., Hakala, J., Hoyle, C. R., Jokinen, T., Junninen, H., Kangasluoma, J., Kim, J., Krapf, M., Kürten, A., Laaksonen, A., Lehtipalo, K., Makhmutov, V., Mathot, S., Molteni, U., Onnela, A., Peräkylä, O., Piel, F., Petäjä, T., Praplan, A. P., Pringle, K., Rap, A., Richards, N. A. D., Riip-inen, I., Rissanen, M. P., Rondo, L., Sarnela, N., Schobesberger, S., Scott, C. E., Seinfeld, J. H., Sipilä, M., Steiner, G., Stozhkov, Y., Stratmann, F., Tomé, A., Virtanen, A., Vogel, A. L., Wag-ner, A. C., WagWag-ner, P. E., WeingartWag-ner, E., Wimmer, D., Winkler, P. M., Ye, P., Zhang, X., Hansel, A., Dommen, J., Donahue, N. M., Worsnop, D. R., Baltensperger, U., Kulmala, M., Carslaw, K. S., and Curtius, J.: Ion-induced nucleation of pure biogenic parti-cles, Nature, 533, 521–526, https://doi.org/10.1038/nature17953, 2016.
Kulmala, L., Launiainen, S., Pumpanen, J., Lankreijer, H., Lin-droth, A., Hari, P., and Vesala, T.: H2O and CO2 fluxes at
the floor of a boreal pine forest, Tellus B, 60B, 167–178, https://doi.org/10.1111/j.1600-0889.2007.00327.x, 2008. Kulmala, M., Dal Maso, M., Mäkelä, J. M., Pirjola, L.,
Väkevä, M., Aalto, P., Miikkulainen, P., Hämeri, K., and O’Dowd, C. D.: On the formation, growth and composi-tion of nucleacomposi-tion mode particles, Tellus B, 53, 479–490, https://doi.org/10.3402/tellusb.v53i4.16622, 2001.
Kulmala, M., Kontkanen, J., Junninen, H., Lehtipalo, K., Manni-nen, H. E., NiemiManni-nen, T., Petäjä, T., Sipilä, M., Schobesberger, S., Rantala, P., Franchin, A., Jokinen, T., Järvinen, E., Äijälä, M., Kangasluoma, J., Hakala, J., Aalto, P. P., Paasonen, P., Mikkilä, J., Vanhanen, J., Aalto, J., Hakola, H., Makkonen, U., Ruuska-nen, T., Mauldin, R. L., Duplissy, J., Vehkamäki, H., Bäck, J., Kortelainen, A., Riipinen, I., Kurtén, T., Johnston, M. V, Smith, J. N., Ehn, M., Mentel, T. F., Lehtinen, K. E. J., Laakso-nen, A., KermiLaakso-nen, V.-M., and Worsnop, D. R.: Direct observa-tions of atmospheric aerosol nucleation., Science, 339, 943–946, https://doi.org/10.1126/science.1227385, 2013.
Kürten, A., Bergen, A., Heinritzi, M., Leiminger, M., Lorenz, V., Piel, F., Simon, M., Sitals, R., Wagner, A. C., and Curtius, J.: Ob-servation of new particle formation and measurement of sulfuric acid, ammonia, amines and highly oxidized organic molecules at a rural site in central Germany, Atmos. Chem. Phys., 16, 12793– 12813, https://doi.org/10.5194/acp-16-12793-2016, 2016. Launiainen, S., Katul, G. G., Grönholm, T., and Vesala, T.:
Parti-tioning ozone fluxes between canopy and forest floor by mea-surements and a multi-layer model, Agr. Forest. Meteorol., 173, 85–99, https://doi.org/10.1016/j.agrformet.2012.12.009, 2013. Lauros, J., Nilsson, E. D., Dal Maso, M., and Kulmala, M.:
Contribution of mixing in the ABL to new particle formation based on observations, Atmos. Chem. Phys., 7, 4781–4792, https://doi.org/10.5194/acp-7-4781-2007, 2007.
Mahrt, L.: Nocturnal Boundary-Layer Regimes, Bound.-Lay. Me-teorol., 88, 255–278, https://doi.org/10.1023/A:1001171313493, 1998.
Mahrt, L., Vickers, D., Nakamura, R., Soler, M. R., Sun, J., Burns, S., and Lenschow, D. H.: Shallow Drainage Flows, Bound.-Lay. Meteorol., 101, 243–260, https://doi.org/10.1023/A:1019273314378, 2001.
Mammarella, I., Kolari, P., Rinne, J., Keronen, P., Pumpanen, J., and Vesala, T.: Determining the contribution of vertical advection to the net ecosystem exchange at Hyytiälä forest, Finland, Tellus B, 59, 900–909, https://doi.org/10.1111/j.1600-0889.2007.00306.x, 2007.
Mentel, T. F., Springer, M., Ehn, M., Kleist, E., Pullinen, I., Kurtén, T., Rissanen, M., Wahner, A., and Wildt, J.: Formation of highly oxidized multifunctional compounds: autoxidation of peroxy radicals formed in the ozonolysis of alkenes – deduced from structure–product relationships, Atmos. Chem. Phys., 15, 6745– 6765, https://doi.org/10.5194/acp-15-6745-2015, 2015. Molteni, U., Bianchi, F., Klein, F., El Haddad, I., Frege, C., Rossi,
M. J., Dommen, J., and Baltensperger, U.: Formation of highly oxygenated organic molecules from aromatic compounds, At-mos. Chem. Phys., 18, 1909–1921, https://doi.org/10.5194/acp-18-1909-2018, 2018.
Orlando, J. J. and Tyndall, G. S.: Laboratory studies of organic peroxy radical chemistry: an overview with emphasis on recent issues of atmospheric significance, Chem. Soc. Rev., 41, 6294, https://doi.org/10.1039/c2cs35166h, 2012.
Ouwersloot, H. G., Vilà-Guerau de Arellano, J., Nölscher, A. C., Krol, M. C., Ganzeveld, L. N., Breitenberger, C., Mammarella, I., Williams, J., and Lelieveld, J.: Characterization of a boreal convective boundary layer and its impact on atmospheric chem-istry during HUMPPA-COPEC-2010, Atmos. Chem. Phys., 12, 9335–9353, https://doi.org/10.5194/acp-12-9335-2012, 2012. Rannik, Ü., Mammarella, I., Keronen, P., and Vesala, T.:
Ver-tical advection and nocturnal deposition of ozone over a boreal pine forest, Atmos. Chem. Phys., 9, 2089–2095, https://doi.org/10.5194/acp-9-2089-2009, 2009.
Rannik, Ü., Altimir, N., Mammarella, I., Bäck, J., Rinne, J., Ru-uskanen, T. M., Hari, P., Vesala, T., and Kulmala, M.: Ozone deposition into a boreal forest over a decade of observations: evaluating deposition partitioning and driving variables, Atmos. Chem. Phys., 12, 12165–12182, https://doi.org/10.5194/acp-12-12165-2012, 2012.
Rantala, P., Taipale, R., Kajos, M. K., Patokoski, J., Ruuska-nen, T. M., Rinne, J., and Aalto, J.: Continuous flux measure-ments of VOCs using PTR-MS – Reliability and feasibility of disjunct-eddy-covariance, layer-gradient, and surface-layer-profile methods, Boreal Environ. Res., 19, 87–107, 2014. Raupach, M. R. and Thom, A. S.: Turbulence in and above
Plant Canopies, Annu. Rev. Fluid Mech., 13, 97–129, https://doi.org/10.1146/annurev.fl.13.010181.000525, 1981. Rissanen, M. P., Kurtén, T., Sipilä, M., Thornton, J. A.,
Kangaslu-oma, J., Sarnela, N., Junninen, H., Jørgensen, S., Schallhart, S., Kajos, M. K., Taipale, R., Springer, M., Mentel, T. F., Ruuska-nen, T., Petäjä, T., Worsnop, D. R., Kjaergaard, H. G., and Ehn, M.: The Formation of Highly Oxidized Multifunctional Prod-ucts in the Ozonolysis of Cyclohexene, J. Am. Chem. Soc., 136, 15596–15606, https://doi.org/10.1021/ja507146s, 2014.
Taipale, R., Ruuskanen, T. M., Rinne, J., Kajos, M. K., Hakola, H., Pohja, T., and Kulmala, M.: Technical Note: Quanti-tative long-term measurements of VOC concentrations by PTR-MS – measurement, calibration, and volume mixing ra-tio calculara-tion methods, Atmos. Chem. Phys., 8, 6681–6698, https://doi.org/10.5194/acp-8-6681-2008, 2008.
Tröstl, J., Chuang, W. K., Gordon, H., Heinritzi, M., Yan, C., Molteni, U., Ahlm, L., Frege, C., Bianchi, F., Wagner, R., Si-mon, M., Lehtipalo, K., Williamson, C., Craven, J. S., Du-plissy, J., Adamov, A., Almeida, J., Bernhammer, A.-K., Bre-itenlechner, M., Brilke, S., Dias, A., Ehrhart, S., Flagan, R. C., Franchin, A., Fuchs, C., Guida, R., Gysel, M., Hansel, A., Hoyle, C. R., Jokinen, T., Junninen, H., Kangasluoma, J., Kesk-inen, H., Kim, J., Krapf, M., Kürten, A., Laaksonen, A., Lawler, M., Leiminger, M., Mathot, S., Möhler, O., Nieminen, T., On-nela, A., Petäjä, T., Piel, F. M., Miettinen, P., Rissanen, M. P., Rondo, L., Sarnela, N., Schobesberger, S., Sengupta, K., Sip-ilä, M., Smith, J. N., Steiner, G., Tomè, A., Virtanen, A., Wag-ner, A. C., WeingartWag-ner, E., Wimmer, D., Winkler, P. M., Ye, P., Carslaw, K. S., Curtius, J., Dommen, J., Kirkby, J., Kulmala, M., Riipinen, I., Worsnop, D. R., Donahue, N. M., and Bal-tensperger, U.: The role of low-volatility organic compounds in initial particle growth in the atmosphere, Nature, 533, 527–531, https://doi.org/10.1038/nature18271, 2016.
Vickers, D., Irvine, J., Martin, J. G., and Law, B. E.: Nocturnal subcanopy flow regimes and missing car-bon dioxide, Agr. Forest. Meteorol., 152, 101–108, https://doi.org/10.1016/j.agrformet.2011.09.004, 2012.
Viggiano, A. A., Seeley, J. V., Mundis, P. L., Williamson, J. S., and Morris, R. A.: Rate Constants for the Reactions of XO3−(H2O)n
(X = C, HC, and N) and NO3-(HNO3)n with H2SO4:
Implica-tions for Atmospheric Detection of H2SO4, J. Phys. Chem. A,
101, 8275–8278, https://doi.org/10.1021/jp971768h, 1997. Yan, C., Nie, W., Äijälä, M., Rissanen, M. P., Canagaratna, M.
R., Massoli, P., Junninen, H., Jokinen, T., Sarnela, N., Häme, S. A. K., Schobesberger, S., Canonaco, F., Yao, L., Prévôt, A. S. H., Petäjä, T., Kulmala, M., Sipilä, M., Worsnop, D. R., and Ehn, M.: Source characterization of highly oxidized multifunc-tional compounds in a boreal forest environment using posi-tive matrix factorization, Atmos. Chem. Phys., 16, 12715–12731, https://doi.org/10.5194/acp-16-12715-2016, 2016.
Zha, Q.: Data for “Vertical characterization of highly oxygenated molecules (HOMs) below and above a boreal forest canopy”, https://doi.org/10.5281/zenodo.1489079, 2018.
Zhao, J., Ortega, J., Chen, M., McMurry, P. H., and Smith, J. N.: De-pendence of particle nucleation and growth on high-molecular-weight gas-phase products during ozonolysis of α-pinene, At-mos. Chem. Phys., 13, 7631–7644, https://doi.org/10.5194/acp-13-7631-2013, 2013.