HAL Id: hal-01809059
https://hal-univ-rennes1.archives-ouvertes.fr/hal-01809059v2
Submitted on 11 Sep 2018
HAL is a multi-disciplinary open access
archive for the deposit and dissemination of sci-entific research documents, whether they are pub-lished or not. The documents may come from teaching and research institutions in France or abroad, or from public or private research centers.
L’archive ouverte pluridisciplinaire HAL, est destinée au dépôt et à la diffusion de documents scientifiques de niveau recherche, publiés ou non, émanant des établissements d’enseignement et de recherche français ou étrangers, des laboratoires publics ou privés.
Estuary-on-a-chip Unexpected results for the fate and
transport of nanoparticles
Julien Gigault, Marianne Balaresque, Hervé Tabuteau
To cite this version:
Julien Gigault, Marianne Balaresque, Hervé Tabuteau. Estuary-on-a-chip Unexpected results for the fate and transport of nanoparticles. Environmental science .Nano, Royal Society of Chemistry, 2018, 5 (5), pp.1231-1236. �10.1039/c8en00184g�. �hal-01809059v2�
Estuary-on-a-chip: unexpected results for nanoparticles fate and
1
transport
2
Julien Gigault1*, Marianne Balaresque1, Hervé Tabuteau*2, 3
1
Laboratoire Géosciences Rennes, 4
UMR6118 CNRS/Université de Rennes1, 5
263 Av. Général Leclerc, 35000 Rennes 6
*julien.gigault@univ-rennes1.fr 7
8
2
Institut de Physique de Rennes, 9
UMR6251 CNRS/Université Rennes 1, 10
263 Av. Général Leclerc, 35000 Rennes 11
*herve.tabuteau@univ-rennes1.fr 12
Abstract 13
The aim of this work is to evaluate the influence of a spatial salinity gradient, as encountered 14
in an estuarine when fresh water meets salty one, on the aggregation features of fullerene 15
nanoparticles aggregates (nC60). To model these environmental conditions, we design a
16
specific microfluidic device. In literature, physical phenomena occurring in estuarine area, 17
such as the salinity gradient and the flow conditions, were never considered. Our results 18
suggest that even a short time exposure (couple of seconds) to a salinity gradient, i.e. 19
dynamical spatial conditions, profoundly affects the aggregation properties of nanoparticles 20
and therefore their environmental behavior and fate. It appears that a salinity gradient could 21
enhanced the stability of nanoparticles, especially at high ionic strength (closed to the 22
seawater level one). Contrary to the common approach of particle aggregation in the lab in 23
environmental conditions, our study shows the need to reconsider the spatial and temporal 24
variation of abiotic parameters (ionic strength, pH, organic matter concentration) in the 25
understanding and the evaluation of nanoparticles environmental fate and transportation 26
mechanisms. 27
28
Keywords: nanoparticles, fate, estuary, aggregation, microfluidic, lab-on-a-chip 29
Introduction 1
Because the main route of contaminant transport is river, estuarine systems are one of the 2
most targeted environmental compartment. Those ones are known to play a decisive role in 3
the conditioning of the colloidal materials life cycle1,2. Estuarine systems are characterized by 4
specific physical and chemical conditions: salinity gradient, wastewater income, organic 5
matter, and human pressure (industrial and agricultural activities). From all these parameters 6
the ionic strength, characterized by the salinity, and the organic matter are the main 7
parameters that affect the stability of micro-nanoscale materials 1,3. 8
Over the last ten years, the influence of the ionic strength (IS) on the physical and chemical 9
properties of nanoparticles is one of the most studied parameter, for both carbon-based 10
(fullerene, carbon nanotubes)4–9 and metal-based (Ag, Au, TiO2) nanomaterials10–14. To do so,
11
the kinetic of nanoparticles aggregation is generally determined by monitoring their size 12
evolution according to the time after an addition of a known concentration of electrolyte in 13
the bulk. However, since this measurement is made while the bulk salt concentration is 14
supposed to be homogeneous, it cannot be representative to what happens in the natural 15
environment. Indeed, these experiments are performed in static or large scale dynamic 16
reactors (such as columns) that are not representative of the natural conditions in which there 17
are spatial and temporal variations of the salt concentration. Indeed, the major issue in the 18
environmental media studies (in bulk liquid and porous media) is the limited applicability to 19
the real dynamic process affecting the transport of particles at environmental scale. More 20
generally NPs behaviors in the environment results from various physical and chemical 21
heterogeneities that the NPs come across. For estuarine system, the salinity gradient is one of 22
these spatial and temporal heterogeneities, and up to now nobody has considered its influence 23
on the fate of NPs. 24
Recently, new experimental methods and capacities, based on microfluidic devices, are 1
opening the door to environmental science for better understand the fate of species in dynamic 2
systems, closer to real natural conditions 15–18. The aim of this work is to evaluate the fate of 3
nanoparticles, using fullerene aggregates (nC60), in a salinity gradient. To do that we
4
developed a specific microfluidic device to simulate an environmentally representative 5
salinity gradient. Our results, compared to classical batch experiments, demonstrates a 6
different and specific aggregation kinetics, which raise new questions and concerns of the 7
existing knowledge on the environmental fate of nanoparticles in estuarine system. 8 9 Experimental 10 11 Sample preparation 12
nC60 were prepared according to classical procedure previously described 19–21. Typically, 80
13
mg of C60 powder (VWR, Fontenay-sous-Bois) were placed in an Erlenmeyer flask with 200
14
mL of deionized (DI) water (18.2 MΩ.cm at 25°C) and continuously stirred for 2 weeks. 15
Finally, the final fullerene aggregates solution (nC60) was filtered at 0.45 µm to remove large
16
aggregates. The final concentration of nC60 is 7.2±0.7 µg g-1 and was characterized by both
17
Total Organic Carbon analyzer (Shimadzu, TOC-Vcph) and UV-Vis (Perkin Elmer 18
spectrophotometer, Lambda 650). The corresponding size distribution of the nC60 initial stock
19
solution is dzH=180.7 nm (with a polydispersity index, PDI=0.07) and is determined by in-situ
20
dynamic light scattering (Vasco-Flex, Cordouan Technologies, France). Preparation of nC60
21
solutions were replicated 8 times with similar size distribution (see Electronic Supplemental 22
Information, Fig. S1). 23
24
Microfluidic reactor design and operation 25
We design a microfluidic device to simulate the estuarine salinity gradient (figure 1). We used 1
standard soft lithography to make this microfluidic channel22. First we used a negative 2
photoresist resin (Su8 2050 Microchem) that was spin coated on a silicon wafer, heated and 3
cured with UV light through a mask on which the outline of the channel is printed. The resin 4
is again heated and developed in a bath of PGMEA to remove the uncured part of the resin. 5
Thereafter we cast polydimethylsiloxane (PDMS, Sylgard 184 silicone elastomer kit, Dow 6
Corning) on the SU8 master. Once cured at 70°C for an hour the PDMS slab becomes solid, it 7
is removed from the mold and punched to get the inlets and outlets holes of our channel. Then 8
the channel is sealed by gluing the slab on a glass plate using a plasma cleaner (Harrick 9
Plasma). This process renders the surface of the PDMS channel hydrophilic. To recover a 10
hydrophobic surface we put the microfluidic device in an oven at 120°C for two hours.We 11
inject fluid in the channel thanks to syringe pumps (KDS) at the inlets. In a typical
12
experiment, we first saturate the channel with pure water and then connect pure water or salty 13
on one inlet and a dilute fullerenes suspension on the other. The flow rates were controlled by 14
syringe pump from 0.1 to 1.0 ml/h. At those rates the channel is filled in less than a couple of 15
seconds. 16
The microfluidic device is composed of 5 mm long and 200 µm wide inlets and outlets (“A 17
out” and “B out”) arms on either side of a 3cm long channel with a width of 800 µm and a 18
height of 75 µm (figure 1). In the following we focus on a given flow rate equals to 1.0 ml/h 19
but we get similar results over a wide range of flow rates (0.1 to 1.0 ml/h). 20
Figure 1: Scheme of the microfluidic dynamic and operation. At the entrance of the MD, two inlets are dedicated for the
1
injection of nC60 (nanoparticles) in DI water and for the NaCl with salinity closed to Estuary mouth (500 mM). Two outlets
2
are identified, Aout and Bout, and are symmetric to the two entrances in term of geometry.
3
The Figure 1 illustrate the microfluidic device used to simulate the estuarine salinity gradient. 4
Each microfluidic experiment are performed in three steps: 5
1-Salt calibration. We first inject pure water and a salty blue dye solution (Patent Blue from 6
Sigma Aldrich, #198218). This configuration allows us to visualize the salinity gradient on 7
the image that can be analyzed (Fig. S2 top). We checked that the dye does not affect the 8
salinity gradient. The average salt concentration at the two outlets were determined thanks to 9
the UV-spectra of the NaCl stock solution for various salt concentration (Fig. S2 middle and 10
bottom). To this end we collect samples at both outlets during one hour and then we 11
determine absorbance spectrum of the salty solutions. 12
2-Diffusion nC60 in the MD. We inject, at a flow rate of 1 ml/h, nC60 dispersed in water in one
13
arm and pure water in the other. We collect samples at the two outlets during one hour, we 14
stop the flow and then we determine the size distribution of the NPs. We found the same 15
distribution for both outlets (Fig. S3). This check step confirms that nC60 diffuse around as it
16
flows through the microchip, i.e, the particle concentration is symmetric with respect to the 17
middle vertical plane of the straight channel. 18
3- nC60 aggregates in the salinity gradient. We inject at a flow rate of 1 ml/h in each inlet
19
arm respectively dilute suspension of nC60 in DI water and a salty dye solution (patent blue
20
dissolved in 500 mM of NaCl), a salinity that is encountered in the vicinity of Estuary mouths 21
(∼30 g L-1
). In this experiment the average NaCl concentration is 42 mmol L-1 and 427 mmol 22
L-1 for A and B outlets, respectively. The residence time of the nC60 in the salinity gradient is
23
lower than 3s in average. Again, after one hour of sample collection at the two outlets the 24
flow rate was stopped and we start measuring the temporal evolution of the nC60 size
25
distribution at the two outlets for two hours. Thereafter we compare the temporal evolution of 26
the size distribution of the nC60 aggregates with that of a batch experiment as described in
literature, i.e. dropwise concentrated NaCl dispersed into a nC60 solution and then manually
1
stirred. All the experiments were replicated five times using for each replicate a new nC60
2
stock solution and NaCl preparation. 3
4
Size characterization by Dynamic Light Scattering 5
We performed dynamic light scattering measurements within the collection vials connected to 6
both outlets in order to both monitor and determine in real time the presence and the size 7
distribution of fullerene nanoparticles aggregates transported through the microchip. 8
Thanks to an optical fiber remote head, the system used in this work is a dedicated DLS 9
system for contact less in-situ measurement (see ESI, Fig S4). For the nanoparticles setup, 10
DLS specifications were: laser of 658 nm with a 60mW power; the scattering angle is 170°, 11
the working distance is fixed at 80 mm. 12
For nC60 size kinetics determination with the NaCl, the intensity-weighted mean diameter (i.e.
13
called the z-average hydrodynamic diameter, dzH) variation was used and was derived using
14
the Cumulants algorithm from the auto-correlation function (ACF)23,24. Cumulants is the 15
simplest analysis of the ACF and is ideal to determine the average particle size of a 16
population. For obtaining size distribution from the autocorrelation curve (ACF function), two 17
algorithms were used: Sparse-Batesian-Learning (SBL) and the Cumulants. Cumulants 18
algorithm is one of the most famous and recognized method for determining size distribution 19
of polydisperse sample (Kopel). In the case of environmental and/or highly polydisperse 20
sample, Cumulants method presents several disadvantages. Indeed, this algorithm doesn’t 21
permit independent determination of the long-time baseline of the ACF function and can lead 22
to inconsistent results when different numbers of data points are included in the fit. Using the 23
baseline as a floating parameter makes it possible to detect problems in the data and to fit data 24
when a little bit of noise is present, which our case. The dH size distribution was determined
25
using the Sparse Bayesian learning (SBL) algorithm for the Laplace transform inversion25. 26
This algorithm is adapted to identify, discriminate and determine the presence of several 1
polydisperse population from the ACF coming from the scattered light25. More specifically, it 2
generates a set of sparse solutions of several domains but of the same dimension. Then, it 3
superimposes these solutions to give a global solution with its dimension treated as a 4
regularization parameter. An optimal solution providing a reliable description of a colloidal 5
suspension is determined by an L-curve for selecting the suitable value of the regularization 6
parameter. So, the final result corresponds to the most probable physical solution of the 7
algorithm which position is easily defined as the inflexion of a L-curve representation. This 8
method was proved to be more robust than classical methods used to determine size 9
distribution of polydisperse sample. 10
11
Results and Discussion 12
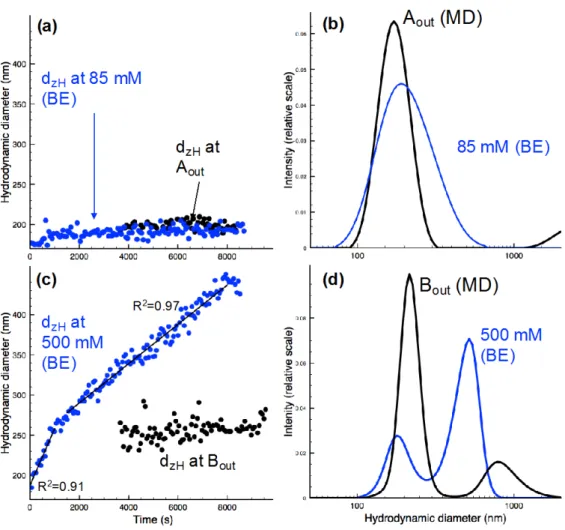
Here our objective is to show that the aggregate growth of nanoparticles depends strongly on 13
the homogeneity of the salt concentration. To do this we compare on Figure 2 the temporal 14
variation of the average hydrodynamic diameter, dzH, of nC60 aggregates either obtained by
15
dropwise NaCl into the bulk, at two concentrations 85 and 500 mmol L-1, (named bulk 16
experiments, BE), or collected at the outlets of our microfluidic device (named MD), Aout and
17
Bout, with an average salt concentration of 42 and 427 mmol L-1, respectively. Both salt
18
concentration in the BE have been chosen to be very close to those obtained at the two outlets 19
of the MD. We choose the two salt concentrations in order to be on both sides of the critical 20
coagulation concentration (CCC) of nC60, which is between 120 and 260 mM of sodium
21
chloride4–6,26 according to the different formation pathways21. 22
BE is generally performed to mimic the evolution of the aggregation features of nanoparticles 23
in salty natural environments, i.e., in the ocean or in Estuaries. In this case, the aggregation of 24
nC60 takes place in a spatially homogeneous salt concentration. Indeed the salt dispersed at
the beginning of the experiment diffuse so quickly throughout the vial that no significant 1
aggregates growth of nC60 is observed during this homogenization process. In the MD
2
experiment the fullerene aggregates (nC60) quickly passed through a NaCl gradient and then
3
they can grow into a vial at rest, in the same conditions than those of the BE. 4
- Below the CCC of (nC60) there is a slight increase of the aggregates sizes at the beginning of
5
the experiment (t< 15 min) for the BE and then there is no temporal evolution of dzH anymore
6
(Fig. 2a, blue circle). The screening of the surface charge is limited at electrolyte 7
concentrations below the CCC and thus nC60 aggregation is limited. In this electrolyte
8
conditions, the nC60 suspension remains quite stable.
9
We found similar results for the microfluidic experiment in the outlet Aout (Fig. 2a, black
10
circle). This is further confirmed by looking at the global size distribution summed over the 11
total kinetics time for both types of experiment (Fig. 2b), which are very similar. The mean 12
aggregate size is a bit larger in the BE than in the MD experiment since the salt concentration 13
is slightly higher in the former case. However, it is worth noting that there is a small micron 14
size population (dzH>1µm) in the MD experiment, which is not the case in the BE. We will
15
get back to this point later on. 16
-Above CCC of (nC60) the situation is completely different whether the nC60 aggregates
17
encounter a spatial salt gradient or not (Fig. 2c). In the BE dzH increases over time, up to 400
18
nm. A similar trend was previously observed in literature, which validates our bulk 19
experiments strategy 26. As expected, above the CCC, the nanoparticle surface charge is 20
completely screened, thus eliminating the energy barrier to aggregation. Surprisingly, for 21
roughly the same amount of salt at the outlet B of the microchip there is only a limited 22
aggregate growth while we are well above the CCC, dzH increasing slightly from 170 nm and
23
levels of around 260 nm. We do not observe any further growth after two hours. Two distinct 24
aggregate size distributions (Fig. 2d) were obtained for Bout and 500mM for the BE. For the 25
BE, the first population at 170 nm corresponds to the initial population of nC60, while the
1
second population at 450 nm corresponds to the nC60 aggregates induced by NaCl. This
2
means that one part of the nC60 aggregates that belongs to this initial populationhas not yet
3
partake to the aggregation process. If the experiment would have last longer this first 4
population would have disappeared progressively. In the MD experiment we also have two 5
aggregate populations. However in the MD experiment, contrary to BE, the initial population 6
is predominant in the size distribution. There is only a slight shift of the average aggregate 7
size, from 170 to 250 nm. Therefore in this case the aggregation mechanism is quite different 8
than before, for the BE. Moreover, as for Aout, a micro-sized population is still observed but
9
with much larger contribution to the overall population of Bout. We suppose that there is a
10
release of micron-sized aggregates of nC60 formed in the MD. Nevertheless, their quantity is
11
relatively low compare to the nano-sized population (170 nm) due to the dependence of 12
intensity of light scattered (I) with size (r6) and concentration c. 13
1
Figure 2: (a,c) illustration of the z-average hydrodynamic diameter (nm), determined by the Cumulants algorithm,
2
according to the ionic strength using bulk experiment and the use of MD (Aout and Bout) (b,d) the average hydrodynamic
3
diameter distribution determined by SBL algorithm and integrated along the whole duration of the kinetics (8500 and 4500 s
4
for bulk an MD experiments, respectively). On (c) for 500 mM (BE), there are two linear fits of the data (dzH = a.T, with
5
a=0.064 and a=0.023 for larger values).
6 7
Several hypotheses can be made to explain the difference between the particle aggregation in 8
the bulk and the microfluidic experiment. 9
o First, the difference between microfluidics and the bulk experiments could be 10
explained by the Diffusion-Limited Colloidal Aggregation (DLCA) and Reaction-11
Limited Colloidal Aggregation (RLCA) mechanisms27. Indeed, it is well known that in 12
batch mode, DLCA is the predominant behavior, where no repulsive barrier exists 13
between the particles and the aggregate growth rate is entirely driven by Brownian 14
motion. DLCA induces the formation of open structure aggregates, with fractal 15
dimension (Df) generally ranging between 1.5 and 2.0 with a linear increase of the
aggregate size over time 5,26, as we also obtained here (Fig. 2.c). In the other case, 1
where there is a repulsive energy barrier between fullerene particles, RLCA is 2
dominant with a limited aggregate growth, contrary to DLCA, as it was observed in 3
case of the microfluidic experiment presented in this work. This result suggests that 4
the salt gradient causes the nC60 aggregation according to the RLCA mode and
5
thereafter remains stable in time over our experimental window. 6
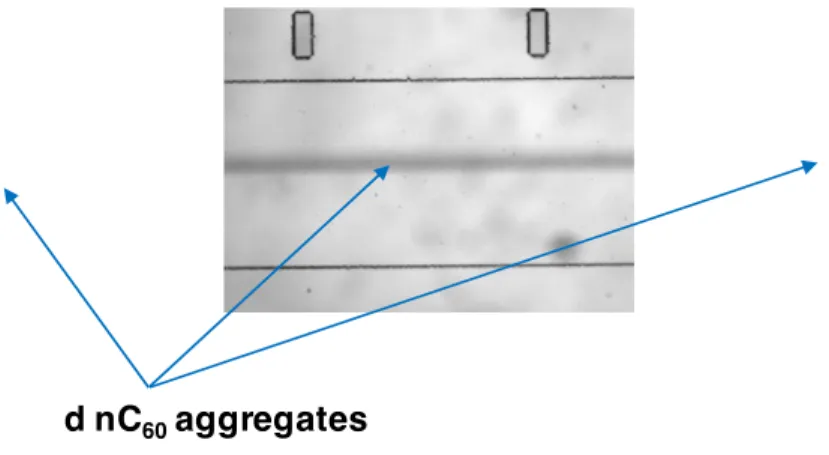
o Secondly, during the transportation of nC60 through the microchip, after several hours
7
of experiments and replicates larger aggregates can be formed in the salt front 8
localized at the center of the channel corresponding to the black line in fig. 3. 9
Indeed, this black-like deposition is characteristic of fullerene aggregates and is 10
localized at the middle of the salt gradient. If too large aggregates could be formed, 11
the micron-sized fraction of those sediment into the MD (Fig. 3). This hypothesis 12
would confirm that micron-sized particles released in Aout and Bout are aggregates
13
formed mainly within the salinity gradient in the MD. Nevertheless, this hypothesis 14
cannot explain why the other part of the size distribution, small particles still present 15
in Bout at high [NaCl] (i.e. >CCC), do not form greater aggregates over time, as big as
16
those observed in bulk experiments. 17
18
Figure 3: Illustration of the MD with deposition of nC60 micron-sized aggregates in the center of the channel (dark lines)
19
after several cycles of operation and replicates
1
Due to the NaCl concentrations used in this study, no representative electronic microscopy 2
image of the nC60 aggregates can be obtained. But, despite the different hypotheses described
3
above, it appears clearly that nC60 are transported and diffused through the salinity gradient.
4
During this short time transportation within the salinity gradient, a clear difference on the 5
aggregation behavior is identified, compared to the classical results in bulk experiments. 6
7
Environmental implication 8
9
Based on these results and comparing to the literature concerning the environmental behavior 10
of manufactured nanomaterials, several questions raised up. Indeed, both incidental and 11
manufactured nanoparticles are expected to be released massively closed to urban system that 12
will be eventually released in the river and finally transport through the estuarine system 13
characterized by an increasing ionic strength. The expectations are that nanoparticles (NPs) 14
will settle at different rate when the ionic strength increases. In literature, physical phenomena 15
occurring in estuarine area, such as the salinity gradient and various flow conditions, were 16
never considered. But, our results suggest that a short exposition of NP such as nC60 within
17
the salinity gradient affects definitely their aggregation mechanisms, and therefore their 18
environmental behavior. Secondly, the scientific community on colloids and nanoparticles 19
agrees to the fact that an ionic strength closed to the seawater ones leads to an irreversible 20
aggregation and a change in size (up to micrometer). Our results suggest that the salinity 21
gradient could enhanced the stability of nanoparticles, especially at high ionic strength (closed 22
to the seawater one). This first study shows the need to reconsider the spatial and temporal 23
variation of abiotic parameters (ionic strength, pH, organic matter concentration) in the 24
understanding and the evaluation of nanoparticles environmental fate and transportation 1 mechanisms. 2 3 Acknowledgements 4
This work was financially supported by the Interdisciplinary Mission (MI) of the French 5
National Center for Scientific Research (CNRS; LaCUNE and LaCUNE-2 projects) and the 6
Brittany Council of France (SAD program, NANOSALT project). 7
8
Reference 9
(1) Mayer, L. M.; Wells, M. L. Aggregation of Colloids in Estuaries. In Treatise on 10
Estuarine and Coastal Science; 2012; Vol. 4, pp 143–160. 11
(2) Lasareva, E. V.; Parfenova, A. M.; Demina, T. S.; Romanova, N. D.; Belyaev, N. A.; 12
Romankevich, E. A. Transport of the Colloid Matter of Riverine Runoff through Estuaries. 13
Oceanology 2017, 57 (4), 520–529. 14
(3) Hotze, E. M.; Phenrat, T.; Lowry, G. V. Nanoparticle Aggregation: Challenges to 15
Understanding Transport and Reactivity in the Environment. J. Environ. Qual. 2010, 39 (6), 16
1909–1924. 17
(4) Yang, Y.; Nakada, N.; Nakajima, R.; Yasojima, M.; Wang, C.; Tanaka, H. PH, Ionic 18
Strength and Dissolved Organic Matter Alter Aggregation of Fullerene C60 Nanoparticles 19
Suspensions in Wastewater. J. Hazard. Mater. 2013, 244–245, 582–587. 20
(5) Chen, K. L.; Elimelech, M. Aggregation and Deposition Kinetics of Fullerene (C60) 21
Nanoparticles. Langmuir 2006, 22 (26), 10994–11001. 22
(6) Chen, K. L.; Elimelech, M. Influence of Humic Acid on the Aggregation Kinetics of 23
Fullerene (C60) Nanoparticles in Monovalent and Divalent Electrolyte Solutions. J. Colloid 24
Interface Sci. 2007, 309 (1), 126–134. 25
(7) Brant, J.; Lecoanet, H.; Wiesner, M. R. Aggregation and Deposition Characteristics of 26
Fullerene Nanoparticles in Aqueous Systems. J. Nanoparticle Res. 2005, 7 (4–5), 545–553. 27
(8) Chen, Q.; Saltiel, C.; Manickavasagam, S.; Schadler, L. S.; Siegel, R. W.; Yang, H. 28
Aggregation Behavior of Single-Walled Carbon Nanotubes in Dilute Aqueous Suspension. J. 29
Colloid Interface Sci. //, 280 (1), 91–97. 30
(9) Gigault, J.; Grassl, B.; Lespes, G. Size Characterization of the Associations between 31
Carbon Nanotubes and Humic Acids in Aqueous Media by Asymmetrical Flow Field-Flow 32
Fractionation Combined with Multi-Angle Light Scattering. Chemosphere 2012, 86 (2), 177– 33
182. 34
(10) Badawy, A. M. E.; Luxton, T. P.; Silva, R. G.; Scheckel, K. G.; Suidan, M. T.; 35
Tolaymat, T. M. Impact of Environmental Conditions (PH, Ionic Strength, and Electrolyte 36
Type) on the Surface Charge and Aggregation of Silver Nanoparticles Suspensions. Environ. 37
Sci. Technol. 2010, 44 (4), 1260–1266. 38
(11) Domingos, R. F.; Tufenkji, N.; Wilkinson, K. J. Aggregation of Titanium Dioxide 39
Nanoparticles: Role of a Fulvic Acid. Environ. Sci. Technol. //, 43 (5), 1282–1286. 40
(12) Delay, M.; Dolt, T.; Woellhaf, A.; Sembritzki, R.; Frimmel, F. H. Interactions and 41
Stability of Silver Nanoparticles in the Aqueous Phase: Influence of Natural Organic Matter 1
(NOM) and Ionic Strength. J. Chromatogr. A //, 1218 (27), 4206–4212. 2
(13) Rahman, T.; George, J.; Shipley, H. J. Transport of Aluminum Oxide Nanoparticles in 3
Saturated Sand: Effects of Ionic Strength, Flow Rate, and Nanoparticle Concentration. Sci. 4
Total Environ. 2013, 463, 565–571. 5
(14) Merschel, G.; Bau, M.; Dantas, E. L. Contrasting Impact of Organic and Inorganic 6
Nanoparticles and Colloids on the Behavior of Particle-Reactive Elements in Tropical 7
Estuaries: An Experimental Study. Geochim. Cosmochim. Acta 2017, 197, 1–13. 8
(15) Sun, C.; Chen, S.-T.; Hsiao, P.-J. Mapping the Salinity Gradient in a Microfluidic 9
Device with Schlieren Imaging. Sensors 2015, 15 (5), 11587–11600. 10
(16) Drescher, K.; Shen, Y.; Bassler, B. L.; Stone, H. A. Biofilm Streamers Cause 11
Catastrophic Disruption of Flow with Consequences for Environmental and Medical Systems. 12
Proc. Natl. Acad. Sci. 2013, 110 (11), 4345–4350. 13
(17) Dunphy Guzman, K. A.; Finnegan, M. P.; Banfield, J. F. Influence of Surface 14
Potential on Aggregation and Transport of Titania Nanoparticles. Environ. Sci. Technol. 2006, 15
40 (24), 7688–7693. 16
(18) Stocker, R.; Seymour, J. R.; Samadani, A.; Hunt, D. E.; Polz, M. F. Rapid 17
Chemotactic Response Enables Marine Bacteria to Exploit Ephemeral Microscale Nutrient 18
Patches. Proc. Natl. Acad. Sci. 2008, 105 (11), 4209–4214. 19
(19) Brant, J. A.; Labille, J.; Bottero, J.-Y.; Wiesner, M. R. Characterizing the Impact of 20
Preparation Method on Fullerene Cluster Structure and Chemistry. Langmuir 2006, 22 (8), 21
3878–3885. 22
(20) Labille, J.; Masion, A.; Ziarelli, F.; Rose, J.; Brant, J.; Villiéras, F.; Pelletier, M.; 23
Borschneck, D.; Wiesner, M. R.; Bottero, J. Y. Hydration and Dispersion of C60 in Aqueous 24
Systems: The Nature of Water-Fullerene Interactions. Langmuir 2009, 25 (19), 11232–11235. 25
(21) Gigault, J.; Budzinski, H. Selection of an Appropriate Aqueous Nano-Fullerene 26
(NC60) Preparation Protocol for Studying Its Environmental Fate and Behavior. TrAC - 27
Trends Anal. Chem. 2016, 80, 1–11. 28
(22) Duffy, D. C.; McDonald, J. C.; Schueller, O. J. A.; Whitesides, G. M. Rapid 29
Prototyping of Microfluidic Systems in Poly(Dimethylsiloxane). Anal. Chem. 1998, 70 (23), 30
4974–4984. 31
(23) Koppel, D. E. Analysis of Macromolecular Polydispersity in Intensity Correlation 32
Spectroscopy: The Method of Cumulants. J. Chem. Phys. 1972, 57 (11), 4814–4820. 33
(24) Ross Hallett, F. Particle Size Analysis by Dynamic Light Scattering. Food Res. Int. 34
1994, 27 (2), 195–198. 35
(25) Nyeo, S.-L.; Ansari, R. R. Sparse Bayesian Learning for the Laplace Transform 36
Inversion in Dynamic Light Scattering. J. Comput. Appl. Math. 2011, 235 (8), 2861–2872. 37
(26) Meng, Z.; Hashmi, S. M.; Elimelech, M. Aggregation Rate and Fractal Dimension of 38
Fullerene Nanoparticles via Simultaneous Multiangle Static and Dynamic Light Scattering 39
Measurement. J. Colloid Interface Sci. 2013, 392, 27–33. 40
(27) Tang, S.; Preece, J. M.; McFarlane, C. M.; Zhang, Z. Fractal Morphology and 41
Breakage of DLCA and RLCA Aggregates. J. Colloid Interface Sci. 2000, 221 (1), 114–123. 42