HAL Id: hal-00302050
https://hal.archives-ouvertes.fr/hal-00302050
Submitted on 7 Aug 2006HAL is a multi-disciplinary open access
archive for the deposit and dissemination of sci-entific research documents, whether they are pub-lished or not. The documents may come from teaching and research institutions in France or abroad, or from public or private research centers.
L’archive ouverte pluridisciplinaire HAL, est destinée au dépôt et à la diffusion de documents scientifiques de niveau recherche, publiés ou non, émanant des établissements d’enseignement et de recherche français ou étrangers, des laboratoires publics ou privés.
Simulating aerosol microphysics with the
ECHAM/MADE GCM ? Part II: Results from a first
multiannual integration
A. Lauer, J. Hendricks
To cite this version:
A. Lauer, J. Hendricks. Simulating aerosol microphysics with the ECHAM/MADE GCM ? Part II: Results from a first multiannual integration. Atmospheric Chemistry and Physics Discussions, European Geosciences Union, 2006, 6 (4), pp.7519-7562. �hal-00302050�
ACPD
6, 7519–7562, 2006
Simulating aerosol microphysics with
ECHAM/MADE A. Lauer and J. Hendricks
Title Page Abstract Introduction Conclusions References Tables Figures J I J I Back Close
Full Screen / Esc
Printer-friendly Version Interactive Discussion
EGU Atmos. Chem. Phys. Discuss., 6, 7519–7562, 2006
www.atmos-chem-phys-discuss.net/6/7519/2006/ © Author(s) 2006. This work is licensed
under a Creative Commons License.
Atmospheric Chemistry and Physics Discussions
Simulating aerosol microphysics with the
ECHAM/MADE GCM – Part II: Results from
a first multiannual integration
A. Lauer and J. Hendricks
DLR Institute of atmospheric physics, Oberpfaffenhofen, 82234 Wessling, Germany
Received: 12 June 2006 – Accepted: 7 July 2006 – Published: 7 August 2006 Correspondence to: A. Lauer ([email protected])
ACPD
6, 7519–7562, 2006
Simulating aerosol microphysics with
ECHAM/MADE A. Lauer and J. Hendricks
Title Page Abstract Introduction Conclusions References Tables Figures J I J I Back Close
Full Screen / Esc
Printer-friendly Version Interactive Discussion
EGU
Abstract
First results of a multiannual integration with the new global aerosol model system ECHAM4/MADE are presented. This model system enables explicit simulations of the particle number concentration and size-distribution, which is a fundamental inno-vation compared to previous global model studies considering aerosol mass cycles 5
only. The data calculated by the model provide detailed insights into the properties of the global submicrometer aerosol regarding global burden, chemical composition, atmospheric lifetime, particle number concentration and aerosol size-distribution. The model takes into account sulfate (SO4), nitrate (NO3), ammonium (NH4), black carbon (BC), organic matter (OM), mineral dust, sea salt and aerosol water. The simulated 10
climatological annual mean global atmospheric burdens (lifetime) of the dominant sub-micrometer aerosol components are 2.25 Tg (4.5 d) for SO4, 0.46 Tg (4.5 d) for NH4, 0.26 Tg (5.6 d) for BC, and 1.77 Tg (6.5 d) for OM. The contributions of individual pro-cesses such as emission, nucleation, condensation or dry and wet deposition to the global sources and sinks of a specific aerosol component and particle number concen-15
tration are quantified. Based on this analysis, the significance of aerosol dynamical processes (nucleation, condensation, coagulation) is evaluated by comparison to the importance of other processes relevant for the submicrometer aerosol on the global scale. The results reveal that aerosol dynamics are essential for the simulation of the particle number concentration and important but not vital for the simulation of particle 20
mass concentration. Hence aerosol dynamics should be taken into account in simula-tions of atmospheric processes showing a significant dependence on aerosol particle number concentration.
1 Introduction
Aerosols are known to play an important role not only in many atmospheric processes, 25
ACPD
6, 7519–7562, 2006
Simulating aerosol microphysics with
ECHAM/MADE A. Lauer and J. Hendricks
Title Page Abstract Introduction Conclusions References Tables Figures J I J I Back Close
Full Screen / Esc
Printer-friendly Version Interactive Discussion
EGU public health. Absorption and scattering of solar radiation by aerosols (direct effect) as
well as aerosol impacts on cloud formation and cloud microphysical properties (indirect effect) are important aspects concerning the Earth’s climate, in particular when predict-ing future climate change. In addition, aerosols are involved in atmospheric chemistry, e.g. by providing surface area for heterogeneous reactions. Recently, aerosols re-5
ceived increasing attention in environmental policy since the directive 1999/30/EC of the European Council now obliges limit values for particulate matter in ambient air. Because of the high spatial and temporal variability of aerosols, solely measurements are not sufficient to assess climatological average properties of the aerosol over the whole globe, which are needed to address global climate impact and health effects 10
of particulate matter. Thus, the assistance of validated global models including de-tailed representations of atmospheric aerosols is needed to make further progress in understanding the global aerosol cycles and the global impact of particulate matter. Most current global climate models include aerosols in the form of prescribed clima-tologies or treat aerosol mass only (e.g.Roeckner et al.,1996,2003; Feichter et al., 15
1996;Lohmann et al.,1999a; Adams et al.,1999). Important aspects such as parti-cle size and partiparti-cle number concentration have to be obtained diagnostically in such models. The high computing power of current super computers allows for a more de-tailed representation of aerosols not only in global transport models (e.g. Spracklen et al.,2005a,b) but also in general circulation models (e.g. Stier et al.,2005) and en-20
abled the successful coupling of the general circulation model ECHAM4 (Roeckner et al.,1996) and the modal aerosol dynamics module MADE (Lauer et al., 2005). The new model system ECHAM4/MADE is able to calculate particle number concentration and the aerosol size-distribution explicitly in addition to the mass concentrations of the aerosol components sulfate (SO4), ammonium (NH4), nitrate (NO3), black carbon 25
(BC), organic matter (OM), sea salt, mineral dust and aerosol liquid water (H2O). In the present study, a so-called time slice experiment has been performed to obtain new in-sights into the properties of the global submicrometer aerosol. Averaging all 10 model years calculated, climatological properties of the global aerosol, representative for the
ACPD
6, 7519–7562, 2006
Simulating aerosol microphysics with
ECHAM/MADE A. Lauer and J. Hendricks
Title Page Abstract Introduction Conclusions References Tables Figures J I J I Back Close
Full Screen / Esc
Printer-friendly Version Interactive Discussion
EGU beginning 1990s, are obtained. Besides the characterization of the global
submicrom-eter aerosol, the simulations are used to assess the roles of individual processes such as emission or deposition. In particular aerosol dynamical processes (nucleation, con-densation, coagulation) acting on the aerosol size-distribution through changing the aerosol mass or particle number concentration are investigated. This analysis allows 5
a quantitative assessment of the specific role of aerosol dynamics newly included in the model system for the simulation of submicrometer particles on the global scale. Previous investigations of the contribution of individual sources and sinks to the global aerosol budget (e.g.Adams and Seinfeld, 2002; Stier et al., 2005) are upgraded by taking into account particle mass concentration, particle number concentration, and, in 10
particular, different size-ranges (modes).
Section2gives a brief overview of the model system and model configuration used in this study. The characteristics of the global aerosol regarding particle mass concen-trations, particle composition, atmospheric lifetime and global burden, particle number concentration, and size-distribution are presented in Sect.3. The role of aerosol dy-15
namics for the global simulation of particle mass concentration and particle number concentration is discussed in Sect.4. The main conclusions of this study are summa-rized in Sect.5.
2 Model description
The coupled model system ECHAM4/MADE consists of two main components: the 20
general circulation model (GCM) ECHAM4 and the modal aerosol dynamics model MADE. Each part will be described briefly in the following. Details on the model and techniques used can be found inLauer et al. (2005) and the references therein. For a detailed evaluation of ECHAM4/MADE and comparison of modeled mass concen-trations of multiple aerosol components, particle number concenconcen-trations, and size-25
distributions with observations, we also refer to the first part of this study (Lauer et al.,2005).
ACPD
6, 7519–7562, 2006
Simulating aerosol microphysics with
ECHAM/MADE A. Lauer and J. Hendricks
Title Page Abstract Introduction Conclusions References Tables Figures J I J I Back Close
Full Screen / Esc
Printer-friendly Version Interactive Discussion
EGU 2.1 The ECHAM4 GCM
The ECHAM4 GCM (Roeckner et al., 1996) is a spectral model. The horizontal res-olution applied in this study is T30, which corresponds to a Gaussian grid of about 3.75◦×3.75◦ (longitude by latitude). The model physics are based on the primitive equations. Basic prognostic variables are vorticity, divergence, temperature, logarithm 5
of the surface pressure and the mass mixing ratios of water vapor, cloud water, and optional tracers. The atmosphere is divided into 19 vertical layers ranging from the surface up to 10 hPa (≈30 km). A hybrid σ-p coordinate system is used for vertical dis-cretization. The physical equations are integrated in time using a semi-implicit leap frog scheme. The time step used is 30 min. ECHAM4 uses a semi-Lagrangian advection 10
scheme (Rasch and Williamson, 1990). The ECHAM4 version applied in this study includes two major upgrades of the standard version: upgraded cloud microphysics (Lohmann et al.,1999a) and an aerosol module describing the mass concentrations of several aerosol species (Feichter et al.,1996;Lohmann et al.,1999a). In order to be consistent withLauer et al.(2005), this aerosol module is used to drive the cloud and 15
the radiation schemes of the GCM. MADE has been run in passive mode, neglecting feedbacks from the aerosol calculated by MADE to the model dynamics. For a more detailed description and motivation of this model set up, we refer to the first part of this study (Lauer et al.,2005).
2.2 Aerosol dynamics model MADE 20
The modal aerosol dynamics model MADE (Ackermann et al., 1998) describes the aerosol size-distribution by the sum of three log-normally distributed modes: the Aitken (typically smaller than 0.07 µm), accumulation (about 0.07 µm to 1 µm) and coarse mode (particles larger than 1 µm). As this study focuses on the submicrometer aerosol, coarse particles are not considered to reduce the computational burden of the model. 25
This is justified by the typically rather little interaction between fine and coarse parti-cle size-ranges (Whitby,1978). Coarse particles are mostly produced by mechanical
ACPD
6, 7519–7562, 2006
Simulating aerosol microphysics with
ECHAM/MADE A. Lauer and J. Hendricks
Title Page Abstract Introduction Conclusions References Tables Figures J I J I Back Close
Full Screen / Esc
Printer-friendly Version Interactive Discussion
EGU processes, whereas fine particles are usually produced by combustion, condensation,
or nucleation processes. Hence, the sources of fine and coarse particles are gen-erally well speparated. This counteracts the interaction between these size modes. Furthermore, the time scale of transferring mass from fine to coarse mode by coagu-lation is typically in the order of weeks whereas the usual lifetime of fine particles is 5
only in the order of days. Thus there is only a weak exchange between both size-ranges. Hence the coarse mode can be omitted without losing much accuracy when focusing on submicrometer particles. Nevertheless, the coarse mode can be easily switched on to allow, for instance, the calculation of aerosol optical properties. All par-ticles are assumed to be internally mixed (seeLauer et al.,2005 for a discussion of 10
this assumption). Aerosol components considered are SO4, NH4, NO3, BC, OM, sea salt, mineral dust and aerosol liquid water. In addition to the mass concentration of the individual aerosol components, also particle number concentration and the median particle diameter of each mode are calculated explicitly, taking into account emission of primary particles, nucleation and condensation of sulphuric acid vapor, coagulation, 15
size-dependent wet and dry deposition, aerosol chemistry, gas/aerosol partitioning and cloud processing. To reduce numerical expenses, the standard deviations of the modes are kept constant in this MADE version (σ=1.7 for the Aitken mode and σ=2.0 for the accumulation mode).
3 Characteristics of the global aerosol
20
Results obtained from a 10-year integration with the new model system ECHAM4/MADE provide a detailed picture of the global distribution and physical and chemical characteristics of atmospheric submicrometer particles. In addition to chemi-cal composition, aerosol number concentration and size-distribution are explicitely chemi- cal-culated. Furthermore, mass concentration, global burden and average lifetime of each 25
aerosol component are computed for the two size-ranges Aitken and accumulation mode.
ACPD
6, 7519–7562, 2006
Simulating aerosol microphysics with
ECHAM/MADE A. Lauer and J. Hendricks
Title Page Abstract Introduction Conclusions References Tables Figures J I J I Back Close
Full Screen / Esc
Printer-friendly Version Interactive Discussion
EGU For the present study, the GCM has been run in quasi-equilibrium mode with sea
sur-face temperatures (SST), greenhouse gas concentrations and other boundary condi-tions prescribed according to measurements taken around the year 1990. (Such kind of simulation is usually called “1990 time slice-experiment”). The 10 years analyzed here were preceded by a 4-year spin-up period, which has been discarded. The ma-5
jority of the emission data used for characteristic global aerosol precursor and primary particle emissions are representative for the mid 1980s to early 1990s. Details and references on the emission data and the size-distributions used for the emissions of primary particles are given inLauer et al.(2005).
3.1 Particle mass concentration 10
Global distributions of particle mass concentrations have been simulated in numer-ous previnumer-ous GCM studies (e.g. Feichter et al., 1996; Adams et al., 1999; Chin et al.,2000;Takemura et al., 2000; Chung and Seinfeld,2002). As particle mass con-centrations are closely related to particle number concentration and size-distribution, we will also present particle mass concentrations of selected species simulated with 15
ECHAM4/MADE to provide a complete picture of the characteristics of the global sub-micrometer aerosol. Figures 1–4 show the climatological annual means of the near surface mass concentrations of selected species as well as corresponding zonal mean vertical cross sections obtained from the 10-year integration. Results obtained for both individual submicrometer modes are presented. In order to facilitate the analysis of the 20
altitudinal variation, all aerosol mass concentrations presented in this section are trans-formed to standard temperature and pressure (STP) conditions, i.e. 273 K, 1013 hPa. Sulfate
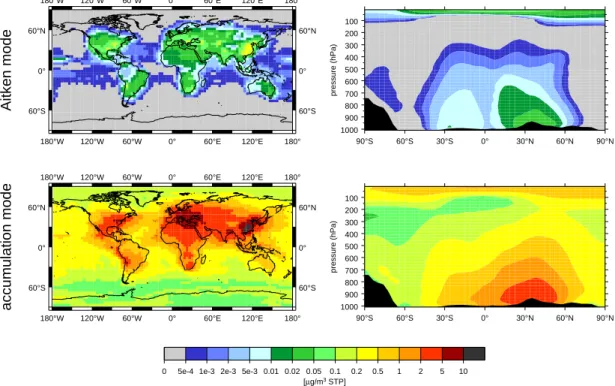
Figure1shows the global distributions of the annual mean sulfate mass concentrations of the Aitken and accumulation mode in the lowest model layer and corresponding 25
ACPD
6, 7519–7562, 2006
Simulating aerosol microphysics with
ECHAM/MADE A. Lauer and J. Hendricks
Title Page Abstract Introduction Conclusions References Tables Figures J I J I Back Close
Full Screen / Esc
Printer-friendly Version Interactive Discussion
EGU the accumulation mode, whereas the Aitken mode has only a small contribution.
The geographical distribution shows sulfate maxima in Central Europe, the eastern United States, and Southeast Asia. These regions correspond with areas of high SO2 emissions from fossil fuel combustion. In contrast to, for instance, BC, sulfate is a sec-ondary aerosol, i.e. almost no sulfate is emitted by the sources directly, but results from 5
gaseous precursors which are transformed to SO4 by chemical reactions. Thus, the maxima in the geographical distribution have a larger extent as in the case of primary aerosols (e.g. Fig.2). Elevated sulfate levels found at the west coast of South America are mainly caused by enhanced SO2 emissions due to volcanic activity. Here, simu-lated SO4mass concentrations range between 2 and 5 µg/m3, whereas peak concen-10
trations found in the eastern US or Central Europe lie in between 5 and 10 µg/m3. The highest concentrations exceeding 10 µg/m3 occur in Southeast Asia. Outside these areas of elevated SO4concentrations, typical continental sulfate concentrations range between 0.2 and 2 µg/m3. Over the tropical oceans SO4 ranges between 0.2 and 1 µg/m3. The average annual mean concentration stays below 0.2 µg/m3in all other 15
parts of the world. Overall, the basic characteristics of the patterns of the geographical SO4distribution follow the distribution of the SO2emissions. These basic characteris-tics of the geographical distribution of total SO4mass (sum of Aitken and accumulation mode) obtained in our simulations are similar to the results of other model simulations (e.g. Feichter et al., 1996; Adams et al., 1999; Takemura et al., 2000). Compared 20
to measurements, ECHAM4/MADE reproduces the SO4 concentrations reasonably well. However, sulfate mass is overestimated compared to measurements for Euro-pean summer conditions (seeLauer et al.,2005for details).
As a direct result of the smaller average lifetime of Aitken particles compared to accu-mulation mode particles, the pattern of the Aitken mode is spread out less around the 25
areas of maximum emissions than the one of the accumulation mode. (For a detailed analysis of the efficiency of the major sinks of sulfate in the different modes, we refer to Sect.4.2.)
ACPD
6, 7519–7562, 2006
Simulating aerosol microphysics with
ECHAM/MADE A. Lauer and J. Hendricks
Title Page Abstract Introduction Conclusions References Tables Figures J I J I Back Close
Full Screen / Esc
Printer-friendly Version Interactive Discussion
EGU in the boundary layer of the northern hemisphere between 20◦N and 50◦N (Central
Europe, USA, and Asia). With increasing height, the SO4 mass concentrations de-crease. This results from sink processes, in particular wet deposition, which com-pensate the source processes for sulfate (gas and liquid phase production of SO4) at higher altitudes. The tropopause region shows no enhanced SO4mass concentrations, 5
although strong nucleation of the binary system H2SO4–H2O takes place in these alti-tudes (Sect.3.4). The newly formed particles tend to remain small on average due to the limited availability of SO4precursors.
Black carbon
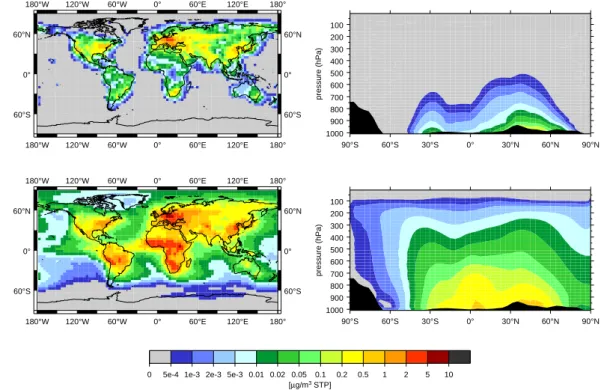
In contrast to the geographical distribution of sulfate, the annual mean black carbon 10
mass concentration does not only show maxima in Central Europe, the eastern United States and Southeast Asia, but also in central parts of South America and southern Africa (Fig.2). The maxima in the northern Hemisphere are mainly due to fossil fuel combustion, whereas enhanced BC concentrations in South America and southern Africa are caused by biomass burning activities. The total BC mass concentrations 15
(sum of Aitken and accumulation mode) simulated for continental areas with high emis-sions typically range between 1 and 5 µg/m3. The eastern part of Central Europe shows BC mass concentrations up to 8 µg/m3. Above most parts of the continental areas, the BC concentrations in the boundary layer range between 0.2 and 1 µg/m3. The lowest BC mass concentrations are found above the Pacific Ocean and south of 20
60◦S due to the large distance to the source regions. As for sulfate, the geographical distribution of BC in the Aitken mode reveals a less distinctive long-range transport than the accumulation mode. As in the case of sulfate, this is due to the shorter av-erage lifetime of Aitken mode particles compared to particles in the size-range of the accumulation mode. (For a detailed analysis of the efficiency of the major sinks of BC 25
in the different modes, we refer to Sect. 4.3.) The geographical distribution as well as absolute values of the total BC mass concentration simulated by ECHAM4/MADE are within the range spanned by the results of other model studies (e.g. Chung and
ACPD
6, 7519–7562, 2006
Simulating aerosol microphysics with
ECHAM/MADE A. Lauer and J. Hendricks
Title Page Abstract Introduction Conclusions References Tables Figures J I J I Back Close
Full Screen / Esc
Printer-friendly Version Interactive Discussion
EGU Seinfeld,2002;Cook et al.,2002;Jacobson,2002). Nevertheless, the absolute values
simulated by ECHAM4/MADE tend to be at the upper end of this range. Comparisons of measured BC mass concentrations with the ECHAM4/MADE results reveal that the model tends to overestimate BC by a factor of about 2–3 in regions of high emissions. This is mainly caused by the relatively high emission rates (mid 1980s) considered in 5
the model. For further details of the comparison we refer toLauer et al.(2005).
The zonal mean cross sections also shown in Fig.2 reveal that the highest accumu-lation mode BC concentrations are simulated for the lowermost boundary layer at the northern mid-latitudes (resulting in particular from European emissions) and near the equator (mainly caused by emissions in Central Africa). Due to tropical convection, 10
accumulation mode BC particles emitted near the equator can reach higher altitudes than particles emitted at mid-latitudes. The BC mass concentration decreases with increasing height and with increasing distance to the source regions. Aitken mode BC shows maximum concentrations near the surface at northern mid-latitudes, but not in the tropical latitudes. This is a consequence of assuming different size-distributions of 15
BC particles emitted by fossil fuel combustion in the mid-latitudes and biomass burn-ing in the tropics. Fossil fuel combustion results in a much larger fraction of primary BC particles emitted in the size-range of the Aitken mode than biomass burning (for details, seeLauer et al., 2005). Due to the relatively short average lifetime of Aitken mode particles, the Aitken mode mass concentration decreases more rapidly with in-20
creasing distance to the source regions at the surface than the accumulation mode mass concentration.
Mineral dust
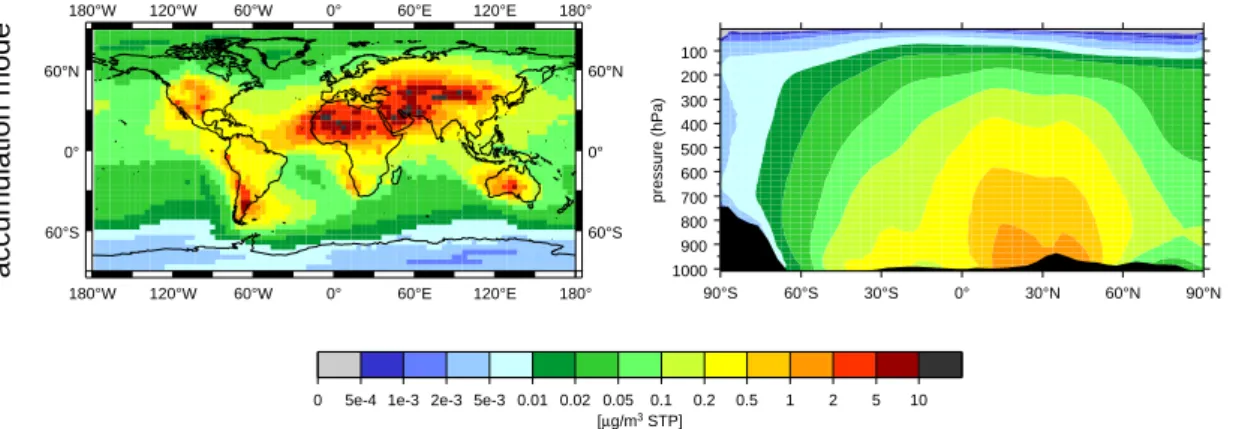
Currently, the submicrometer fraction of mineral dust in ECHAM4/MADE is represented by the accumulation mode only. As discussed in Sect. 2.2, the coarse fraction has 25
not been taken into account to reduce the overall computational burden of the model. The interaction between coarse and submicrometer particles is rather weak due to the different source types and time scales involved. This allows to omit the coarse mode
ACPD
6, 7519–7562, 2006
Simulating aerosol microphysics with
ECHAM/MADE A. Lauer and J. Hendricks
Title Page Abstract Introduction Conclusions References Tables Figures J I J I Back Close
Full Screen / Esc
Printer-friendly Version Interactive Discussion
EGU when focusing on the submicron aerosol fraction without loosing significant accuracy
(Whitby,1978). However, since most of the total mass of mineral dust is associated with particles in the size-range of the coarse mode, the omission of these particles complicates a reasonable comparison with results of other model studies simulating mineral dust. (For a comparison of the total atmospheric burden of submicrometer 5
dust simulated here and in another study, see Sect.3.3).
The main source regions for mineral dust are the Sahara (North Africa), Arabian deserts (Arabian Peninsula and Asia), Gobi (Asia), the Great Victoria Desert (Australia) and the Atacama (South America). In addition, mineral dust is also emitted above the Great Plains in the western United States. As shown in Fig.3, typical annual mean 10
accumulation mode mass concentrations simulated for these source regions range be-tween 2 and 10 µg/m3 and can even be higher locally (e.g. over Sahara and Gobi). The modeled accumulation mode mineral dust concentrations stay below 0.5 µg/m3 above the residual continental areas and mostly below 0.1 µg/m3 above the oceans. However, in the trade wind zone between 0◦ and about 30◦N, mineral dust is trans-15
ported from the continental sources regions (in particular North Africa) far out on the Ocean. This long-range transport benefits from the long average lifetime of mineral dust compared to other aerosol components (see Sect.3.3).
The vertical cross section of simulated accumulation mode mineral dust concentrations shows maxima in the boundary layer around 30◦N, where the major source regions are 20
located. As mineral dust is emitted at the surface only, mass concentrations decrease with increasing height. South of 75◦S, the simulated mineral dust concentration does not exceed 0.01 µg/m3at all heights. This is a result of the, on climatological average, weak airmass exchange of the southern polar zone with the circumventing atmosphere, preventing mineral dust particles from being transported into these latitudes.
25
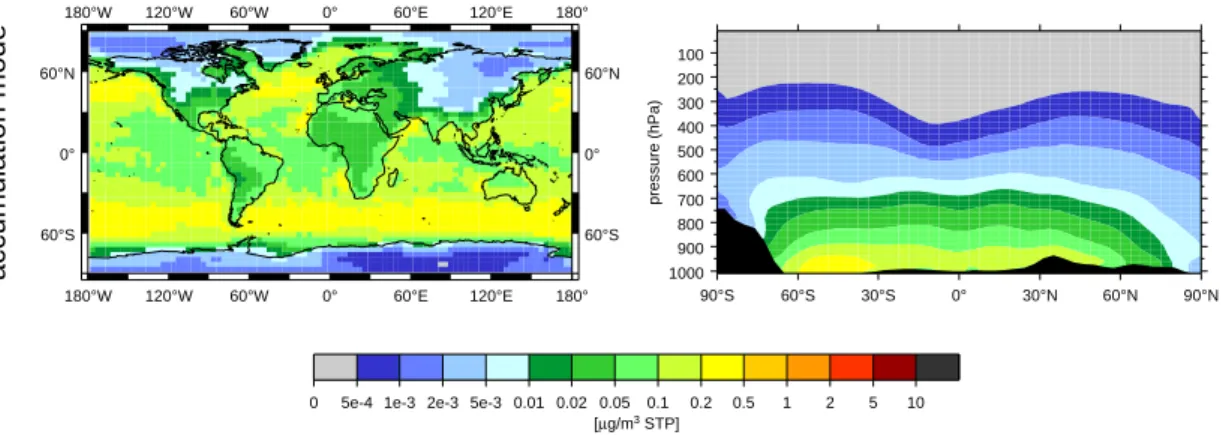
Sea salt
As discussed for mineral dust and in Sect. 2.2, the coarse particle mode is not con-sidered in the present study. Therefore only sea salt particles in the size-range of
ACPD
6, 7519–7562, 2006
Simulating aerosol microphysics with
ECHAM/MADE A. Lauer and J. Hendricks
Title Page Abstract Introduction Conclusions References Tables Figures J I J I Back Close
Full Screen / Esc
Printer-friendly Version Interactive Discussion
EGU the accumulation mode are taken into account. Maximum accumulation mode sea salt
concentrations are simulated for the marine boundary layer of the mid-latitudes (Fig.4). Typical mass concentrations range between 0.2 and 0.5 µg/m3 in these regions and amount to about 0.1 µg/m3 above the sea surface at other latitudes. The continental mass concentrations are very small. In the boundary layer over Europe, South Amer-5
ica, Africa and Australia sea salt amounts to about 0.05 µg/m3. Above large areas of North America, Asia and the polar regions the mass concentrations stay even below 0.01 µg/m3.
Inspecting the modeled vertical distribution of sea salt, the highest mass concentrations are found in the boundary layer of the main source regions, in particular between 30◦S 10
and 60◦S. The sea salt mass concentration decreases rapidly with height. This is a direct consequence of the hygroscopicity and the large diameters of the primary sea salt particles emitted, facilitating a very effective removal by wet deposition.
3.2 Particle composition
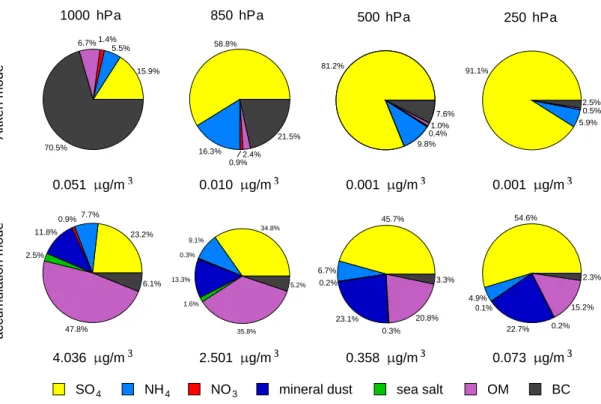
Figure5 shows the climatological global average (dry) particle composition of submi-15
crometer aerosols obtained from the 10-year model simulation with ECHAM4/MADE on four different model levels (≈1000 hPa, 850 hPa, 500 hPa and 250 hPa). In the low-ermost boundary layer (1000 hPa), particle mass in the size-range of the accumulation mode is dominated by organic matter (48%), followed by sulfate (23%), mineral dust (12%), ammonium (8%), black carbon (6%), sea salt (3%), and nitrate (1%). The aver-20
age composition of the accumulation mode particles in the lowermost boundary layer shows, that the surface emissions play a dominant role determining the particles main components, as the composition of the emissions of particulate matter is similar to the composition of the accumulation mode particles in this layer. The average mass con-centration of accumulation mode particles decreases from 4 µg/m3 in the lowermost 25
level to 73 ng/m3 (ambient concentrations, i.e. not STP) at 250 hPa. The sulfate frac-tion increases with height to about 55% at 250 hPa. This is a consequence of sulfate gain due to gas phase oxidation of SO2followed by condensation of the sulphuric acid
ACPD
6, 7519–7562, 2006
Simulating aerosol microphysics with
ECHAM/MADE A. Lauer and J. Hendricks
Title Page Abstract Introduction Conclusions References Tables Figures J I J I Back Close
Full Screen / Esc
Printer-friendly Version Interactive Discussion
EGU vapor formed and in-cloud production of SO4throughout the atmosphere, whereas the
other main components are emitted at the surface only. The increasing sulfate fraction corresponds with increasing acidity of the aerosol.
Also the average composition of Aitken mode particles in the lowermost boundary layer is controlled by the emissions at the surface. Here, the composition is dominated by 5
black carbon (70.5%), followed by sulfate (15.9%), organic matter (6.7%), ammonium (5.5%), and nitrate (1.4%). The very high fraction of BC is caused by fossil fuel com-bustion. It is assumed that particles emitted by fossil fuel combustion mostly have sizes in the range of the Aitken mode (for details and references seeLauer et al.,2005). As for accumulation mode particles, the sulfate fraction increases with height as a conse-10
quence of sulfate production due to oxidation of SO2 and other precursors. As in the case of the accumulation mode, this results in an increasing acidity of the aerosol. The average total mass concentration of Aitken mode particles decreases from 51 ng/m3 at 1000 hPa to 1 ng/m3 (ambient concentrations) at 250 hPa. The contribution of the Aitken mode to the total mass of submicrometer particles decreases from 1.2% in the 15
boundary layer to about 0.1% in the tropopause region. 3.3 Atmospheric lifetime and global burden
The average atmospheric lifetime of each aerosol component can easily be estimated from Eq. (1) assuming steady state of sources and sinks:
lifetime [days]= number of days per year
P sources [Tg/yr] × burden [Tg] (1)
20
The main component of submicrometer aerosols is sulfate with an average burden of 2.25 Tg, followed by organic matter (1.77 Tg), mineral dust (0.83 Tg), ammonium (0.46 Tg), and black carbon (0.26 Tg) (Table1). Sea salt (0.08 Tg) and nitrate (0.02 Tg) are only of minor importance for the average global burden of submicrometer parti-cles. The simulated burdens are within the range of other model studies, for SO4: 25
ACPD
6, 7519–7562, 2006
Simulating aerosol microphysics with
ECHAM/MADE A. Lauer and J. Hendricks
Title Page Abstract Introduction Conclusions References Tables Figures J I J I Back Close
Full Screen / Esc
Printer-friendly Version Interactive Discussion
EGU 2000), 1.71 Tg (Feichter et al.,1996), 3.09 Tg (Lohmann et al., 1999b), 2.4 Tg (Stier
et al., 2005); for BC: 0.22 Tg (Chung and Seinfeld, 2002), 0.28 Tg (Cooke and Wil-son,1996), 0.26 Tg (Lohmann et al.,1999a), 0.11 Tg (Stier et al.,2005); and for OM: 1.39 Tg (Chung and Seinfeld, 2002), 1.87 Tg (Lohmann et al., 1999a), 0.99 Tg (Stier et al.,2005). Adams et al. (1999) simulated burdens of 0.39 Tg for NH4 and 0.13 Tg 5
for NO3. For the aerosol components mineral dust and sea salt, most of the mass is associated with coarse particles, which are not included in this model study. Thus, it is not reasonable to compare the atmospheric burden of the submicron fraction of these two components with the total burdens simulated in other model studies. However, for mineral dust Tegen and Lacis (1996) give size-dependent mass loadings, which 10
amount to 0.2 mg/m2for the radius range 0.1–0.18 µm, 1.5 mg/m2for the radius range 0.18–0.3 µm, and 4.2 mg/m2 for the radius range 0.3–0.6 µm. These mass loadings correspond to global burdens of 0.10 Tg, 0.77 Tg, and 2.14 Tg respectively. Accord-ing to the size of the mineral particles emitted in ECHAM4/MADE (d=0.14 µm), only the two smallest size-ranges reported byTegen and Lacis(1996) seem appropriate for 15
comparison. Summing up these two size intervals of particles smaller than 0.6 µm in diameter gives a burden of 0.87 Tg. This value compares well to the ECHAM4/MADE burden for accumulation mode mineral dust amounting to 0.83 Tg. However, large un-certainties are introduced since the burden is dominated by large particles accounting for most of the mass.
20
Mineral dust has the longest lifetime of all aerosol components in the accumulation mode (18 d), followed by accumulation mode black carbon (8.9 d), organic matter (6.6 d) and sulfate, ammonium, and nitrate (4.6–5.2 d) (Table 1). The longer lifetime of mineral dust, BC, and OM is caused by the reduced scavenging efficiency of these particles by cloud droplets due to partly hydrophobic properties (for details, seeLauer 25
et al.,2005). On average, the atmospheric lifetime of Aitken mode particles is shorter than of accumulation mode particles. It amounts to around 0.5 d for Aitken mode NH4, NO3, BC and OM and about 1.7 d for Aitken mode SO4. This reduced lifetime is caused by additional sinks such as intermodal coagulation or growth of Aitken particles into
ACPD
6, 7519–7562, 2006
Simulating aerosol microphysics with
ECHAM/MADE A. Lauer and J. Hendricks
Title Page Abstract Introduction Conclusions References Tables Figures J I J I Back Close
Full Screen / Esc
Printer-friendly Version Interactive Discussion
EGU the size-range of the accumulation mode as well as a very effective dry deposition of
Aitken mode particles. The average lifetime of the total particle mass (sum of Aitken and accumulation mode) simulated by ECHAM4/MADE is also in the range of other model studies. For SO4, the average lifetime (here 4.5 d) calculated by previous stud-ies amounts to: 6.5 d (Adams and Seinfeld,2002), 4.3 d (Feichter et al.,1996), 3.9 d 5
(Stier et al., 2005); for total BC (here 5.6 d): 6.4 d (Chung and Seinfeld, 2002), 6– 10 d (Cooke and Wilson,1996), 4–4.5 d (Liousse et al.,1996), 6.8 d (Lohmann et al., 1999a), 5.4 d (Stier et al.,2005); and for OM (here 6.5 d): 5.3 d (Chung and Seinfeld, 2002), 5.1 d (Lohmann et al.,1999a), 5.4 d (Stier et al.,2005).
3.4 Particle number concentration 10
In contrast to most current climate models, ECHAM4/MADE calculates particle number concentration and particle size-distribution explicitly. This allows a more detailed view on the global aerosol characteristics than provided by previous studies, in which par-ticle number concentration had to be calculated diagnostically using prescribed size-distributions.
15
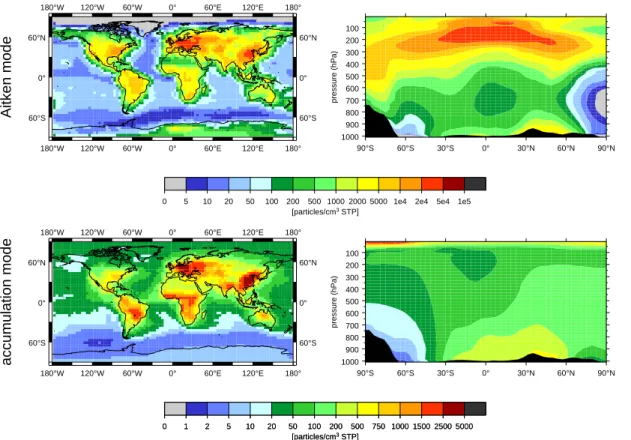
Figure 6 shows the climatological annual mean particle number concentration simu-lated for the two size-ranges Aitken and accumulation mode. The geographical dis-tribution in the boundary layer follows the emission-pattern of primary particles and particle precursors (SO2) at the surface, resulting in regions of high particle number concentrations due to fossil fuel combustion (Central Europe, Southeast Asia, eastern 20
USA) and due to biomass burning (Central Africa, South America).
The main sources of primary particles are usually found above the continents. These include emissions of BC and OM by industry, traffic, burning of domestic fuel and biomass burning as well as emission of mineral dust above the continental deserts. In contrast, sea salt particles are the only important primary particles emitted above 25
the oceans (not taking into account emissions from international shipping). Neverthe-less, due to its large particle sizes, sea salt shows comparatively small particle number concentrations.
ACPD
6, 7519–7562, 2006
Simulating aerosol microphysics with
ECHAM/MADE A. Lauer and J. Hendricks
Title Page Abstract Introduction Conclusions References Tables Figures J I J I Back Close
Full Screen / Esc
Printer-friendly Version Interactive Discussion
EGU The highest particle number concentrations in the Aitken mode are simulated for
Cen-tral Europe, Southeast Asia and the eastern United States. Here, typical annual mean number concentrations of Aitken mode particles are between 10 000 and 50 000 par-ticles per cm3. Above the central regions of North and South America, typical annual mean particle number concentrations between 2000 and 5000 cm−3are simulated. The 5
lowest particle numbers in the Aitken mode are obtained above the oceans, far away from any strong source of primary particles. Here, particle composition is dominated by sea salt and typical annual mean number concentrations do not exceed 100 parti-cles per cm3. The vertical structure of the Aitken mode particle number concentration simulated for latitudes north of 30◦S shows decreasing concentrations from the sur-10
face up to about 700 to 600 hPa, where the minimum particle number concentrations are reached. This reduction of particle number is mainly caused by coagulation (par-ticularly intermodal coagulation), which is much more effective than wet deposition of Aitken mode particles. The formation of new particles by nucleation is very weak in this altitude range, resulting in a net depletion of particles. There are no significant sources 15
of primary particles at the surface south of 30◦S. This results in very low number con-centrations of Aitken mode particles in this region in the lower troposphere. Above 600 hPa, particle number concentrations increase rapidly with altitude at all latitudes. Maximum particle numbers are found in the tropopause region, where zonally aver-aged annual mean concentrations range between 20 000 and 50 000 particles per cm3 20
(STP). This strong increase in particle number concentration is caused by nucleation of sulphuric acid vapor. The low ambient temperatures and the low aerosol surface area available for condensation (which competes with nucleation for the condensable gas) favors efficient nucleation. This basic vertical structure of the mean number concen-tration of small particles, showing highest number concenconcen-trations in the tropopause 25
region and only small number concentrations near the surface, is also supported by other recent model studies (e.g.Stier et al.,2005) and measurements (e.g.Clarke and Kapustin,2002).
ACPD
6, 7519–7562, 2006
Simulating aerosol microphysics with
ECHAM/MADE A. Lauer and J. Hendricks
Title Page Abstract Introduction Conclusions References Tables Figures J I J I Back Close
Full Screen / Esc
Printer-friendly Version Interactive Discussion
EGU emission of primary particles at the surface (see Sect.4.1). Thus, the highest annual
mean number concentrations of particles in the accumulation mode are simulated for the areas around the continental source regions of primary particles in Central Europe, Southeast Asia, the eastern United States and central regions of South America and Africa. Typical values of 1000 to 2500 cm−3are simulated for these regions. In Central 5
Europe and Southeast Asia the concentrations even exceed 2500 cm−3. The simula-tions reveal that emissions of BC and OM by fossil fuel combustion are the dominant sources in the highly industrialized countries of the northern hemisphere. Emissions of BC and OM by biomass burning are dominant in South America and Africa. Because of their large sizes, mineral dust and sea salt particles are of minor importance for par-10
ticle number concentration, even though they might contribute significantly to the total particle mass. For other continental regions, typical annual mean near-surface parti-cle number concentrations around 100 to 500 cm−3 are simulated. Above the oceans in the northern hemisphere, the simulation shows typical particle numbers of about 20 cm−3. These concentrations are slightly larger above the oceans in the southern 15
hemisphere (<20 cm−3) and Antarctica (<10 cm−3). The zonally averaged vertical pro-file shows maximum annual mean accumulation mode particle number concentrations in the boundary layer above the continents north of 30◦S. Due to weak sources at the surface, particle number concentrations are very low (below 10 cm−3) in the boundary layer south of about 45◦S. With increasing height, accumulation mode particle number 20
concentration decreases at all latitudes north of 30◦S. With the exception of a minor source resulting from Aitken mode particles growing into the accumulation mode size-range, no further sources of accumulation mode particle number exist but sources at the surface. Overall, this results in a net loss of particle number due to wet deposition and coagulation with increasing distance (height) to the surface sources.
25
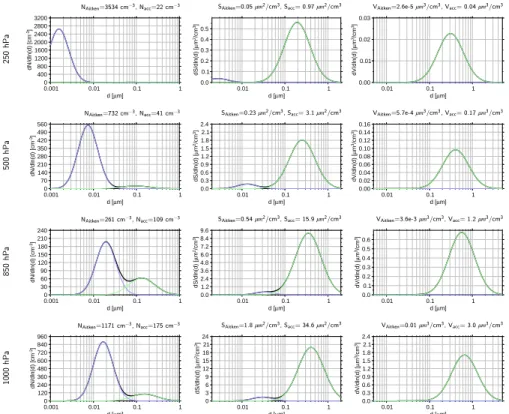
3.5 Size-distribution
Figure7shows the climatological annual mean of the globally averaged particle num-ber, dry particle surface and dry particle volume-size-distribution simulated for different
ACPD
6, 7519–7562, 2006
Simulating aerosol microphysics with
ECHAM/MADE A. Lauer and J. Hendricks
Title Page Abstract Introduction Conclusions References Tables Figures J I J I Back Close
Full Screen / Esc
Printer-friendly Version Interactive Discussion
EGU altitudes. The figure presents results obtained for the lowest model layer (≈1000 hPa),
for about 1.5 km altitude (≈850 hPa), as well as the middle (≈500 hPa) and upper tro-posphere (≈250 hPa).
Near the surface, the simulated size-distribution is strongly influenced by the prescribed size-distributions of primary particles emitted. The median diameters of the Aitken and 5
the accumulation mode are about 17 nm and 155 nm respectively. The ratio of total particle number of Aitken and accumulation mode is about 7:1. The ratio amounts to 1:19 in the case of surface area and 1:285 in the case of total volume.
Compared to the near surface conditions, the median diameter of the Aitken mode sim-ulated for 850 hPa is slightly larger (19 nm). This is caused by the growth of Aitken par-10
ticles due to intramodal coagulation and condensation of sulphuric acid vapor occurring during vertical transport from the surface to upper levels. The increase of the Aitken mode median diameter is also caused by intermodal coagulation and dry deposition which both are significant sink processes for Aitken mode particles. The efficiencies of both processes increase with decreasing particle size which results in a reduced 15
lifetime of smaller Aitken particles. Thus, the probability of larger Aitken particles to be transported upwards is higher than for smaller particles. In contrast to the Aitken mode, the average median diameter of the accumulation mode (about 134 nm) at 850 hPa is smaller compared to the 1000 hPa level. This is caused in particular by wet deposition, which removes large particles more efficiently than smaller ones. Another reason can 20
be the transformation of growing Aitken particles into the accumulation mode, which also benefits the decrease in accumulation mode median diameter. Processes such as condensation or coagulation of accumulation mode particles causing an increase of particle size, are exceeded in particular by wet deposition, resulting in an overall decrease of the modal median diameter. Due to the sink processes described, parti-25
cle number concentrations in both modes are smaller at 850 hPa than in the boundary layer (1171 cm−3 vs. 261 cm−3 in the Aitken mode and 175 cm−3 vs. 109 cm−3 in the accumulation mode). The ratio of particle numbers of Aitken and accumulation mode is 2.4:1 at 850 hPa. The corresponding ratios of total surface area and volume
concen-ACPD
6, 7519–7562, 2006
Simulating aerosol microphysics with
ECHAM/MADE A. Lauer and J. Hendricks
Title Page Abstract Introduction Conclusions References Tables Figures J I J I Back Close
Full Screen / Esc
Printer-friendly Version Interactive Discussion
EGU tration amount to 1:29 and 1:332.
In the middle troposphere (500 hPa), the average median diameter of the simulated accumulation mode amounts to only 96 nm, which is considerably smaller than the val-ues simulated for lower altitudes. An important reason for this reduction is that the efficiency of wet deposition increases with particle size. The resulting reduction in life-5
time of larger particles counteracts an efficient upward transport. Compared to the lower troposphere, the median diameter of the modeled Aitken mode is smaller, too. It amounts to only 7.5 nm at 500 hPa. Since the nucleation activity increases with altitude and the newly formed nucleation particles are very small (wet diameter 3.5 nmLauer et al.,2005), the total size-distribution of the Aitken mode is shifted towards smaller me-10
dian diameters and the Aitken particle number concentration increases. The number ratio of Aitken and accumulation mode is about 18:1. The corresponding surface and volume ratios amount to 1:14 and to 1:295, respectively.
The average median diameters of both modes further decrease with altitude in the upper troposphere (250 hPa), they amount to only 1.6 nm and 74 nm in the case of 15
the Aitken and accumulation mode, respectively. Nevertheless, particle number con-centration in the Aitken mode is larger than simulated for lower altitudes. The ratio of particle number in Aitken and accumulation mode in the upper troposphere amounts to 162:1, which is about one order of magnitude higher than in the middle troposphere. This is mainly caused by strong nucleation, which reaches its maximum activity in the 20
tropopause region. The ratio of the modal surface area concentrations of Aitken and accumulation mode amounts to 1:20 at 250 hPa. The corresponding ratio of the modal volumes is 1:1540. In case of strong nucleation, the formation of new very small par-ticles might lead to an underestimation of the median diameter of the Aitken mode compared to observations. This has been identified as a principle limitation of the bi-25
modal representation of the submicrometer aerosol as discussed inLauer et al.(2005). Thus, the modal median diameter of the Aitken mode should to be regarded rather as a lower limit than a typical value for this altitude range. Future modifications of the model towards the representation of a trimodal size distribution including separated
ACPD
6, 7519–7562, 2006
Simulating aerosol microphysics with
ECHAM/MADE A. Lauer and J. Hendricks
Title Page Abstract Introduction Conclusions References Tables Figures J I J I Back Close
Full Screen / Esc
Printer-friendly Version Interactive Discussion
EGU Aitken and nucleation modes will enable a more sufficient representation of the upper
tropospheric aerosol.
4 The role of aerosol dynamics at the global scale
To assess the relevance of aerosol dynamics (i.e., nucleation and condensation of gaseous precursors, coagulation of particles) for the simulation of submicrometer par-5
ticles at the global scale, the roles of individual sources and sinks in the mean bud-gets of different aerosol compounds and particle number are analyzed for both aerosol modes considered. The specific role of the individual processes can be easily judged from the intercomparison of the strength of the different sources and sinks. To realize this, we saved the actual concentration changes induced by each individual process 10
considered in the model. These changes can be integrated over time to calculate the total change and, hence, the corresponding contributions of the individual processes to the global budgets. This technique offers the possibility to gain new insights in the role of individual microphysical processes in the global aerosol cycles. Such detailed in-sights cannot be gained by observations alone, as measurements spanning the whole 15
globe, covering at least one full seasonal cycle, and resolving each individual process would be required to obtain balanced data on all relevant sources and sinks. Such measurements are currently not available. Hence, various model studies have ad-dressed the contribution of different sources and sinks to the global aerosol burden in the past (e.g.Feichter et al.,1996;Chin et al.,2000;Stier et al.,2005). The budgets 20
provided by these studies considered aerosol mass cycles, but do not resolve parti-cle number, size-dependencies, and aerosol dynamical processes. First steps have been done investigating sources and sinks of particle number concentration including aerosol dynamics (Adams and Seinfeld,2002). However, this study is limited to pure sulfate aerosols only. The present study addresses both aerosol mass concentrations 25
and particle number concentrations. Different particle size-ranges are analyzed sep-arately taking into account aerosol dynamical processes. Budgets of particle number
ACPD
6, 7519–7562, 2006
Simulating aerosol microphysics with
ECHAM/MADE A. Lauer and J. Hendricks
Title Page Abstract Introduction Conclusions References Tables Figures J I J I Back Close
Full Screen / Esc
Printer-friendly Version Interactive Discussion
EGU concentration as well as sulfate (secondary aerosol) and black carbon (exemplary for
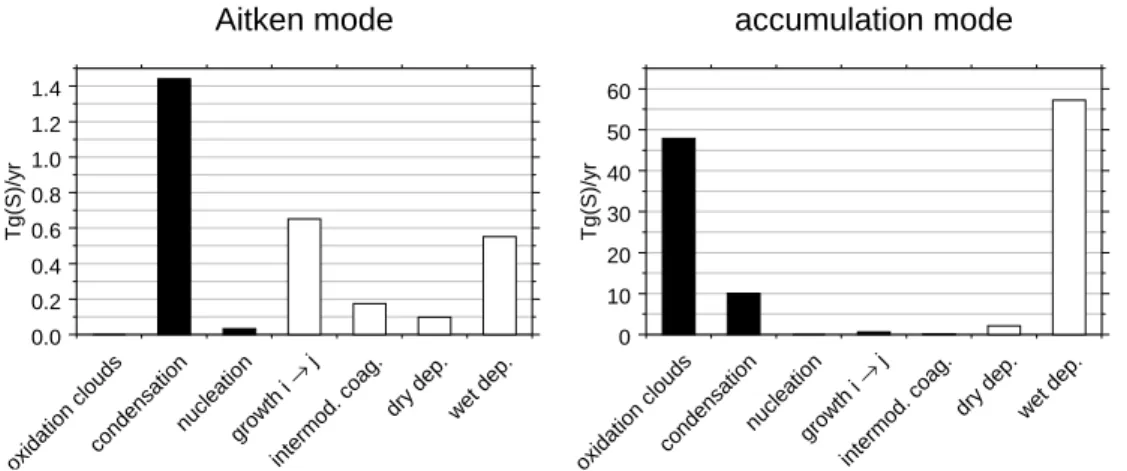
primary aerosol) mass are investigated. 4.1 Particle number
The following sinks reduce particle number concentration in the model: intramodal coagulation (coagulation of particles within the same mode), intermodal coagulation 5
(coagulation of particles from different modes; reduces Aitken mode particle number concentration here), as well as dry and wet deposition. The growth of Aitken mode particles into the size-range of the accumulation mode acts as sink of the Aitken mode particle number and as source of accumulation mode particles. The emission of pri-mary particles is a source for both modes, whereas new particle formation by nucle-10
ation of sulphuric acid vapor is a source for the Aitken mode only. Figure8depicts the global climatological annual mean column changes induced by the individual sources and sinks as calculated from the 10-year model simulation with ECHAM4/MADE. The most important source of Aitken mode particles in the simulation is the formation of new particles by nucleation of sulphuric acid vapor. However, it should be noted, 15
that comparisons with observations show, that the model tends to underestimate parti-cle sizes in the tropopause region, where the partiparti-cle formation rate due to nuparti-cleation reaches its maximum (Lauer et al.,2005). This might indicate that the newly formed particles grow too slowly or that nucleation might be overestimated at all. Nevertheless, we do expect nucleation being the most important source of new particles in the size-20
range of the Aitken mode, since the emission of primary particles at the surface does not contribute very much to the total sources. Since the Aitken mode generally domi-nates particle number concentration, nucleation should be the most important source of particle number concentration at all. This finding agrees withAdams and Seinfeld (2002), who also found that nucleation is the dominant source of particle number on 25
global annual average. In contrast, emission of primary particles is the dominating source for accumulation mode particles. In addition, also the growth of Aitken mode particles into the size-range of the accumulation mode (“growth i→j”) provides an
im-ACPD
6, 7519–7562, 2006
Simulating aerosol microphysics with
ECHAM/MADE A. Lauer and J. Hendricks
Title Page Abstract Introduction Conclusions References Tables Figures J I J I Back Close
Full Screen / Esc
Printer-friendly Version Interactive Discussion
EGU portant contribution to the global sources of accumulation mode particles. Due to the
comparatively high particle number concentration of the Aitken mode, the correspond-ing contribution to the sinks of Aitken mode particle number is negligible small.
While wet deposition is the most important sink for accumulation mode particle number, coagulation is the dominant sink for Aitken mode particles. Here, intermodal coagula-5
tion is more effective than intramodal coagulation. Dry and wet deposition have only a small impact on particle number concentration in the Aitken mode. Coagulation (in-tramodal) is an important sink for accumulation mode particle number, too. Besides this, also the removal of particles by dry deposition is relevant for the accumulation mode. Again, this is in accordance with the study ofAdams and Seinfeld(2002), who 10
also found that coagulation is the dominant sink of particle number concentration on global annual average.
In summary, for the simulation of particle number in the size-range of the Aitken mode at the global scale, aerosol dynamics (in particular coagulation and nucleation) are of essential importance, whereas all other sources and sinks (emission of primary 15
particles, dry and wet deposition) have minor contribution to the global budgets of the Aitken mode particle number. Nevertheless, emissions can be important locally (surface). For accumulation mode particles, the emission of primary particles and the wet and dry deposition are the dominant source and sink processes. However, also aerosol dynamics such as coagulation and the growth of Aitken particles into the 20
accumulation mode are important and cannot be neglected. Thus, for the simulation of particle number concentration at the global scale, aerosol dynamics are of major importance for both, the Aitken and the accumulation mode.
4.2 Sulfate
In addition to the analysis of sources and sinks of particle number concentration, also 25
the budgets of particle mass concentration are investigated. Therefore further pro-cesses such as condensation or sulfate production in cloud droplets are introduced, which change the mass concentration, whereas the number concentration remains
un-ACPD
6, 7519–7562, 2006
Simulating aerosol microphysics with
ECHAM/MADE A. Lauer and J. Hendricks
Title Page Abstract Introduction Conclusions References Tables Figures J I J I Back Close
Full Screen / Esc
Printer-friendly Version Interactive Discussion
EGU changed. To assess differences between primary and secondary aerosol components,
the budgets are not presented for total mass, but for sulfate and black carbon, which are representative for both classes of aerosol components in the model. Figure 9 shows the budgets of Aitken and accumulation mode sulfate for all individual sources and sinks.
5
Source processes of the secondary aerosol component sulfate are condensation of sulphuric acid vapor (both modes), formation of new particles by nucleation (Aitken mode only) and sulfate production in cloud droplets by oxidation of SO2(accumulation mode only). Most of the Aitken mode sulfate is produced by condensation of H2SO4. Nucleation contributes only about 2% to the sources of Aitken mode sulfate. In the 10
accumulation mode, sulfate production by oxidation of SO2 in cloud droplets (82%) dominates all other sources. In-cloud production contributes about 81% to the total sulfate mass (sum of both modes). This is within the range spanned by the results of other model studies assessing the global atmospheric sulfate budget. These studies suggest a contribution of in-cloud oxidation of SO2 to the total SO4 sources of, for 15
instance, 64%–83% (Chin et al.,2000), 83% (Feichter et al.,1996), 79% (Feichter et al.,1997), and 90% (Takemura et al.,2000). In the present study, the contribution of condensation to the sources of accumulation mode mass amounts to about 17%. The corresponding contribution of the growth of Aitken particles into the accumulation mode size-range is negligible small.
20
In both modes, sulfate is removed by wet and dry deposition. Intermodal coagulation and the growth of Aitken mode particles into the accumulation mode act as sinks for sulfate in the Aitken mode size-range. Wet deposition is the most important sink of accumulation mode sulfate, whereas dry deposition is only of minor importance. In the Aitken mode, besides wet deposition, also the loss of sulfate mass due to particle 25
growth into the accumulation mode size-range is of major importance. But also coag-ulation and dry deposition must not be neglected when considering the sinks of Aitken mode sulfate. Considering total sulfate mass (sum of Aitken and accumulation mode), wet (dry) deposition contributes about 96% (4%) to the total sinks of sulfate. This is at
ACPD
6, 7519–7562, 2006
Simulating aerosol microphysics with
ECHAM/MADE A. Lauer and J. Hendricks
Title Page Abstract Introduction Conclusions References Tables Figures J I J I Back Close
Full Screen / Esc
Printer-friendly Version Interactive Discussion
EGU the high (low) end of the range given by other model studies for the contribution of wet
(dry) deposition to the sinks of sulfate: 80%–93% (20%–7%) (Chin et al.,2000), 87% (13%) (Feichter et al.,1996), 88% (12%) (Takemura et al.,2000), and 95% (5%)Stier et al. (2005).
Thus, aerosol dynamics are only of minor importance for the simulation of accumulation 5
mode sulfate on the global scale, but are absolutely essential for simulating sulfate mass concentration in the size-range of the Aitken mode.
4.3 Black carbon
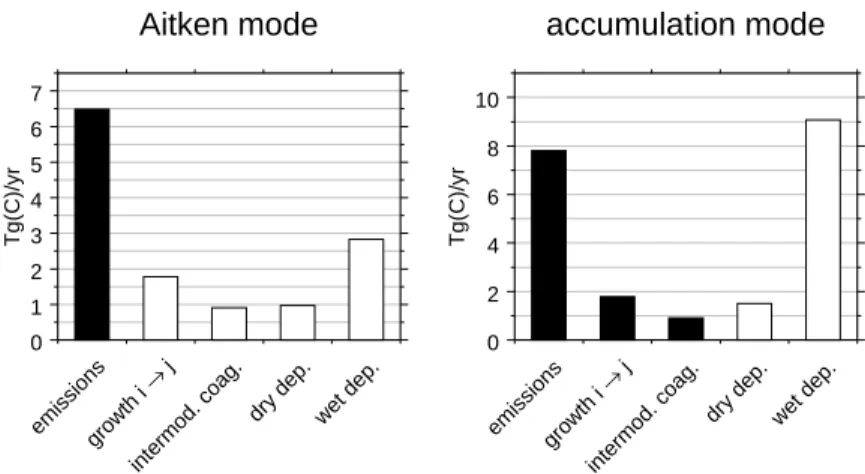
Figure10 shows the contributions of the individual sources and sinks to the modeled climatological global mean black carbon mass budgets.
10
Emissions are the only source of BC in the Aitken mode size-range. The simulations suggest that emissions of primary particles constitute also the main source (74%) of accumulation mode BC, whereas the growth of Aitken particles into the accumulation mode and intermodal coagulation contribute only 17% and 9%, respectively. For both modes, wet deposition is the most important sink for BC (Aitken mode: 44% of total 15
sinks, accumulation mode: 86% of total sinks). In addition, transfer of Aitken particles into the accumulation mode (27%), intermodal coagulation (14%), and dry deposition (15%) have important contributions to the sinks of the Aitken mode BC. For the ac-cumulation mode, dry deposition cannot be neglected, too (contribution about 14%). Considering the total BC mass budget (sum of Aitken and accumulation mode), the 20
contribution of wet (dry) deposition to the total sinks calculated by ECHAM4/MADE amounts to 81% (19%). Stier et al. (2005) calculated a corresponding contribution of 92% (8%). Koch (2001) simulated contributions ranging from 58% to 64% (42% to 37%).Takemura et al.(2000) obtained 82% (18%).
Overall, aerosol dynamics play an important role for the simulation of BC particles at 25
the global scale, particularly for the Aitken mode. Although the budget of accumulation mode BC is dominated by emission of primary particles and wet and dry deposition,
ACPD
6, 7519–7562, 2006
Simulating aerosol microphysics with
ECHAM/MADE A. Lauer and J. Hendricks
Title Page Abstract Introduction Conclusions References Tables Figures J I J I Back Close
Full Screen / Esc
Printer-friendly Version Interactive Discussion
EGU the contribution of aerosol dynamics should not be neglected.
4.4 Net-production/-depletion
In addition to the total budgets discussed in the previous section, the vertical distri-bution of the microphysical change rate (sum of sources and sinks discussed above) of particle number and mass is analyzed and the dominant processes are identified 5
for different altitudes. For particle mass, we selected sulfate as representative aerosol component. Figures11and 12depict vertical distributions of the climatological zonal mean net change rates of particle number and mass (sulfate) concentration. Sources are considered as positive change rates, sinks as negative change rates. The results allow the identification of regions with net production and net depletion of particle num-10
ber and sulfate mass.
Particle number concentration
Net production of Aitken mode particles near the surface above the continents be-tween about 45◦S and 75◦N is caused particularly by emission of primary particles from sources at the surface. The analysis of the contribution of the individual sources 15
(not shown) reveals, that formation of new particles by nucleation is of minor impor-tance in the near surface layer. Above this layer, intra- and intermodal coagulation effectively remove particles due to the high number concentrations resulting in a strong net depletion of particle number concentration in the Aitken mode. With increasing height, this net depletion decreases due to decreasing particle number. In the upper 20
troposphere and tropopause region, very effective formation of new Aitken mode parti-cles by nucleation occurs. Just below this region of net production, newly formed Aitken particles are effectively removed by coagulation.
In terms of annual means, effective net production of accumulation mode particles takes place in the boundary layer only. In contrast to Aitken mode particles, strong 25
ACPD
6, 7519–7562, 2006
Simulating aerosol microphysics with
ECHAM/MADE A. Lauer and J. Hendricks
Title Page Abstract Introduction Conclusions References Tables Figures J I J I Back Close
Full Screen / Esc
Printer-friendly Version Interactive Discussion
EGU above the oceans. This is mainly caused by emissions of sea salt particles. The
max-imum net depletion of accumulation mode particle number takes place in the altitude range between 700 and 900 hPa. Here, the reduction of particle number by wet depo-sition is most effective. Only small net depletion occurs above about 600 hPa. Hence, in contrast to the Aitken mode, the particle number concentration of the accumulation 5
mode experiences only very small changes due to microphysical processes at these altitudes. This results in a comparatively small altitudinal variation of the accumulation mode particle number concentration (see also Fig.6).
Sulfate
Aitken mode sulfate is very effectively removed by dry deposition at the surface result-10
ing in a strong net depletion in the near surface layer (Fig.12). In the lower troposphere above the surface layer, net production of sulfate takes place. In this region, large amounts of sulphuric acid vapor condense on the surfaces of the abundantly existing Aitken particles. In addition, a small net production of Aitken mode sulfate takes place in the tropopause region due to new particle formation by nucleation, which compen-15
sates the weak sinks in this altitude. In most other regions, a net depletion of Aitken mode sulfate occurs. The maximum of the net depletion occurs between about 700 and 900 hPa. Here the transfer of Aitken mode sulfate into the accumulation mode due to continued growth of the particles is very efficient.
Sulfate in the accumulation mode is produced particularly in the lower troposphere. 20
Here, condensation of sulphuric acid vapor and sulfate production by oxidation of SO2 in cloud droplets are most effective. About 100 hPa above this layer of net production, net depletion reaches its maximum. The most important sink in this region is removal of sulfate by wet deposition. With increasing height, the net depletion decreases. In contrast to sulfate, for aerosol components emitted exclusively in the form of primary 25
particles at the surface (e.g. BC), net production is limited to the boundary layer above the source regions. In all layers above, net depletion takes place, which decreases with height due to decreasing particle concentrations. In a qualitative manner, this vertical
ACPD
6, 7519–7562, 2006
Simulating aerosol microphysics with
ECHAM/MADE A. Lauer and J. Hendricks
Title Page Abstract Introduction Conclusions References Tables Figures J I J I Back Close
Full Screen / Esc
Printer-friendly Version Interactive Discussion
EGU structure of the net production and depletion is similar for both, the Aitken and the
accumulation mode.
5 Conclusions
In this study, we analyzed a multiannual simulation of the global submicrometer aerosol performed with the new model system ECHAM4/MADE. Detailed aerosol physics such 5
as coagulation, condensation and nucleation of sulphuric acid vapor, size-dependent wet and dry deposition and cloud processing of aerosols have been taken into account. Thus, in contrast to most current climate models using aerosol climatologies or simu-lating particle mass only, particle number concentration and aerosol size-distribution can be calculated explicitly. This allows a more detailed insight into global aerosol 10
cycles than previous model studies. The climatological model data have been used to characterize the properties of submicrometer particles in terms of a global assess-ment. Aerosol properties such as chemical composition, number concentration, size-distribution and atmospheric lifetime have been assessed. The model results reveal the following major features of the global submicrometer aerosol:
15
High aerosol mass and number concentrations are found in particular over the highly populated continental areas in the northern hemisphere where aerosol sources are dominated by emissions from fossil fuel combustion. In addition, high aerosol loadings occur over Africa and South America where biomass burning is the major source of submicrometer particles. Also mineral dust and sea salt particles have an important 20
contribution to the aerosol mass loading. Nevertheless, due to large particle sizes, their impact on the number concentration of the submicrometer aerosol is comparably small. Overall, the simulated geographical patterns of aerosol mass corroborate the results of previous studies, including those considering aerosol mass only. The simula-tion of different particle size-ranges suggests, that predominantly accumulation mode 25
particles are subject to long-range transport, whereas Aitken mode particles tend to reside near the source regions. This is caused by the shorter average lifetime of Aitken
ACPD
6, 7519–7562, 2006
Simulating aerosol microphysics with
ECHAM/MADE A. Lauer and J. Hendricks
Title Page Abstract Introduction Conclusions References Tables Figures J I J I Back Close
Full Screen / Esc
Printer-friendly Version Interactive Discussion
EGU mode particles compared to the accumulation mode.
At the Earth’s surface, the aerosol-size-distribution is strongly influenced by the size of emitted primary particles. With increasing height, the mean size of the Aitken mode particles increases due to coagulation, whereas wet deposition reduces the mean size of the accumulation mode aerosols. In the middle and upper troposphere, the mean 5
size of the Aitken mode aerosol decreases due to formation of small new particles by nucleation. On the global scale, nucleation is most effective in the tropopause region. In the boundary layer, nucleation is of less importance. In order to assess the role of aerosol dynamics (i.e., nucleation and condensation of precursor gases, coagula-tion of particles) in the global atmospheric cycles of the submicrometer aerosol, a de-10
tailed analysis of the contribution of different aerosol dynamical processes to the global sources and sinks of particulate matter has been performed. The analysis shows that aerosol dynamical processes are essential sources and sinks of particles at the global scale and are, therefore, of principal importance for the global simulation of aerosol particle number concentration and size distribution. For the simulation of total particle 15
mass, aerosol dynamics turned out to be important but not vital. Aerosol dynamics contribute significantly to sources and sinks of Aitken mode particle mass. Neverthe-less, for the accumulation mode mass concentration, processes such as emissions of primary particles and wet deposition are dominant. As the accumulation mode usu-ally dominates the total mass concentration of typical submicrometer particles such as 20
SO4, BC or OM, the geographic distributions and absolute values of these particles calculated by ECHAM4/MADE fit well within the range of previous model studies, that did not take into account aerosol dynamics (e.g.Adams et al.,1999;Takemura et al., 2000).
We conclude from this study, that simulations of the global submicrometer aerosol 25
should include aerosol dynamical processes whenever particle number concentrations and size-distributions are to be calculated. Since the effects of aerosols on climate such as absorption and scattering of solar radiation and their role as cloud condensation nuclei (CCN) during cloud formation are size-dependent, it is essential to calculate
ACPD
6, 7519–7562, 2006
Simulating aerosol microphysics with
ECHAM/MADE A. Lauer and J. Hendricks
Title Page Abstract Introduction Conclusions References Tables Figures J I J I Back Close
Full Screen / Esc
Printer-friendly Version Interactive Discussion
EGU the size-distribution to make further progress for future predictions of climate change.
This is also the case when assessing health effects of aerosols. On the other hand, if only particle mass concentrations are to be calculated, which are dominated by the accumulation and coarse mode, processes such as emissions, wet and dry deposition are most important. However, since also dry and wet deposition are size-dependent 5
also the simulations of the global particle mass cycles will benefit from consideration of aerosol dynamics.
Acknowledgements. This work was supported by the German Helmholtz-Gemeinschaft
Deutscher Forschungszentren (HGF) and the Deutsches Zentrum f ¨ur Luft- und Raumfahrt (DLR) within the project Particles and Cirrus Clouds (PAZI-2) and by the Junior Research Group
10
SeaKLIM, which is funded by the HGF, DLR, and the University of Bremen. All model calcu-lations were performed on the High Perfomance Computer Centre for earth system research (HLRE), supported by the German Federal Ministry of Education and Research (BMBF) and the German Climate Computing Centre (DKRZ). We thank V. Aquila and B. K ¨archer for their helpful comments on the manuscript.
15
References
Ackermann, I. J., Hass, H., Memmesheimer, M., Ebel, A., Binkowski, F. S., and Shankar, U.: Modal Aerosol Dynamics for Europe: Development and first applications, Atmos. Environ.,
32, 2981–2999, 1998. 7523
Adams, P. J., Seinfeld, J. H., and Koch, D. M.: Global concentrations of tropospheric sulfate,
20
nitrate and ammonium simulated in a general circulation model, J. Geophys. Res., 104,
13 791–13 823, 1999. 7521,7525,7526,7531,7532,7546
Adams, P. J. and Seinfeld, J. H. : Predicting global aerosol size distributions in general
circula-tion models, J. Geophys. Res., 107(D190), 4370, doi:10.1029/2001JD001010, 2002. 7522,
7531,7533,7538,7539,7540 25
Chin, M., Rood, R. B., Lin, S.-J., M ¨uller, J.-F., and Thompson, A.: Atmospheric sulfur cycle sim-ulated in the global model GOCART: Model description and global properties, J. Geophys.