HAL Id: hal-00301191
https://hal.archives-ouvertes.fr/hal-00301191
Submitted on 25 Jul 2003HAL is a multi-disciplinary open access
archive for the deposit and dissemination of sci-entific research documents, whether they are pub-lished or not. The documents may come from teaching and research institutions in France or abroad, or from public or private research centers.
L’archive ouverte pluridisciplinaire HAL, est destinée au dépôt et à la diffusion de documents scientifiques de niveau recherche, publiés ou non, émanant des établissements d’enseignement et de recherche français ou étrangers, des laboratoires publics ou privés.
Overview of the field measurement campaign in
Hyytiälä, August 2001 in the framework of the EU
project OSOA
M. Boy, T. Petäja, M. Dal Maso, Ü. Rannik, J. Rinne, P. Aalto, A.
Laaksonen, P. Vaattovaara, J. Joutsensaari, T. Hoffmann, et al.
To cite this version:
M. Boy, T. Petäja, M. Dal Maso, Ü. Rannik, J. Rinne, et al.. Overview of the field measurement campaign in Hyytiälä, August 2001 in the framework of the EU project OSOA. Atmospheric Chemistry and Physics Discussions, European Geosciences Union, 2003, 3 (4), pp.3769-3831. �hal-00301191�
ACPD
3, 3769–3831, 2003
Overview of the field measurement campaign in Hyyti ¨al ¨a
M. Boy et al. Title Page Abstract Introduction Conclusions References Tables Figures J I J I Back Close Full Screen / Esc
Print Version Interactive Discussion
© EGU 2003 Atmos. Chem. Phys. Discuss., 3, 3769–3831, 2003
www.atmos-chem-phys.org/acpd/3/3769/ © European Geosciences Union 2003
Atmospheric Chemistry and Physics Discussions
Overview of the field measurement
campaign in Hyyti ¨al ¨a, August 2001 in the
framework of the EU project OSOA
M. Boy1, T. Pet ¨aj ¨a1, M. Dal Maso1, ¨U. Rannik1, J. Rinne1, P. Aalto1,
A. Laaksonen2, P. Vaattovaara2, J. Joutsensaari2, T. Hoffmann3, J. Warnke3, M. Apostolaki4, E. G. Stephanou4, M. Tsapakis4, A. Kouvarakis4, C. Pio5,
A. Carvalho5, A. R ¨ompp6, G. Moortgat6, C. Spirig7, A. Guenther7, J. Greenberg7, P. Ciccioli8, and M. Kulmala1
1
Dept. of Physical Sciences, University of Helsinki, P.O. Box 64, FIN-00014, Finland
2
University of Kuopio, Kuopio, Finland
3
Institut f ¨ur Specktrochemie, Dortmund, Germany
4
Environmental Chemical Processes Laboratory – University of Crete, GR-71409 Heraklion, Greece
5
Universidade de Aveiro, Departamento de Ambiente e Ordenamento, Portugal
6
Max-Planck-Institut f ¨ur Chemie, Atmospheric Chemistry Division, D-55020, Germany
7
Atmospheric Chemistry Division, National Centre for Atmospheric Research, Boulder, CO, USA
8
Instituto di Metodologie Chimiche, Area della Ricerca del CNR di Montelibretti, Italy Received: 10 April 2003 – Accepted: 11 July 2003 – Published: 25 July 2003 Correspondence to: M. Boy (michael.boy@helsinki.fi)
ACPD
3, 3769–3831, 2003
Overview of the field measurement campaign in Hyyti ¨al ¨a
M. Boy et al. Title Page Abstract Introduction Conclusions References Tables Figures J I J I Back Close Full Screen / Esc
Print Version Interactive Discussion
© EGU 2003
Abstract
As one part of the OSOA (Origin and formation of Secondary Organic Aerosols) project, two intensive field campaigns were conducted in Melpitz, Germany and Hyyti ¨al ¨a, Fin-land. This paper gives an overview of the measurements made during the Hyyti ¨al ¨a campaign, which was held between the 1st and 16th of August 2001. Various
in-5
strumental techniques were used to achieve physical and chemical characterisation of aerosols and to investigate possible precursor gases.
During the OSOA campaign in Hyyti ¨al ¨a, particle formation was observed on three consecutive days at the beginning of the campaign (1 to 3 August 2001) and on three days later on. The investigation of the meteorological situation divided the campaign
10
into two parts. During the first three days of August, relatively cold and clean air masses from northwest passed over the station (condensation sink – CS: <0.002 s−1, NOx:
<0.5 ppb). Daily particle bursts of one fraction of the nucleation mode aerosols (3–
10 nm) with number concentrations between 600–1200 particles cm−3 were observed. After this period, warmer and more polluted air from south-west to south-east arrived at
15
the station (CS: 0.002–0.01 s−1, NOx: 0.5–4 ppb) and during these 13 days only three events were observed. These events were not as apparent as those that occurred during the earlier period of the campaign. The chemical analyses from different insti-tutes of PM2, PM2.5and PM10 particles confirmed the assumption that organic matter from the oxidation of various terpenes contributed to the formation of secondary
or-20
ganic aerosols (SOA). Concerning these conclusions among others, the ratio between formic (oxidation product of isoprene and monoterpenes by ozone) and acetic acid (increased by anthropogenic emissions) (ratio=1 to 1.5) and concentration of differ-ent carboxylic acids (up to 62 ng m−3) were investigated. Gas/particle partitioning of five photo-oxidation products from α- and β-pinene resulted in higher concentrations
25
for pinonic, nor pinonic and pinic acids in the particle phase than in the gas phase, which indicates preference to the particle phase for these compounds. The average growth factors (GF) from 100 nm particles in water vapour gave a diurnal pattern with
ACPD
3, 3769–3831, 2003
Overview of the field measurement campaign in Hyyti ¨al ¨a
M. Boy et al. Title Page Abstract Introduction Conclusions References Tables Figures J I J I Back Close Full Screen / Esc
Print Version Interactive Discussion
© EGU 2003 a maximum during daytime and values between 1.2 and 1.7. On average, the amount
of secondary organic carbon reached values around of 19% of the sampled aerosols and the results indicate that formation of SOA with the influence of photo-oxidation products from terpenes was the reason for the observed particle bursts during the campaign. However, correlations between the precursor gases or the favourable
con-5
densing species with the monitored nucleation mode particles were not found. For the investigated time period other factors like the condensation sink of newly formed par-ticles to the pre-existing aerosols, temperature and solar irradiance seem to be more important steering parameters for the production of new aerosols.
Another open question concerns the vertical distribution of the formation of SOA.
10
For this reason measurements were conducted at different altitudes using a tethered balloon platform with particle sampling and particle counting equipment. They were in-corporated with eddy covariance (EC) flux measurements made at 23 m above ground level. The results give first indications that the process of the production of new aerosols happens throughout the planetary boundary layer (PBL), whereby different
15
parameters e.g. temperature, CS, solar irradiance or concentration of monoterpenes are responsible for the location of the vertical maximum.
1. Introduction
The purpose of the EU project OSOA (Origin and Formation of Secondary Organic Aerosols) was to quantitatively understand the sources and formation mechanisms of
20
secondary organic aerosols applying a combination of laboratory studies, chemical analysis of particulate matter, modelling and field observations. Within the framework of this project an extensive field campaign was carried out in Hyyti ¨al ¨a, Finland between the 1 and 16 August 2001. Altogether eight institutes from five different countries par-ticipated in this experiment with some newly developed analytical instrumentation and
25
methodologies to reach a better scientific knowledge of the sources, physical proper-ties and chemical composition of this organic fraction of atmospheric aerosols.
ACPD
3, 3769–3831, 2003
Overview of the field measurement campaign in Hyyti ¨al ¨a
M. Boy et al. Title Page Abstract Introduction Conclusions References Tables Figures J I J I Back Close Full Screen / Esc
Print Version Interactive Discussion
© EGU 2003 It is known that the total organic carbon can comprise 25–65% of the fine aerosol
(diameter <2.5 µm) mass in some regions (Chow et al., 1994 and Novakov et al., 1997) and that the emission by vegetation of volatile organic compounds (VOC) is approximately 1150 C Tg per year (Guenther et al., 1995). Furthermore, we know that bursts of newly formed aerosols appear in various rural areas (i.e. continental boundary
5
layer: Kavouras et al., 1998, Kulmala et al., 2001a, Nilsson et al., 2001a and Birmili et al., 2002). However, the exact understanding of the pathways from emission of VOCs to the particulate phase still includes far too many unknowns to draw final conclusions. Secondary organic aerosols are formed, when the saturation vapour pressure of the gas-phase oxidation products is sufficiently low so that these species can condense
10
on pre-existing particles or even form new particles through homogeneous nucleation. Hoppel et al., 2001 observed in Calspan’s 600 m3environmental chamber aerosol for-mation and growth from the reaction products of α-pinene and ozone, utilizing rela-tively low concentrations of α-pinene (15 ppb) and ozone (100 ppb). Nucleation in this
α-pinene/ozone system could not be explained by classical nucleation theory. The
15
authors suggested that the nucleation rate in the α-pinene/ozone system may be lim-ited by the initial nucleation steps (i.e. dimer, trimer or adduct formation). This would be a possible pathway how organic species formed out of gas-phase reactions from monoterpenes could contribute to the formation of new aerosols by homogeneous nu-cleation. However, the concentrations of α-pinene used in this experiment are still one
20
order of magnitude higher than observed e.g. in a rural area of central Finland. An-other theory, which would explain the nucleation events or the time of particle bursts, is ternary nucleation of H2O, NH3 and H2SO4 (Korhonen et al., 1999). According to the suggestions of Kulmala et al. (2000), ternary nucleation can occur at typical tropo-spheric conditions leading to a reservoir of thermodynamically stable clusters (TSCs,
25
diameter ∼=1 nm), which under certain conditions grow to detectable sizes. In this case organic compounds with low volatility could be the condensing species, which bring the particles to the size of 3 nm in diameter, where present state-of-art instrumentation can detect them.
ACPD
3, 3769–3831, 2003
Overview of the field measurement campaign in Hyyti ¨al ¨a
M. Boy et al. Title Page Abstract Introduction Conclusions References Tables Figures J I J I Back Close Full Screen / Esc
Print Version Interactive Discussion
© EGU 2003 The aim of the OSOA project and the field campaign in Hyyti ¨al ¨a was to get more
de-tailed information about the precursor gases, condensing species and reaction mech-anisms involved in the formation process of secondary organic aerosols. Out of these reasons, gas-phase and particle phase measurements were carried out in a rural area with low anthropogenic impact.
5
2. Instrumentation
2.1. SMEAR II
Data were collected at the Station for Measuring Forest Ecosystem-Atmosphere Re-lations (SMEAR II) in Hyyti ¨al ¨a, Finland. The station is located in Southern Finland (61◦510 N, 24◦170 E, 181 m asl), with extended areas of Scots Pine (Pinus sylvestris)
10
dominated forests. The conditions at the site are typical for a background location; however, occasionally measurements were polluted by the station buildings (0.5 km away) and the city of Tampere (60 km away) both located in a west-south-west direc-tion (215–265 degree) from the instruments.
A Differential Mobility Particle Sizer (DMPS) system (located in the cottage)
moni-15
tored aerosol size distributions at 2 m height from ground level. This gave a continuous view of the distribution and evolution of sub-micrometer aerosol particles. The DMPS system used here actually consists of two systems. The first system includes a TSI 3025 UFCPC and a Hauke-type short DMA (Differential Mobility Analyzer) and mea-sured particles between 3 and 20 nm in dry diameter. The second system included
20
a TSI 3010 CPC and a Hauke-type medium DMA capable of measuring particles be-tween 20 and 500 nm. A particle size distribution is recorded every 10 min (Aalto et al., 2001).
Concentrations of H2O, NOx, SO2 and O3 were measured with an URAS gas ana-lyzer, chemiluminescence gas analyzer (TEI 42S), fluorescence analyzer (TEI 43BS)
25
ACPD
3, 3769–3831, 2003
Overview of the field measurement campaign in Hyyti ¨al ¨a
M. Boy et al. Title Page Abstract Introduction Conclusions References Tables Figures J I J I Back Close Full Screen / Esc
Print Version Interactive Discussion
© EGU 2003 mast at 4.2 m, 16.8 m and 67.2 m height levels every 5 minutes. Temperature
(mea-sured with PT-100-sensors, platinum resistance thermometers) and horizontal wind speed (measured with cup anemometers) were collected every 50 s at these three heights as well. Wind direction was measured every 50 s by wind vanes at 16.8 m and 50.4 m heights.
5
A Sensitron AB monostatic 2.3 kHz doppler Sound Detection and Ranging system (SODAR) was used to measure the stability of the air (echo strength) and the means and standard deviations of the horizontal and vertical wind components as well as wind direction up to a height of 500 m in 25 m intervals. Raw echo measurements were achieved in 8-second cycles between three antennas. The vertical antenna echo
10
strength was averaged and stored every 3 min. Averages and standard deviations of wind speed were then derived and averaged over 30 min periods.
Spectral solar irradiance in the range from 280 to 580 nm and a step width of 1 nm was measured with a Bentham DM150 double monochromator. The scans were per-formed every half hour and lasted approximately 11 min. A detailed description of this
15
instrument is given by Boy and Kulmala (2002a).
The aerosol particle number fluxes were measured by the eddy covariance (EC) technique at a height of 23 m, approximately 10 m above the forest canopy. The fast re-sponse measurements (20 Hz) of wind speed and particle number concentration were performed by a sonic anemometer (Solent Research R3, Gill Instruments, Lymington,
20
UK) and a modified condensational particle counter (CPC) TSI model 3010 (TSI Incor-porated, Shoreview, MN, USA). The particle sizes detected by the EC system included particles in the range of 10 to 500 nm. Lower cut-off size (50% counting efficiency) for the CPC was determined as 14 nm by Buzorius et al. (2001a). Particle fluxes were calculated for half-hour averaging periods. More details of the particle eddy covariance
25
system and various aspects of its application and operation can be found in Buzorius et al. (2000). For a more detailed description of the SMEAR II station and instrumen-tation, see Kulmala et al. (2001a) andhttp://www.honeybee.helsinki.fi/smear/.
ACPD
3, 3769–3831, 2003
Overview of the field measurement campaign in Hyyti ¨al ¨a
M. Boy et al. Title Page Abstract Introduction Conclusions References Tables Figures J I J I Back Close Full Screen / Esc
Print Version Interactive Discussion
© EGU 2003 2.2. HTDMA and OTDMA
As a part of the physicochemical characterization of aerosol during the Hyyti ¨al ¨a cam-paign, hygroscopic properties of sub-micron particles as well as their ability to absorb ethanol were monitored using Hygroscopicity and Organic Tandem Differential Mobility Analyzers (HTDMA and OTDMA). They were set up in a container close to the mast
5
and they used the same sample inlet, which drew air from a height of 16 m through a steel tube (diameter 2.5 cm). The flow rate was approximately 17 L min−1 in order to minimize particle losses due to a long residence time inside the inlet tube. The sam-ples were drawn through 10 mm OD copper tubes from the main inlet line near the container to the individual instruments.
10
The HTDMA system consists of two Vienna type DMAs (Winklmayr et al. 1991) in series and one TSI-CPC 3010 particle counter for concentration measurements. In addition there is also a humidification unit, which generates the desired relative humidity inside the second DMA in two stages. Sheath air and aerosol sample flow are humidified separately. The system is built following the guidelines set by H ¨ameri
15
et al. (2000) to measure also in the ultra-fine size range (10–20 nm). As an output, the HTDMA gives the ratio of particle diameter at elevated RH to that at dry conditions, denoted as growth factor (GF).
The hygroscopicity measurements of the particles were conducted at ∼90% ± 4% relative humidity. Size changes in elevated relative humidity were monitored for the
20
particles of 20, 30, 50, 100 and 150 nm in diameter. Concentrations in the HTDMA were not corrected with respect to losses inside the system and sampling inlet. Fluctuations of RH during the measurements were not taken into account either. The functionality of the HTDMA was checked daily by measuring the growth factor for a known substance, pure ammonium sulphate aerosol. It was generated from liquid solution with a TSI 3076
25
Constant Output Atomizer. Hygroscopicity data was obtained every 10 min for one dry size. Taking into account the number of dry sizes measured, hygroscopic properties were measured ca. once per hour for each dry size. The HTDMA was in operation
ACPD
3, 3769–3831, 2003
Overview of the field measurement campaign in Hyyti ¨al ¨a
M. Boy et al. Title Page Abstract Introduction Conclusions References Tables Figures J I J I Back Close Full Screen / Esc
Print Version Interactive Discussion
© EGU 2003 continuously.
The main features of the OTDMA are similar to those of the HTDMA with the ex-ception that the humidification unit is used to generate a constant ethanol saturation ratio inside the second DMA. Also the aerosol line before DMA-2 can be humidified with ethanol. The details of the instrument are described in Joutsensaari et al. (2001).
5
Growth in ethanol vapour was mainly determined for particles of 20, 30, 50, 80 and 100 nm in diameter. The saturation ratio (S) of ethanol vapour was kept at 0.90±0.02 during the experiments. The OTDMA measurements were mainly carried out during daytime (9 a.m.–8 p.m.) because the system is not fully automatized and supervision is needed during measurements. Only a few nighttime experiments (15, 16 and 17
Au-10
gust) were carried out. An external treatment unit at the inlet of the DMA-2 was used some times to treat particles with ethanol before DMA-2. In most of the experiments, aerosol particles were only treated inside DMA-2 by ethanol-rich sheath air.
Atmospheric aerosol is often an external mixture, i.e. it consists of particles which have different chemical compositions. Their water and ethanol uptake properties may
15
therefore vary, which are observed in the HTDMA and OTDMA as distinct peaks.
2.3. Tethered balloon platform measurements
Measurements on tethered balloon platforms can be used to derive gas fluxes aver-aged over large areas (20 to <200 km2) (Davis et al., 1994, Greenberg et al., 1999 and Helmig et al., 1998). For this purpose, two tethered helium balloons (Vol.: 9 m3,
20
Blimp Works, Statesville, NC) were flown at heights between 2 m and 1.2 km above ground during the field campaign in Hyyti ¨al ¨a. The launch site was the soccer field at the Hyyti ¨al ¨a station, located 0.9 km southeast of the SMEAR II mast. VOCs were col-lected onto adsorbent cartridges (combinations of Carbotrap®, and Carbosieve S-III®) by miniaturized air samplers. The sampling packages also include sensors for
tem-25
perature and pressure, and can be attached to any position on the tether line. Details about these samplers are given in Greenberg et al. (1999). Analysis of VOC samples was performed in the laboratory at NCAR (Boulder, CO), with gas chromatography and
ACPD
3, 3769–3831, 2003
Overview of the field measurement campaign in Hyyti ¨al ¨a
M. Boy et al. Title Page Abstract Introduction Conclusions References Tables Figures J I J I Back Close Full Screen / Esc
Print Version Interactive Discussion
© EGU 2003 mass spectrometry detection (GC-MS). The procedure for the analysis of the cartridges
is described by Greenberg et al. (1995).
In addition to VOC sampling, in-situ particle counters were attached to the tethered balloons. Two handheld particle counters were used, an optical particle counter (OPC) (ABACUS, Particle Measurement Systems, Boulder, CO) and a condensation particle
5
counter (CPC) (Model 3007, TSI Inc., Shoreview, MN). The OPC quantifies particle number concentrations in 4 size bins (0.3–0.5 µm, 0.5–1 µm, 1–5 µm, and >5 µm di-ameter), the CPC measures the total particle number in the size range of 10 nm–1 µm. According to calibration measurements by H ¨ameri et al., (2003) the 50% detection efficiency for the CPC was 10 nm.
10
Tethered balloons were flown during daytime from 2 August to 12 August, in two basic configurations.
1. VOC sampling package and particle sensor attached 0.5 m below the balloon with continuous measurements during ascent and descent. This setup generates ver-tical profiles of temperature, humidity and particles, as well as an integrative VOC
15
measurement from ground to the maximum height of the balloon. With time res-olutions of 30 s (OPC), 10 s (CPC, averaged data of originally 1 Hz) and 2 s (tem-perature and humidity) at ascent and descent rates of 0.5–1 m s−1, the resulting vertical resolutions were 30 and 10 m for particle measurements and 1–2 m for meteorological data, respectively.
20
2. Three VOC sampling packages attached on the tether line at heights of about 120, 250 and 550 m. The packages sampled air at those heights during 30 minutes, delivering a mean VOC vertical profile of the lowest 550 m.
Measuring on tethered balloons was limited by weather conditions. Rain and high wind speeds prevent a safe operation and reduced the data coverage during the OSOA
25
campaign. A total of 48 successful balloon flights were performed as summarized in Table 1.
ACPD
3, 3769–3831, 2003
Overview of the field measurement campaign in Hyyti ¨al ¨a
M. Boy et al. Title Page Abstract Introduction Conclusions References Tables Figures J I J I Back Close Full Screen / Esc
Print Version Interactive Discussion
© EGU 2003 All gas and particle samples described below were taken on an extra tower
approxi-mately 15 m away from the mast at a height of 16 m (2 m above the canopy). 2.4. Collection of formic and acetic acids with an annular denuder system
Formic and acetic acid were collected over 12 hour periods, day and night, using an annular denuder system. The denuders were extracted using ultra-pure water, and the
5
extract was analysed by isocratic ion chromatography (Lawrence and Koutrakis, 1994; Zervas et al, 1999). Gaseous carbonyls were collected during 12 hours periods (day and night) by drawing air through (DNPH)-coated Sep-Pak silica cartridges (Waters Assay Milford), (Sirju and Shepson, 1995), after removal of ozone in a KI impregnated copper tube coil. The cartridges were extracted with acetonitrile and the extract was
10
analysed by binary gradient HPLC with diode-array detection.
2.5. Gas- and particle-phase collection of photo-oxidation products and formic and acetic acids
Carbonaceous aerosol samples were collected, using a novel sampling device (Kavouras et al., 1999a), for 12-h sampling periods from 31 July to 8 August 2001
15
in the forest of Hyyti ¨al ¨a in Finland. Details of the sampling device and sampling proce-dures are given in Kavouras et al. (1999b). The polar and acidic fractions of all sam-ples were analysed according to Kavouras et al. (1999b) using a GCQ Finnigan ion trap gas chromatograph-mass spectrometer. Gaseous formic and acetic acids were collected by using an annual denuder equipped with a filter pack system (Lawrence
20
and Koutrakis, 1996). The analyses of the denuder extracts were performed by ion chromatography (Mihalopoulos et al., 1997).
2.6. High-volume samplers and analysis by thermal-optical method
The particulate matter collection was carried out by means of high-volume samplers, on Whatman QMA quartz filters. Both size segregated and non-segregated samples were
ACPD
3, 3769–3831, 2003
Overview of the field measurement campaign in Hyyti ¨al ¨a
M. Boy et al. Title Page Abstract Introduction Conclusions References Tables Figures J I J I Back Close Full Screen / Esc
Print Version Interactive Discussion
© EGU 2003 obtained. A fraction of each aerosol sample was analysed for black and organic carbon
(BC and OC, respectively) by means of a thermal-optical method (Pio et al., 1994). The remaining parts of the filters were extracted with dichloromethane (DCM) and ultra-pure water. The obtained extracts were analysed by a thermal-chemical method and GC-MS. (Alves et al., 2001 and 2002; Carvalho et al., 2003).
5
2.7. High-volume samplers and LC-TOF-MS
PM2 aerosol samples were collected on preheated quartz filters using a Digitel high volume sampler at flow rates of 1 m3min−1. Terpene oxidation products were measured with 12 h sampling time between 1 and 10 August. The filters were extracted with 10% methanol and were analyzed by LC-TOF-MS (Applied Biosystems, Langen, Germany)
10
(R ¨ompp and Moortgat, 2000).
2.8. Quartz fibre filters and HPLC-ESI-MS-Analysis
For PM2.5 particle sampling quartz fibre filters with a diameter of 70 mm (mounted in stainless steel filter holders) were used. A sampling flow rate of 2.3 m3h−1was applied. During the Hyyti ¨al ¨a-campaign a backup filter was placed behind the front filter to
de-15
termine possible sampling artefacts. The duration of the sampling was about 12 hours, usually divided in day and night samples. Prior to extraction the filters were spiked with a standard (camphoric acid) for determination of the recovery rate. Afterwards the filters were extracted in an ultrasonic bath using methanol as solvent. The analysis was done by a capillary-HPLC-ESI-IT-MS system (ThermoFinnigan, San Jose, USA)
20
(Warnke et al. 2003).
3. Results and discussion
The results of the experiments are divided into five subsections. Subsection one con-tains the characteristics of the aerosols. In section two precursor measurements of
ACPD
3, 3769–3831, 2003
Overview of the field measurement campaign in Hyyti ¨al ¨a
M. Boy et al. Title Page Abstract Introduction Conclusions References Tables Figures J I J I Back Close Full Screen / Esc
Print Version Interactive Discussion
© EGU 2003 different gases are discussed and section three presents the chemical
characterisa-tion of photo-oxidacharacterisa-tion products of VOCs in the gas- and particle-phase. In subseccharacterisa-tion four chemical aerosol analyses from different institutes are introduced and in the last subsection we give an overview of the meteorology including solar radiation during the time of the field campaign in Hyyti ¨al ¨a.
5
3.1. Characterisation of the aerosols
3.1.1. Time of particle bursts and condensational sink
Nucleation events or particle bursts measured at sizes >3 nm with the DMPS system were observed on the first three days in August and in more unclear patterns on the 7, 10 and 14 August (Fig. 1). On all event days apart from the 7th and the 10th we
10
observed high number concentrations (600–1300 particles cm−3) of small nucleation mode particles (3–10 nm) followed by a continuous growth to the Aitken and sometimes even accumulation mode. The 7 and the 10 August are objectively difficult to declare as an event or a non-event day, however, for a wider discussion field we consider both days as nucleation days in this publication. In the single subplots thin red lines mark
15
the onset and the end of the particle bursts, based on limit of 200 particles cm−3 in the nucleation mode. When this limit was exceeded or the concentration fell below, a nucleation event was considered to be started or ended. This limit is set in order to obtain some time interval for the nucleation event. Difficulty in selecting a correct period is due to the fact that growth from cluster sizes (1 nm) to the detection limit of
20
the instrument (3 nm) can vary under different atmospheric conditions.
Loss of condensable molecules to the pre-existing aerosol population can be de-scribed with the condensational sink (Kulmala et al., 2001b) as
CS =Xβi · ri · Ni (1)
where ri is the radius of the i:th size class, Ni is the respective number concentration
25
ACPD
3, 3769–3831, 2003
Overview of the field measurement campaign in Hyyti ¨al ¨a
M. Boy et al. Title Page Abstract Introduction Conclusions References Tables Figures J I J I Back Close Full Screen / Esc
Print Version Interactive Discussion
© EGU 2003 calculations, values for the molecular mass and the diffusion volume of the
condens-ing vapour were taken as the condenscondens-ing specie was sulphuric acid. Figure 2 gives 30 min average values of the number concentration of the nucleation mode particles, the calculated condensational sink and the nucleation event times for the whole cam-paign period. At all events we recognised a clear decrease of the condensational sink
5
short time before or at the start of the particle bursts. This phenomenon was observed for most of the events in Hyyti ¨al ¨a during the last years and could be explained by the onset of turbulence and the growth of the mixed layer, which mixes relatively clean air from the residual layer with more polluted air masses from the surface layer (Boy and Kulmala, 2002b and Nilsson et al. 2001b). Further the values of the condensational
10
sink on the event days in the beginning (CS ∼= 0.001 s−1) were two to three times smaller than on the other event days (CS ∼= 0.002 − 0.003 s−1). The 7 August with the lowest number concentration of nucleation mode particles also shows the highest condensational sink values. These results indicate that high number concentration of existing aerosols reduce or prevent the formation of new particles by acting as sinks
15
for the condensing vapours or the very small new formed particles (Dp< 3 nm).
3.1.2. Growth rate of particles and calculated gas concentrations
The growth rates of the newly formed particles during the early stages (first few hours) of growth were obtained from the DMPS data, according to the change in the maximum diameter the new particles had reached by the end of formation. Assuming that the
20
growth rate is constant during the formation period, condensation theory enables us to estimate the amount of condensable vapour present. For the condensable vapour we can write a simple differential equation
d C
d t = Q − CS
∗Q (2)
where Q is the vapour source rate and CS the condensation sink caused by the
ex-25
ACPD
3, 3769–3831, 2003
Overview of the field measurement campaign in Hyyti ¨al ¨a
M. Boy et al. Title Page Abstract Introduction Conclusions References Tables Figures J I J I Back Close Full Screen / Esc
Print Version Interactive Discussion
© EGU 2003 a steady-state approximation and estimate the source rate by setting d C/d t = 0. A
detailed description of this method can be found from Dal Maso et al. (2002). The results of this analysis are given in Table 2. The growth rates (6–11 nm h−1) and the calculated vapour concentrations (8–15 107molecules cm−3) and sources (1–5 105molecules cm−3s−1) are rather high compared to the respectively long-term mean
5
values observed in Hyyti ¨al ¨a, but are quite comparable with earlier summertime obser-vations. However, the 14 August with about four times higher values than the other event days seems to be questionable: event or advection of polluted air masses. We discuss this day in the following sections in more detail.
3.1.3. Water and ethanol vapour uptake properties of aerosols
10
The hygroscopic properties of the ambient aerosol during this campaign were found to be very similar to reported values by H ¨ameri et al. (2001) in previous campaigns. On average, the ambient aerosol in Hyyti ¨al ¨a is quite inert in terms of water uptake, and it can mostly be classified to the less hygroscopic mode based on their growth factors (GF= 1.1–1.4). According to laboratory measurements, oxidation products of
15
a-pinene (biogenic VOC, GF=1.1, Virkkula et al., 1999) and toluene (anthropogenic VOC, GF=1.2, Pet¨aj¨a et al., 2002) belong to this group.
In order to study diurnal variations in water uptake, concentration weighed averages of measured hygroscopic growth factors in water were calculated. For internally mixed aerosol this is just the observed growth factor but in case of externally mixed aerosol,
20
averaging process ensures that the dominant hygroscopic fraction is weighed more and thus affects the average hygroscopic properties more. External mixing with respect to water uptake prevails for sizes larger than 50 nm in diameter. Growth factors in ethanol were more internally mixed and only one growth factor was observed most of the time. This indicates same ethanol uptake for all particles in the ambient aerosol population.
25
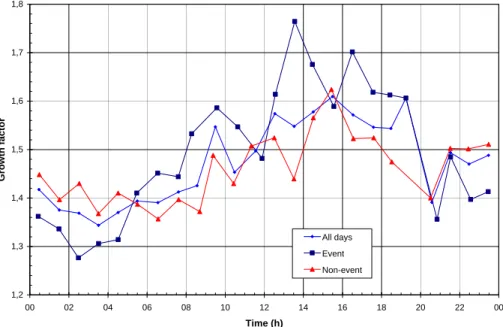
Distinct diurnal variation in the hygroscopic properties of aerosols is obvious in Hyyti ¨al ¨a. Considering hourly averages of all days of the campaign (Fig. 3), the growth factors are usually larger and more variable during daytime than during nighttime.
ACPD
3, 3769–3831, 2003
Overview of the field measurement campaign in Hyyti ¨al ¨a
M. Boy et al. Title Page Abstract Introduction Conclusions References Tables Figures J I J I Back Close Full Screen / Esc
Print Version Interactive Discussion
© EGU 2003 Roughly between 8 a.m. and 8 p.m., growth factors are larger than 1.4 for 100 nm
particles. Maximum growth factors above 1.6 as hourly averages are observed during afternoon hours. During nighttime, growth factors are stable and between 1.3 and 1.4. When nucleation days and the days with no nucleation burst are considered sep-arately (Fig. 3), it can be noticed that the daily maximum is somewhat higher
dur-5
ing nucleation days, whereas non- nucleation days exhibit more stable water uptake throughout the day and night. A slight decrease in water uptake prior to sunrise is present during all days, but hourly averaged growth factors are lower before nucleation bursts than during the days, when nucleation does not take place.
Figure 4 shows the average growth factors of 100 nm particles in ethanol vapour with
10
saturation ratios of 0.90±0.02 for event days and non-event days. A maximum value of around 1.3–1.35 is reached in the morning, after which the GF gradually decreases to values closer to 1.2 by 8 p.m. There are only three nighttime measurement series, showing a somewhat different behaviour. In one series after a nucleation event day (14.8.2001) the GF decreases rapidly from above 1.35 at midnight to 1.2 at 3.30 a.m.
15
and in the other series after non-event days the GF remains at a nearly constant value of 1.15 throughout the night. Figure 4 also reveals that, unlike with the hygroscopicity, the daytime behaviour of ethanol GFs is very similar during nucleation event and non-event days.
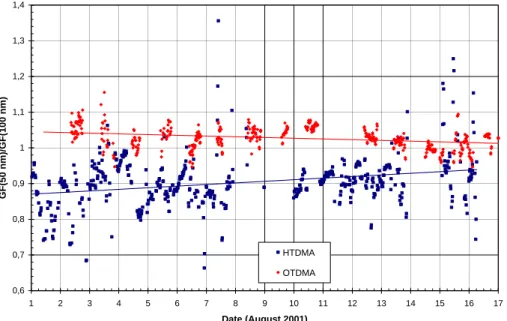
Figure 5 shows two time series which compare the behaviour of 50 nm and 100 nm
20
particles in both water and ethanol vapours. The hygroscopic growth factors of 50 nm particles are most of the time somewhat smaller than those of 100 nm particles with the average of the fraction GF(50 nm)/GF(100 nm) close to 0.9. The difference is mostly too large to be explained (at least solely) by the Kelvin effect, indicating that the composi-tions of the 50 nm and 100 nm particles are usually somewhat different. A further proof
25
of this is the similar time series for the fraction of 50 to 100 nm particle growth factors in ethanol vapour. It can be seen that the 50 nm particles grow more in ethanol than do 100 nm particles, with the average of GF(50 nm)/GF(100 nm) close to 1.02. Note, that if the Kelvin effect could be accounted for, this number should be even slightly higher.
ACPD
3, 3769–3831, 2003
Overview of the field measurement campaign in Hyyti ¨al ¨a
M. Boy et al. Title Page Abstract Introduction Conclusions References Tables Figures J I J I Back Close Full Screen / Esc
Print Version Interactive Discussion
© EGU 2003 A possible explanation for the data shown in Fig. 5 is that the 100 nm particles contain
a somewhat higher fraction of inorganic salts and a somewhat lower fraction of organic materials than do the 50 nm particles. However, this interpretation cannot be consid-ered conclusive without a chemical analysis of the particles with diameters smaller than 50 or 100 nm. However, with the low concentrations of aerosols we observe in Hyyti ¨al ¨a
5
and the state-of-the-art instrumentation, the sampled masses of nucleation or Aitken mode aerosols are still too low for chemical analysis. In any case, it is interesting to note that both the hygroscopicity and ethanol growth data shown in Fig. 5 exhibit trends such that the 50 and 100 nm growth factors appear to become more similar toward the end of the campaign.
10
3.1.4. Aerosol flux measurements
The particle flux measurements were performed throughout the campaign. However, during most of the days unfavourable wind direction conditions for particle flux obser-vation prevailed (see Fig. 6): under South-westerly wind (215–265◦) the forestry field station buildings act as a source of aerosol particles and corresponding fluxes do not
15
correspond to background conditions (Buzorius et al., 2001b). Under such conditions the particles emitted from the station will be seen as upward fluxes accompanied with an erratic pattern in the flux time series, in contrast to normal background conditions when particle deposition into the forest occurs.
During the first three days in August when particle formation was observed the wind
20
direction was different than the sector corresponding to field station. During these days particle number concentration decreased at night prior to particle formation (Fig. 7). The nights were moderately stable, but turbulent transport of heat and momentum (fric-tion velocity around 0.2 m s−1) did not cease. However, particle fluxes were very small as typically observed at the measurement site (Buzorius et al., 2001b). During the
25
particle bursts period’s rapid increase in particle concentration together with very large downward fluxes were observed (PFlux: 3000–7000 particles cm−2s−1). The very high flux values during particle formation events result from elevated particle number
con-ACPD
3, 3769–3831, 2003
Overview of the field measurement campaign in Hyyti ¨al ¨a
M. Boy et al. Title Page Abstract Introduction Conclusions References Tables Figures J I J I Back Close Full Screen / Esc
Print Version Interactive Discussion
© EGU 2003 centration as well as domination of small nucleation mode particles in size spectrum,
which have very high deposition velocities (e.g., Peters and Heiden, 1992). Similar behaviour but with more variation in fluxes can be seen on the other three event days. In addition to non-stationary, rapid changes in particle concentration, meteorological reasons such as horizontal advection and circulation in the convective mixed layer can
5
cause significant variation in observed fluxes (Nilsson et al., 2001b).
The fluxes obtained from measurements present average fluxes of particles larger than 10 nm in diameter. During nucleation events these fluxes indicate mainly the verti-cal motion of small particles: deposition of these particles into the forest was observed. The result also implies the existence of a higher concentration of these particles up in
10
the atmospheric boundary layer.
3.1.5. Vertical aerosol profiles
The optical particle counter (OPC) was operated on the balloon as described in Sect. 2 from 2 August through to 12 August, whereas the CPC instrument was flown only from 7 August (start 3 p.m.) till 12 August. As a consequence, CPC data cover exclusively
15
days without obvious particle formation events.
Profiles obtained by this method represent instantaneous snapshots of the vertical particle distribution. This is documented by large variations in particle numbers at comparable heights between individual profiles. Variations from one profile flight to the next (time gap of at least 2 hours) or even between ascent and descent of the same
20
flight (30 min) are large.
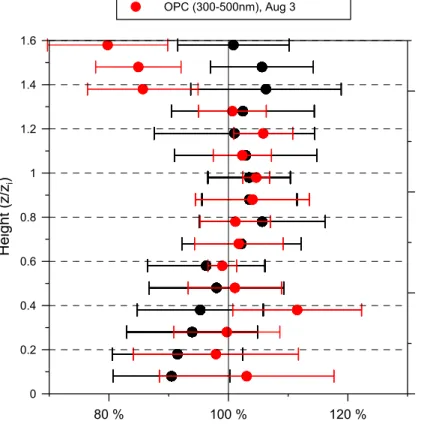
Some distinct features could be observed by looking at the vertical distribution of particles in a relative way, by looking at number concentrations normalized to the aver-aged concentration over the mixed layer. As can be seen in Fig. 8, there was a different vertical trend in particle concentrations (>300 nm) on 3 August as compared to the
av-25
erage profile recorded on non-event-days. On 3 August, particle concentrations above the planetary boundary layer (PBL) were small and no significant gradient within the PBL could be observed, whereas increasing aerosol concentrations with height were
ACPD
3, 3769–3831, 2003
Overview of the field measurement campaign in Hyyti ¨al ¨a
M. Boy et al. Title Page Abstract Introduction Conclusions References Tables Figures J I J I Back Close Full Screen / Esc
Print Version Interactive Discussion
© EGU 2003 observed on the other days.
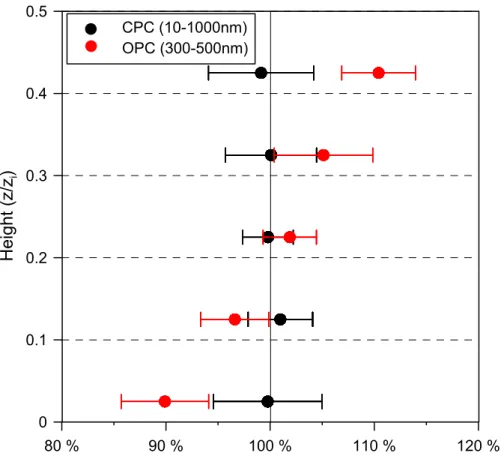
During three flights, the CPC and OPC were run in parallel. Of the resulting 10 pro-files, some show different vertical trends for different particle sizes (Fig. 9). It indicates that particles of the sizes most interesting for nucleation events may have an opposite gradient than larger particles. Summarising both figures, no indication for preferred
5
particle formation above the surface layer or in the free troposphere appears, contrari-wise the results indicate that the formation of new particles happens throughout the boundary layer in a more or less homogenous pattern. In this context Stratmann et al. (2003) measured with two CPCs with different cut-offs (5 and 10 nm) homogenous distribution of particles with Dp = 5 − 10 nm in the mixed boundary layer during an
10
event day near Leipzig, Germany.
More information of this type (especially measurements of particles <300 nm) during nucleation events may provide valuable data for the interpretation of particle formation. As the results indicate, such efforts ideally would include not only measurements of particle numbers, but also information about the size distribution.
15
3.2. Precursor measurements 3.2.1. Ozone, SO2and NOx
The concentrations of different gases (O3, NOx and SO2) monitored continuously in Hyyti ¨al ¨a SMEAR II were analysed for the time of the OSOA field campaign (at 16 m level) and plotted as half-hour average values in Fig. 10. During the experiment the
20
ozone concentrations were varying between 10 and 40 ppb with a clear diurnal profile. However, there were no visible trends of higher or lower values at times of new particle formation, neither in the daily maxima nor in the gradients prior to the particle bursts (d [O3]/d t).
NOx and SO2 concentrations were varying during the campaign between 0.068 to
25
2.98 ppb and below detection limit to 1.34 ppb, respectively. If we compare the concen-trations of NOx with the wind-direction from Fig. 6, we recognise higher values during
ACPD
3, 3769–3831, 2003
Overview of the field measurement campaign in Hyyti ¨al ¨a
M. Boy et al. Title Page Abstract Introduction Conclusions References Tables Figures J I J I Back Close Full Screen / Esc
Print Version Interactive Discussion
© EGU 2003 the times, when probably more polluted air masses from Southwest (also with high
values in aerosol condensational sink – see Fig. 2) arrived at the station. So the first three clear event days in the beginning of August show the lowest concentrations of NOxand also SO2. The other events later on are more polluted with 2 to 4 times higher values for both gases. Gao et al. (2001) found in four chamber experiments during the
5
reaction of ozone with α-pinene including SO2 ([Ozone]=95, 110, 110 and 100 ppb, [α-pinene]=16, 15, 15 and 15 ppb and [SO2]=<0.1, 0.5, 2.5 and 6 ppb) a direct corre-lation between increasing SO2concentrations and measured number concentration of new-formed particles (N=14, 73, 187 and 380 103particles cm−3). This result seems to be in contradiction to our measurements. Although SO2(or the oxidised form H2SO4)
10
is involved through binary or ternary nucleation in the formation of TSCs, in the real at-mosphere the influence of other parameters like for example the number concentration of pre-existing particles may be more important for the formation of new aerosols than the varying in SO2concentration.
3.2.2. VOC measurements on tethered balloons
15
During the OSOA field campaign a total of 80 VOC samples were collected onto car-tridges from balloon platforms. In addition, VOC probes were taken on the SMEAR II mast at heights between 23 and 43 m above ground. The goal of these measure-ments was to determine fluxes of biogenic VOC, terpenes in particular, at both local and regional scales.
20
The analyses of the balloon samples focused on monoterpenes and isoprene. Ter-pene concentrations in the PBL during that period were in the order of a few ppts, with
α-pinene, limonene,∆3-carene and camphene as the major compounds. Isoprene was
also found in most samples, although at lower concentrations than monoterpenes. In comparison to earlier measurements at Hyyti ¨al ¨a, the contribution of α-pinene to the
25
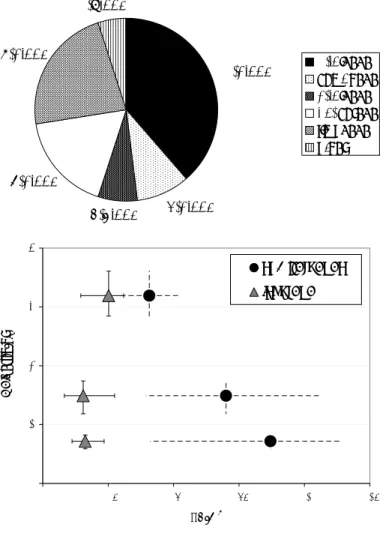
sum of terpenes was smaller in these PBL-measurements (Fig. 11a). Averaged VOC profiles within the PBL showed a decreasing trend with height, as would be expected for gases with a source at the surface (Fig. 11b).
ACPD
3, 3769–3831, 2003
Overview of the field measurement campaign in Hyyti ¨al ¨a
M. Boy et al. Title Page Abstract Introduction Conclusions References Tables Figures J I J I Back Close Full Screen / Esc
Print Version Interactive Discussion
© EGU 2003 Daily averages of all VOC samples taken within the PBL are shown in Fig. 12. Days
with particle formation events (2, 3 and 7 August) had low terpene concentrations. Note however, that a direct comparison of days is difficult, as the temporal coverage with balloon soundings varies significantly from day to day.
The VOC measurements from balloons were used to derive fluxes of biogenic VOC.
5
The footprints of fluxes obtained from measurements in the PBL are of the order from tens to hundreds of square kilometers, depending on the method applied. Uncertainties of fluxes determined in this way are largely due to the various assumptions included (Guenther et al., 1996). For example, homogenous emissions are assumed within the footprint area, a condition that is most commonly violated in practice. Landscape
10
fluxes therefore need to be determined from averaged VOC profiles reflecting various conditions and wind directions. As a consequence, the advantage of deriving a flux representative for the scale of a whole landscape is accompanied by limited temporal information about the flux.
The mean terpene fluxes as derived from balloon measurements between 2 August
15
and 12 August were between 140 and 300 µg C m−2h−1, depending on the method applied. Assuming the discrepancy is mainly a consequence of the different footprints of the methods, we conclude that terpene emissions averaged over a region of sev-eral hundreds of km2 surrounding Hyyti ¨al ¨a are less than those of the region covering tens of km2 close to the site. The same trend of lower emissions with increasing
20
footprint area exists in the comparison of balloon results with measurements from the mast. The average of the terpene fluxes determined from gradients on the mast on 15 August was 330 µg C m−2h−1. This corresponds to a basal emission rate (30◦C) of 900 µg C m−2h−1; a value similar to earlier flux measurements on the tower (Rinne et al., 2000).
ACPD
3, 3769–3831, 2003
Overview of the field measurement campaign in Hyyti ¨al ¨a
M. Boy et al. Title Page Abstract Introduction Conclusions References Tables Figures J I J I Back Close Full Screen / Esc
Print Version Interactive Discussion
© EGU 2003 3.3. Chemical characterisation of photo-oxidation products of VOCs in the gas- and
particle-phase
Chemical analyses of the gas and particle-phase were performed in order to study the distribution of measured species.
3.3.1. Carboxylic acids and carbonyls
5
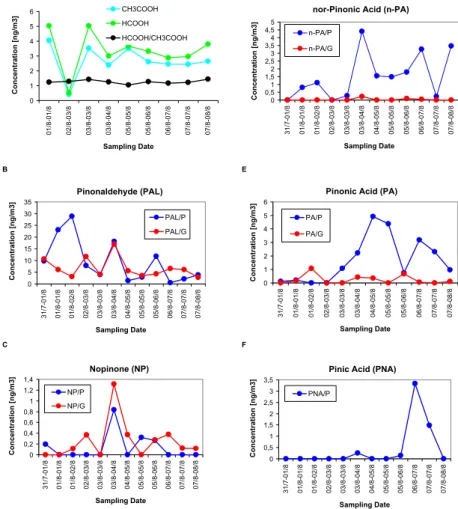
The concentrations of gas-phase carboxylic acids observed during the campaigns were measured by two independent groups (ECPLUC – Environmental chemical processes Laboratory, Greece and UVAR – Universidade de Aveiro, Portugal). The results are shown in Fig. 13 and Table 3. The data collected by ECPLUC, concerning the gaseous concentration of small carboxylic acids support the hypothesis that biogenic emissions
10
are the main sources of atmospheric formic and acetic acid. The concentration of formic acid ranged from 0.52 up to 5.04 µg m−3(6.8–66 109molecules cm−3) while the corresponding concentration for acetic acid ranged from 0.41 up to 4.06 µg m−3 (4.1– 41 109molecules cm−3). The general trends in both formic and acetic were similar showing a high degree of correlation (Fig. 13a) suggesting that their sources should
15
be closely related. The formic to acetic ratio varied from 1.04 to 1.43, indicating thus predominance of formic acid in the forested area of Hyyti ¨al ¨a. This comes in accordance with the observations by Chebbi et al. (1996) that formic acid is the main product of isoprene and monoterpenes (emitted by trees) oxidation by ozone. The same trend has been observed in a previous study in a Eucalyptus forest in Portugal (Kavouras et
20
al., 1998). Photochemical production (that favours formic acid) seems to play a more important role than direct emissions from vegetation (that favour acetic acid). Acetic acid concentrations can be increased by anthropogenic emissions (Kawamura et al., 1985) and/or biomass burning (Talbot et al., 1987) this seems not to happen in the investigated area. Measurements of the same acids conducted by UVAR resulted in
25
lower concentration ranges, namely from 0.15 up to 1.26 µg m−3 for formic acid and from 0.21 up to 1.82 µg m−3 for acetic acid. The UVAR measured concentrations of
ACPD
3, 3769–3831, 2003
Overview of the field measurement campaign in Hyyti ¨al ¨a
M. Boy et al. Title Page Abstract Introduction Conclusions References Tables Figures J I J I Back Close Full Screen / Esc
Print Version Interactive Discussion
© EGU 2003 formic acid mostly lower than acetic acid, but in some samples with low acidic content,
the levels of formic acid were also higher than acetic acid. The highest concentrations occurred between 4 and 13 August. Both laboratories observed a predominance of maxima during daytime and minima during nighttime (Fig. 13a).
Formaldehyde presented a smooth diurnal variation with maxima during daytime and
5
minima during nighttime. Acetaldehyde and acetone exhibited also a predominance of daytime maxima. Nevertheless these carbonyl compounds presented the highest con-centrations during nighttime. Acrolein exhibited a strong daily variation of concentra-tions with maxima during nighttime and minima during daytime. The most pronounced variation occurred between the 7 and 11 August. Propionaldehyde didn’t present a
10
characteristic diurnal variation and the highest concentrations of hexanaldehyde were observed mainly at night.
3.3.2. Gas/particle partitioning of photo-oxidation products
The volatile and semi-volatile of the polar and acidic fractions in both particulate and gas phase were analysed. A series of monoterpene-skeleton photo-oxidation
car-15
bonyl and acidic compounds were detected and quantified in both gas and particles over the Hyyti ¨al ¨a forest. In particular, 6,6-dimethyl-bicyclo[3.1.1]heptan-2-one (re-ported as nopinone) and 2,2-dimethyl-3-acetyl-cyclobutyl-ethanal (re(re-ported as pinon-aldehyde), 2,2-dimethyl-3-acetyl-cyclobutyl-formic acid (reported as nor-pinonic acid), 2,2-dimethyl-3-acetyl-cyclobutyl-acetic acid (reported as pinonic acid), and
cis-2,2-20
dimethyl-3-carboxy-cyclobutyl-acetic acid (reported as pinic acid) were identified on the basis of their CI and EI mass spectra and comparison with authentic standards (Fig. 13b–f). These compounds have been determined as characteristic products of the photo-oxidation of α- and β-pinene with ozone, OH and NO3 radicals, in labora-tory studies. Pinonaldehyde and nopinone have shown for most of the sampling days
25
higher gas- than particle-phase concentrations. Nighttime reactions of pinenes with NO3 radicals eventually contributed to the relatively elevated concentration of pinon-aldehyde in the particulate phase. For pinonic, nor pinonic and pinic acids, particle
ACPD
3, 3769–3831, 2003
Overview of the field measurement campaign in Hyyti ¨al ¨a
M. Boy et al. Title Page Abstract Introduction Conclusions References Tables Figures J I J I Back Close Full Screen / Esc
Print Version Interactive Discussion
© EGU 2003 concentrations were higher than the corresponding concentrations in the gas phase.
Pinonic acid is produced through the reaction of α-pinene with both OH radicals and ozone, and pinic acid is mainly formed through the reaction of α- and β-pinene with ozone. The concentration levels of pinonic acid and pinic acid show that the first is produced faster and in higher amounts than the second under real conditions. Thus, it
5
is clear that the atmospheric concentration of OH radicals and ozone has an effect on the composition of organic aerosol produced through the atmospheric photo-oxidation reactions. The data show the preference of the above discussed carboxylic acids to the particle phase and eventually their ability to condense under certain atmospheric conditions.
10
3.4. Chemical characterisation of photo-oxidation products of VOCs in Hyyti ¨al ¨a aerosols
Chemical analyses of fine particles (PM2−10) were performed by three groups with different sampling and analytical techniques, which gave the chance to compare the results of some measured species.
15
3.4.1. Organic aerosols PM10analysis
Carbonaceous aerosol was one important component of the aerosol at the studied lo-cation. Organic carbon accounted for 27% of the PM10mass concentration in Hyyti ¨al ¨a. Adding the contribution of black carbon, the share of total carbon reaches 34%. Us-ing the dichloromethane-extraction procedure 31% of the organic carbon could be
ex-20
tracted. The addition of the water-extract increased this ratio to 52%, which is compa-rable to the 48% obtained during the short-term experiment (Alves et al., 2002).
On average the fraction of secondary carbon in the Finnish aerosol accounted for 71% of the organic carbon, which corresponds to 19% of the PM10 mass concentra-tion. Secondary organic carbon was calculated by subtracting primary organic carbon
25
ACPD
3, 3769–3831, 2003
Overview of the field measurement campaign in Hyyti ¨al ¨a
M. Boy et al. Title Page Abstract Introduction Conclusions References Tables Figures J I J I Back Close Full Screen / Esc
Print Version Interactive Discussion
© EGU 2003 and black carbon is 1.1 (Castro et al., 1999). In some periods the fraction of secondary
organic carbon showed clear maxima during daytime and minima during nighttime. This is an obvious indication of local or regional formation of secondary aerosol, be-cause even the interference of wood burning emissions, which is higher at night, did not cause the rise of the values calculated for night periods.
5
The total concentration ranges and carbon preference indexes (CPI) for n-alkanes, n-alkanols and n-mono-carboxylic acids are presented in Table 4. CPI is a diagnostic parameter, where a value higher than 3 indicates the major incorporation of recent bio-logical constituents into the aerosol sample. The input of anthropogenic contaminants reduces the CPI, such that values of approximately 1 reflect the significant
introduc-10
tion of contaminants with human origin. Cmax can also give an indication of relative source input and serves as a regional parameter of vascular plant contributions to the atmosphere (Abas and Simoneit, 1996). The distribution of the n-alkanes ranged from C16 to C34, with Cmaxequal to 27. Odd carbon number predominance was found, es-pecially in the range Cn>23, wherein odd carbon number alkanes represent a primary
15
major contribution of vascular plants waxes (Abas and Simoneit, 1996). The isoprenoid hydrocarbons derived from petroleum (pristane and phytane) were also detected.
The most representative PAH in the sampling site was indeno[1,2,3-cd]pyrene, benzo[b+k]fluoranthene, benzo[a]anthracene, benzo[e]pyrene and benzo[a]pyrene. On average in the Finnish samples the total concentration of PAH (8.9 ng m−3) was
20
lower than those from the previous short-experiment in Finland (17 ng m−3, Alves et al., 2002).
Carbonyl compounds including linear homologues were detected. However, the discontinuity of the series makes impracticable the application of the CPI parameter for linear compounds. Table 5 presents the biogenically derived compounds detected
25
in the samples, which includes some carbonyl compounds. Pinonaldehyde, 6,10,14-trimethyl-2-pentadecanone and abieta-8,11,13-trien-7-one presented the highest con-centrations in Hyyti ¨al ¨a. During the previous short-term experiment in Hyyti ¨al ¨a, pinon-aldehyde was more abundant (6.6 ng m−3; Alves et al., 2002) and
trimethylpentade-ACPD
3, 3769–3831, 2003
Overview of the field measurement campaign in Hyyti ¨al ¨a
M. Boy et al. Title Page Abstract Introduction Conclusions References Tables Figures J I J I Back Close Full Screen / Esc
Print Version Interactive Discussion
© EGU 2003 canone was not a ubiquitous component of the aerosol. Nopinone and monoaromatic
carbonyls, including benzaldehyde, were detected in all the experiments.
The homologous compound series of n-alkanols ranges from C11 to C30 in the Finnish site. The most abundant homologue was C26 and strong primary contribu-tions of vascular plants waxes were found. Sterols were also present in the samples
5
(Table 5).
The n-alkanoic acids are one of the dominant components in the extractable lipids. The homologous compound series range from C8 to C32 with an even carbon number predominance. The samples present a predominance of Cmaxat n-C16that may reflect an enhanced primary microbial component and a less pronounced variable maxima for
10
carbon number higher than 22. Alkanedioic acids were present in the aerosol samples from the Hyyti ¨al ¨a forest in a discontinuous series ranging from hexanedioic acid to docosanedioic. Nonanedioic was the most abundant constituent of this class and it has been suggest to be formed by photo-oxidation of oleic and linoleic acids (Yokouchi and Ambe, 1986; Kawamura and Gagosian, 1987, Stephanou and Stratigakis, 1993),
15
which were also detected in the samples. Acids resulting from the photo-oxidation of pinene were also present in the aerosol phase (Table 6). Resin acids were also detected.
The compounds detected in the water-extract were polyhydroxy-, mono- and dicar-boxylic acids, polyhydric alcohols (polyols) and sugars. The most representative
in-20
dividual compounds were malic acid, mannitol, arabitol, glucose and sucrose. Lev-oglucosan (1,6-anhydro-β-D-glucopyranose) was also detected in the water-extract, though it is extracted predominantly by dichloromethane in the first extraction stage. This anhydrosugar is considered a specific tracer of biomass burning, which results from the depolymerization of cellulose at temperatures above 300◦C (Simoneit et al.,
25
1999). Table 6 also shows the concentration ranges for some water-extractable or-ganic compounds. A more detailed discussion on the sources and size distributions of water-extractable organic compounds can be found elsewhere (Carvalho et al., 2003).
ACPD
3, 3769–3831, 2003
Overview of the field measurement campaign in Hyyti ¨al ¨a
M. Boy et al. Title Page Abstract Introduction Conclusions References Tables Figures J I J I Back Close Full Screen / Esc
Print Version Interactive Discussion
© EGU 2003 3.4.2. Photo-oxidation products determination in PM2and PM2.5
The analysis of PM2and PM2.5 measured in aerosol samples from Hyyti ¨al ¨a were per-formed by two independent groups. Group one (Institut f ¨ur Specktrochemie, Germany) detected and quantified a series of organic acids, which originated from terpene (α-pinene) oxidation. The results are shown in Fig. 14. These acids, verified by
com-5
mercially available standards, were norpinic, pinic and pinonic acid. Since their volatile precursors are of biogenic origin these low volatile substances can be used as marker compounds for the natural fraction of the tropospheric secondary organic aerosol. The concentrations of these compounds were mostly between 0.2 and 8 ng m−3(for pinonic acid: ≈6.6 105 and 2.6 107molecules cm−3). The C10-ketocarboxylic acid – pinonic
10
acid – shows most times higher concentrations than the C9-dicarboxylic acid – pinic acid. Norpinic acid – a C8-dicarboxylic acid – is found at the lowest concentration levels, often below the detection limit.
The results from group two (Max-Planck-Institut f ¨ur Chemie, Germany) are summa-rized in Table 7. Their measured average concentrations of pinic, pinonic and
nor-15
pinonic acid were almost identical to the values from group one (0.3 to 8.1 ng m−3). Furthermore, sabinic, caric and limonic acid were measured for the first time in am-bient aerosol samples with average concentrations of 1.9 and 10 ng m−3, respectively. They were identified by comparison with laboratory experiments. Sabinene, limonene and carene were reacted with ozone in a smog chamber and the particles were
col-20
lected.
Sabinic acid could be quantified in the Hyyti ¨al ¨a samples. However, caric and limonic acid coeluted in the HPLC, so the concentrations stated are the sum of both acids. Sabinic, limonic and caric acid were quantified using pinic acid as a standard. Their concentrations exceeded the concentrations of pinic, pinonic and norpinic acid on
sev-25
eral days. This shows that they have to be taken into account when assessing the contribution of terpene oxidation to secondary organic aerosol production.
an-ACPD
3, 3769–3831, 2003
Overview of the field measurement campaign in Hyyti ¨al ¨a
M. Boy et al. Title Page Abstract Introduction Conclusions References Tables Figures J I J I Back Close Full Screen / Esc
Print Version Interactive Discussion
© EGU 2003 thropogenic, of known and unknown compounds. The source can mean a source of
primary emissions, a source of the precursor substances and/or the mechanism of for-mation (e.g. oxidation by ozone). As an example, one correlation analysis is shown for pinic and pinonic acid in Fig. 15. As can be expected the concentration of pinic and pinonic acid shows a good correlation, since both compounds are formed from the
5
same precursor compound and both originate from identical degradation mechanisms. Furthermore, it can be seen that the average concentration of pinonic acid is almost 2 times higher than pinic acid.
Within the samples from Hyyti ¨al ¨a a signal was observed which indicated the pres-ence of a molecule with a molecular mass of 232 g mol−1. This compound was also
10
observed in chromatograms from oxidation experiments of α-pinene with NOx done in the CEAM-laboratory in Valencia as well as in samples from other laboratory ex-periments. Warscheid and Hoffmann (2002) suggested a structure based on online MSn experiments made during ozone oxidation experiments in a smog chamber, as shown in Fig. 16. The molecule contains a carboxylic acid and per-ester function and
15
consequently can be supposed to have a very low saturation vapour pressure.
3.5. Meteorology and solar radiation
The last point from the results presented in this publication gives an overview of the meteorological situation during the campaign including the solar radiation. Figure 17 shows for all events half-hour average values of relative humidity, short wavelength
irra-20
diance (300–340 nm) and vertical wind variance, which is proportional to the amount of turbulent kinetic energy and indicates the strength of the mixing process. Table 8 con-tains characteristic values of these parameters for all days of the campaign including temperature. In agreement with the results presented by Boy and Kulmala (2002b) for a one-year data analysis at Hyyti ¨al ¨a, Finland the relative humidity is lower during
pe-25
riods of particle bursts or decreases in front of the nucleation onset. The same result concerning the influence of water molecules was investigated by Bonn et al. (2002) in laboratory experiments: Ozonolysis of monoterpenes and especially of exocyclic
ACPD
3, 3769–3831, 2003
Overview of the field measurement campaign in Hyyti ¨al ¨a
M. Boy et al. Title Page Abstract Introduction Conclusions References Tables Figures J I J I Back Close Full Screen / Esc
Print Version Interactive Discussion
© EGU 2003 monoterpenes (β-pinene and sabinene).
According to Boy and Kulmala (2002a) we choose short wave length irradiance (Es) measured with a radiospectrometer as the determinant radiation factor in this analysis. All event days show roughly the same behaviour with the appearance of the particle bursts after Es > 6 W m−2. If we include in our consideration the time a new cluster
5
needs to grow to the detectable size of 3 nm (approximately 20 min with the growth rates from Table 2 – thin black line in Fig. 17) then the nucleation would start at all event days during the ascending part of the irradiance curve. Furthermore these estimated nucleation start times are coinciding with the onset of vertical wind variance and so the start of mixing different air masses from the residual and the surface layer.
10
In the end we will also include the temperature in our considerations. Although the solar radiation reaches higher values during the first three days of August compared to the rest of the campaign the diurnal mean values of the temperature especially on 1 and 2 August are about 5 K lower than on the other days. Without analysing any weather maps we can conclude that relatively clean and cold air from northwest passed
15
over the station during this period (see Figs. 2, 6 and 10). According to Nilsson et al. (2001a) nucleation in Hyyti ¨al ¨a occurs in arctic and to some extent in polar air masses, with a preference for air in transition from marine to continental air masses. The results from Nilsson et al. established during BIOFOR campaign in Hyyti ¨al ¨a, Finland agree completely with the first three events. However the other event days show different
20
meteorological situations.
4. Summary and conclusions
The main results of the OSOA field campaign are described in Sect. 3. Obviously two different kinds of meteorological situations appeared during this period. In the begin-ning of August (1st to 3rd) clean cold air masses – nucleation favouring conditions
25
– from northwest passed over the station (low values of NOx, SO2 and CS). During these days clear particle formation events with number concentrations between 600