Applicability of Lean Manufacturing and Quick Response Manufacturing
in a High-Mix Low-Volume Environment
by
Matthew J. Joing
Bachelor of Science in Mechanical Engineering, Northwestern University (1995)
Submitted to the Sloan School of Management and to the Department of Mechanical Engineering in Partial Fulfillment of the Requirements for the Degrees of
Master of Science in Mechanical Engineering and Master of Business Administration
In Conjunction with the Leaders for Manufacturing Program at the Massachusetts Institute of Technology
June 2004
@2004 Massachusetts Institute of Technology. All rights reserved.
Signature of Author
Departmen{ 4 l'hania)Engineering Sloan School of Management May 7, 2004 Certified by_
Stanley Gershwin, Thesis Advisor Senior Research Scientist, Department of Mechanical Engineering Certified by
ity Welsch, Thesis Advisor Professor of Statistics and Management Science, Sloan School of Management
Accepted by _
Margaret Andrews, Executive Director of Masters Program Slan School of Management Accepted by_
Aia.'- Criiadt,"Graduate Committee I MASOACHUS~E~TTS INT17UT5, Department of Mechanical Engineering
OF TECHNOLOGY
Applicability of Lean Manufacturing and Quick Response Manufacturing in a
High-Mix Low-Volume Environment
by
Matthew J. Joing
Submitted to the Sloan School of Management and the Department of Mechanical Engineering on May 7, 2004 in partial fulfillment of the requirements for the degrees of Masters of Business
Administration and Masters of Science in Mechanical Engineering.
Abstract
As today's manufacturers face increasing pressure to improve costs and compete globally, many are turning to the philosophy of Lean Manufacturing as exemplified by the Toyota Production System. Lean is most successful when production is characterized by a few high-volume products, but may not be the answer as the production mix increases and volume decreases. This thesis focuses on this high-mix, low-volume type of production in addition to two other key production system characteristics: demand variability and degree of customization. A
manufacturer's position along these four characteristics is very important to the applicability of Lean theory. The alternative philosophy of Quick Response Manufacturing (QRM) is compared to Lean and shown to offer a better fit in some cases. One such case where Lean does not fit neatly is circuit card assembly at Raytheon Systems Limited in Glenrothes, Scotland, where the author conducted his six-month LFM internship.
Five steps towards manufacturing improvement are focused on in this thesis: choosing metrics, reorganizing the factory, selecting lot sizes, implementing a production control strategy, and deciding on a material presentation method. The recommended steps to improve circuit card assembly include ideas from both Lean and QRM.
This mix of ideas was implemented at Raytheon before the end of the internship and resulted in marked improvement. On-time delivery and customer satisfaction dramatically improved while lead times and inventories dropped significantly. Using Lean Manufacturing as the sole
guideline for improvement was not appropriate for this particular manufacturing system. The final takeaway from the internship and thesis is that there is no one-size-fits-all manufacturing philosophy.
Thesis Advisor: Stan Gershwin
Title: Senior Research Scientist, Department of Mechanical Engineering Thesis Advisor: Roy Welsch
Acknowledgements
This thesis is dedicated to my wife, Sue, and my daughter, Caledonia, the two most important people in my life. Sue has supported me 100% since the day I was accepted to the LFM program. I cannot thank her enough for giving up so much in California for me to pursue this two-year adventure, which has culminated in this thesis.
Next I must thank the LFM program for giving me this opportunity. In particular, Don
Rosenfield, Bill Hanson, Nancy Young-Wearly, and Jeff Shao were very helpful during my six months in Scotland.
Other MIT representatives that I need to thank include my two advisors, Roy Welsch and Stan Gershwin, and Mary Barton, whose strong support throughout my internship was much
appreciated.
Next I thank some of my fellow LFM students who helped me during my internship - Michelle Berson, Satish Krishnan, and Matt Gates.
I also must thank: the contributors to an internet discussion group, who gave me a great deal of food for thought. The "Job Shop Lean" group on Yahoo! introduced me to Quick Response Manufacturing and really got me thinking about how much Lean really applies to a high-mix, low-volume environment.
Lastly I thank all the great people at Raytheon in the UK who were a part of my project. The internship was well defined from the start, thanks to my project sponsor, Alastair Blair, and my project supervisor, Gordon Scotland. Gordon was a true partner in my project and many of the
ideas in this thesis are a result of the many long discussions I had with Gordon over the course of the internship. I also want to thank him for giving me the opportunity of a real leadership
experience.
The success of the project was a true team effort. I felt very comfortable on the team early on and never was made to feel like the outsider. Specifically, I want to thank David Lawson, Gordon Dickson, Evelyn Loughlin, Mike Stone, Scott Bradley, Linda Brown, Nicola Dalrymple, Mark Duffy, Leslie Shepherd, Helen Henry, Norman Thompson, Linda Thomson, Alex Fleming, David McCallum, Stuart Cairns, Steve Busby, David Penn, and Jamie Fotheringham. There are many others at Raytheon who helped during my six months in Scotland, and I do not have space to name them all.
CMI Disclaimer
This publication is an output from a research project funded by The Cambridge-MIT
Institute("CMI"). CMI is funded in part by the U.K. government. The research was carried out for CMI by Massachusetts Institute of Technology. CMI can accept no responsibility for any information provided or views expressed.
Table of Contents
Abstract ... 3
A cknow ledgem ents...5
CM I D isclaim er...6
Table of Contents ... 7
Table of Figures... 9
1. Introduction ... 10
1.1. Thesis Structure... 10
1.2. Four K ey Production System Characteristics... 11
1.2. 1. M ix ... 11
1.2.2. V olum e ... 11
1.2.3. D em and V ariability ... 11
1.2.4. D egree of Custom ization... 12
1.3. Thesis H ypothesis ... 13
1.4. Case Study at Raytheon System s Lim ited... 13
1.4.1. Raytheon G lenrothes... 13
1.4.2. Circuit Card A ssem bly ... 13
1.4.3. Key Production System Characteristics of Circuit Card Assembly... 14
1.4.4. Circuit Card Production H istory ... 16
2. Literature Review ... 18
2.1. Lean M anufacturing ... 18
2.2. Quick Response M anufacturing ... 19
2.3. Production Control M ethods ... 21
2.3.1. Push vs. Pull... 21 2.3.2. M RP ... 21 2.3.3. K anban ... 22 2.3.4. CON W IP ... 22 2.3.5. POLCA ... 23 2.3.6. D rum -Buffer-Rope ... 24 3. M anufacturing M etrics...25
3.1. Cost, Quality, D elivery, Flexibility... 25
3.2. W aste vs. Lead Tim e... 25
3.3. W aste vs. Lead Tim e at G lenrothes ... 26
4. Factory Organization...30
4.1. Product G rouping ... 30
4.2. Physical Layout ... 31
4.3. Organizational Structure... 35
5. Lot Sizing Decisions ... 38
5.1. The EOQformula... 38
5.2. Lot Size of One ... 38
5.3. Effects ofaLot Sizes not Considered by EOQ...38
5.4. QRM Optim al Lot Size ... 39
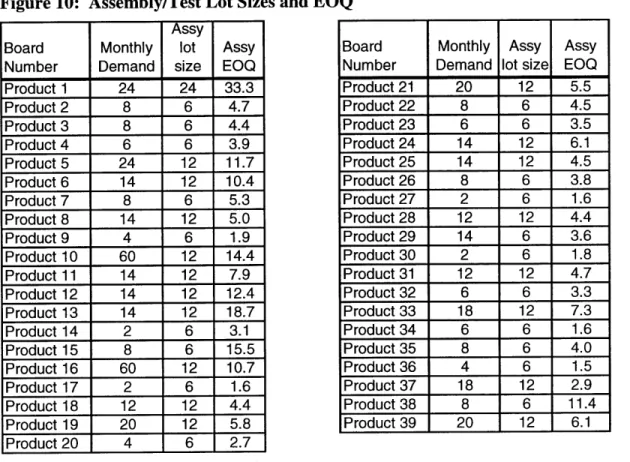
5.5. Lot Sizes in Circuit Card A ssem bly...40
5.6. Lot Size fiscussion Sum m ary ... 43
6.1. Lean Production Control: K anban... 44
6.2. Production Control Strategy for G lenrothes... 44
6.2.1. M odified Pull in Circuit Card A ssem bly... 45
6.2.2. Production Control A lternatives... 45
7. M aterial Presentation to the Line ... 49
7.1. Three M aterial Presentation Strategies ... 49
7.2. M aterial Presentation A nalysis... 50
7.3. Four A dditional Factors ... 50
7.4. Combining the Four Key Production System Characteristics with the Four Material Presentation Factors ... 51
8. Three Perspectives on O rganizational Processes ... 54
8.1. Strategic D esign Lens... 54
8.1.1. Organization Strategy... 54
8.1.2. Form al Organizational Structure... 54
8.2. Political Lens...55
8.2.1. Key Stakeholders... 55
8.2.2. Political Risks... 56
8.3. Cultural Lens ... 57
8.3.1. Sym bolic M eaning of the Project... 57
8.3.2. Cultural Change w ithin Circuit Card A ssem bly ... 57
8.3.3. Cultural Differences Between Scotland and America... 58
9. Conclusion and Recom m endations ... 59
9.1. Sum m ary of A nalysis... 59
9.2. Internship A ccom plishm ents... 60
9.3. Thesis A ssum ptions/A pplication Recom m endations... 64
Table of Figures
Figure 1: Key Production System Characteristics Continuum... 12
Figure 2: Process Routings for 30 Sample Circuit Cards... 15
Figure 3: Key System Characteristics for Glenrothes... 16
Figure 4: Response Time Spiral... 20
Figure 5: CCA Lead Time Trends... 29
Figure 6: CCA Layout with Cells ... 34
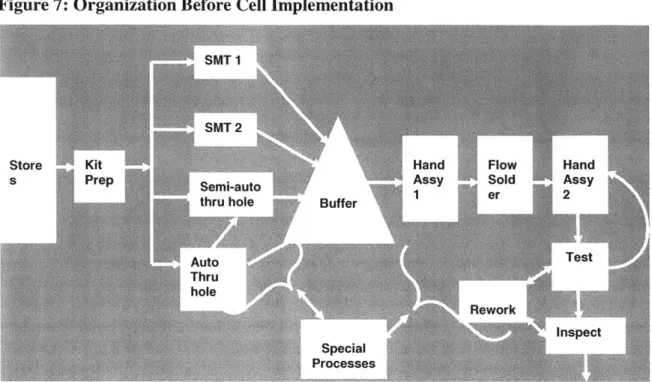
Figure 7: Organization Before Cell Implementation... 36
Figure 8: Organization After Cell Implemenation ... 36
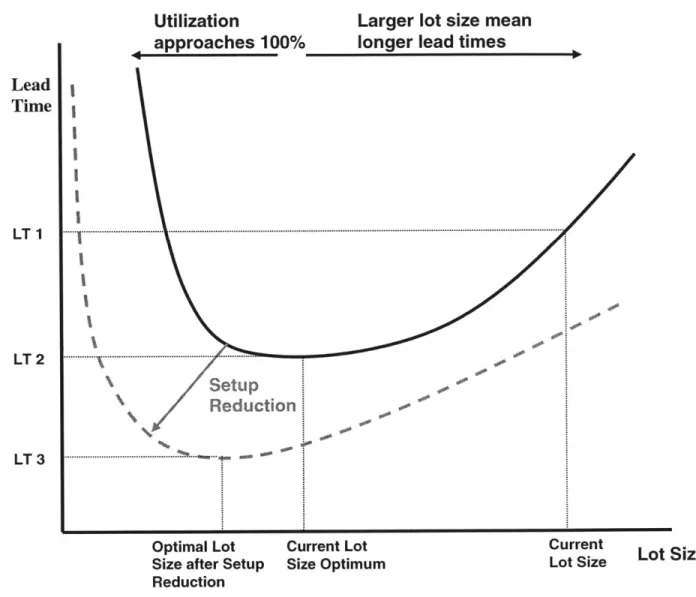
Figure 9: Lot Sizing/Setup Effects on Lead Time...40
Figure 10: Assembly/Test Lot Sizes and EOQ ... 42
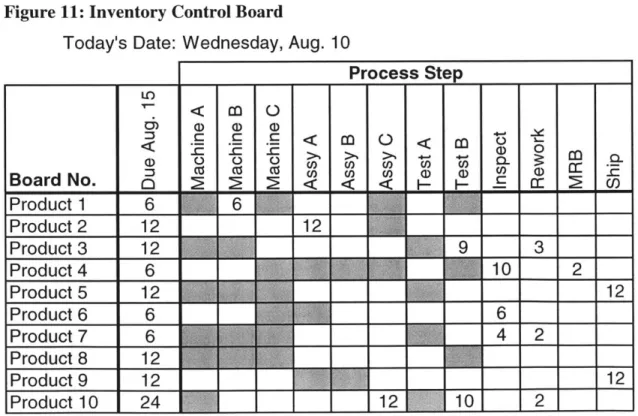
Figure 11: Inventory Control Board... 46
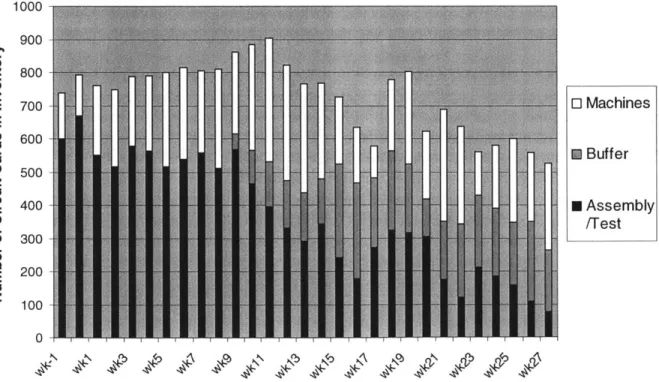
Figure 12: Family B Lead Time Progress ... 61
Figure 13: Family B Work-In-Process Inventory ... 62
Figure 14: On-Time Delivery ... 63
1. Introduction
As today's manufacturers face increasing pressure to improve costs and compete in a global marketplace, many are turning to the philosophy of Lean Manufacturing as exemplified by the Toyota Production System. TPS has been shown to simultaneously reduce costs, improve
quality and reduce product cycle times in many manufacturing environments. TPS is most successful when production is characterized by a few high-volume products, such as an automobile assembly line. However, as the production mix increases and product volume decreases, TPS may not be the answer.
This thesis focuses on this high-mix, low-volume type of production in addition to two other key production system characteristics: demand variability and degree of customization. A
manufacturer's position along these four characteristics is very important to the applicability of Lean Theory. The alternative philosophy of Quick Response Manufacturing (QRM) is compared to Lean and shown to offer a better fit in some cases.
1.1. Thesis Structure
The thesis is organized into four main sections. The first section contains Chapters 1 and 2 and provides some background. Chapter 1 defines the four key production system characteristics and introduces the idea that all manufacturers fall somewhere along a continuum for each of these characteristics. This chapter also provides background on the LFM internship project at Raytheon Systems Limited in Glenrothes, Scotland. Chapter 2 contains a literature review of Lean Manufacturing, Quick Response Manufacturing, and various production control methods. The second section explores the application of Lean and QRM as methods to improve
manufacturing performance. Five steps towards improvement are focused on: choosing metrics, reorganizing the factory, selecting lot sizes, implementing a production control method, and deciding on a material presentation method.' For each of these steps, the appropriate ideas from Lean and QRM are described. In addition, the application of these ideas in Glenrothes is
addressed. Glenrothes is a case study for the type of production environment where neither Lean nor QRM is a perfect fit. A careful analysis of the application of Lean principles and QRM principles in this environment shows that Lean works best is some cases and QRM in others. It is also shown that these two philosophies are not always mutually exclusive and can sometimes overlap or co-exist in some form to produce the best production system.
The third section of the thesis contains an analysis of the organizational change process during the internship. This is explored using three perspectives or lenses: strategic design, political, and
cultural. The final section of the thesis first captures the accomplishments over the course of the internship. It also includes a summary of the analysis of Lean and QRM and their application in Glenrothes. Lastly, some final recommendations for Raytheon Glenrothes are presented.
This is not a complete list of all possible improvement steps. The first four are critical to any manufacturing system improvement effort, while this fifth is included due to significant study during the internship.
1.2. Four Key Production System Characteristics 1.2.1. Mix
Mix refers to the number of different products that are produced within a certain production system. What makes one product "different" from another? One answer is the end product differences, such as number of parts, functionality, appearance, etc. This definition is not very useful, however, for the purposes of understanding mix within the production system.
A more appropriate method of understanding product differences here is to compare the different processes or steps that products must take as they move through production and the difference in processing time at each step. Two products may look different to the customer, but if they are produced with identical routings through the plant, require no setups from one product to the next, and require identical processing times, then these products are not really "different" and do not contribute to higher mix. However, two other products that appear to be similar might travel completely different routes through the factory, and even the processes they do share have unique setups and very different process times. These types of products contribute significantly to the factory mix.
1.2.2. Volume
Volume is the quantity of a product produced over a specific period of time. Knowing whether a product is high volume or low volume is difficult to define because it depends so greatly on one's perspective. To a company such as Intel that produces millions of semiconductor chips a year, a product with a 100-unit-per-month volume would be considered low volume. To the employees of a space satellite manufacturer, this type of volume would seem very high. They can usually count the number of products produced per month on one hand.
The most important aspect of product volume for this thesis is whether on not the product can be produced continuously in manufacturing without overproducing. For example, Intel's
microprocessors obviously fall into the high-volume category since the same product is run through the identical process routings day after day. Automobiles at Toyota also fall into this category. Even though 3-4 models are produced on one assembly line, the sequence is run continuously throughout the day. Any product that falls outside this is then by default low-volume.
Even this definition is not perfect because some products that might be produced continuously are run in batches by companies trying to reduce setup time and costs. The question that should be asked is: can this product be run on a dedicated line by itself or alongside other similar products without any significant changeovers? If the answer to this question is no, then it meets the requirement for low-volume.
1.2.3. Demand Variability
Demand variability is defined as the changes in customer demand over time. How different are the customers' orders between order cycles? The time between cycles could be fairly long (weeks or months) in slower-moving industries such as aerospace and defense or very short (hours in the case of Dell). The more the demand for specific products fluctuates from order to order, the higher the demand variability.
It is important to note that total demand could be relatively constant, but demand by product varies between order periods. If the demand differences occur on similar products with similar routings and processing times in the factory, then the contribution to demand variability is minimal. If these different products have very different routings and processing times, then the change in the "mix" of demand, even with the total demand remaining constant, will contribute to higher demand variability as defined in this thesis.
1.2.4. Degree of Customization
Manufactured products can be standardized on one end of the spectrum or customized on the other end. Standard content includes materials and parts that repeat between orders of a given product. Customized content refers to materials and parts that are unique to a particular order. The most extreme example of a customized product is one that is designed and produced only once. The international space station is such a product: although some components might have other uses, this is a one-of-a-kind product that is highly customized. On the extreme "standard" end of the spectrum are highly commoditized products such as basic fasteners and electrical
devices (capacitors, resistors). These products do not change from order to order. They remain unchanged over long periods of time and can be manufactured in a repetitive manner.
1.2.5. Key System Characteristics Continuum
The characteristics of mix, volume, demand variability, and degree of customization can be identified for a specific manufacturer and plotted on a continuum as shown in Figure 1.
Figure 1: Key Production System Characteristics Continuum
FAVORS LEAN FAVORS QRM
IMPLEMENTATION IMPLEMENTATION
Low Mix High Mix
High -L--- - Low
Volume Volume
Low Demand High Demand
Variability Variability
Low Degree of High Degree of
Customization Customization
It is very important to understand where a particular manufacturing system is located along this continuum for each of the key system characteristics when initiating improvements. Lean Manufacturing fits very well in environments that fall to the left on each of the four system characteristics. However, as the manufacturing system is characterized by increasingly higher mix, lower volume, higher demand variability, and higher customization, the appropriateness of
2
Lean Manufacturing diminishes. Another philosophy, Quick Response Manufacturing, is designed for systems whose key characteristics fall to the right on the Continuum.
1.3. Thesis Hypothesis
With the Key System Characteristics Continuum defined, the central hypothesis of this thesis can be stated in three parts:
1. Lean Manufacturing is applicable to low mix, high volume, low demand variability, low degree of customization environments, but is not necessarily applicable to all production environments.
2. Quick Response Manufacturing offers ideas that are more applicable than Lean to an environment that is characterized by high mix, low volume, high demand variability, and high degree of customization.
3. A mix of Lean and QRM philosophy is best in production environments that do not fall on the extreme ends of the Continuum.
1.4. Case Study at Raytheon Systems Limited
The applicability of Lean and QRM will be explored in an environment that does not fit neatly on either end of the Key Production System Characteristics Continuum: circuit card assembly at Raytheon Systems Limited in Glenrothes, Scotland. The author conducted his six-month Leaders For Manufacturing internship at this site. A number of changes were made to the manufacturing system at Raytheon based on the application of Lean and QRM improvement techniques.
1.4.1. Raytheon Glenrothes
The Glenrothes manufacturing plant is part of Raytheon Systems Limited, a company that encompasses all of Raytheon's facilities in the United Kingdom. The plant manufactures electronic systems for high-reliability applications for the government and industrial sectors. 1.4.2. Circuit Card Assembly
The internship was centered on the circuit card assembly (CCA) portion of the operations. This is also referred to in the industry as PCB (printed circuit board) assembly. The terms "board" and "card" will both be used to refer to a circuit card. The Glenrothes plant purchases the base PCB board along with thousands of components from other electronics manufacturers. The components are then assembled at the plant using a combination of automated and manual assembly techniques to create a completed circuit card. This card is then tested electronically for functionality and visually inspected before being shipped to the customer.
The technology used to assemble circuit cards has changed significantly over the past 20 years from mostly manual assembly to nearly 100% automated assembly, and from inserting
components through the board (through-hole) to placing components on top of the board (surface-mount). Raytheon Glenrothes assembles boards with a mix of these technologies because most of its circuit cards have a long product life cycle. Some cards produced at 2
This statement will be seen as controversial by many in the manufacturing community, where Lean is often seen as the appropriate philosophy for all types of manufacturing. The experience of the author while on this internship is evidence that Lean is less applicable in certain environments.
Glenrothes are still predominantly through-hole requiring almost 100% manual assembly. The main types of assembly equipment used at Glenrothes include SMT (Surface Mount
Technology), automated through-hole, and semi-automated through-hole. All surface mount components that are not placed by manual assembly are placed by SMT machines. This is the most productive method for assembling circuit cards.
Those through-hole components that are not inserted and soldered manually are fixed to the board using either an automated or semi-automated process. The automated through-hole process is about 30% as productive as SMT. Semi-automated through-hole equipment, which is sometimes needed because of it's capability to place a wider range of components than the auto-through-hole machine, is only 10% as productive as SMT. The manual assembly of components, which is predominantly through-hole, ranges widely in productivity but is always the least productive method for assembling circuit cards. Not all circuit cards pass through each one of these assembly stages, but a majority of them require at least two of these processes.
1.4.3. Key Production System Characteristics of Circuit Card Assembly
Glenrothes produces over 200 different types of circuit cards. This production is categorized as high-mix using the definition given in 1.2.1 because most of these cards travel different routes through the factory and processing times range from minutes on some cards to hours on others. Figure 2 shows the routings for a sample of 30 circuit cards.
Figure 2: Process Routings for 30 Sample Circuit Cards Process Number Product No. 1 2 3 4 5 6 7 8 9 10 11 12 13114 15 16 17 18 19 20 21122 Product 1 x xx x x x x x x x x Product 2 x x x x xx x x x x x Product 3 x x x x x x x x x x x Product 4 x x x x x x x x x x Product 5 x xxx x x xx x Product 6 x x xx x x x x x x Product 7 x x x x x x x xx Product 8 x x x x x x x x xx Product 9 x x x xx x x x x x Product 10 x x x x x x x x x x Product 11 x x x x x x x Product 12 x x x x x x x x x x Product 13 x x x xx x x x x Product 14 x x x x x x x x Product 15 x x x x x x x Product 16 x x x x x x Product 17 x x x x x x x x Product 18 X x x x x x x x Product 19 x x x x x x x x x x Product 20 x x x x x x x x Product 21 x x x x x x x x x Product 22 x x x x x x x x Product 23 x x x x x x x x x Product 24 x x x x x Product 25 x x x x x Product 26 x x x x x Product 27 x x x x x Product 28 x x x x x x x Product 29 x x x x x x x Product 30 x x x x x x x x
For example, Product 17 must travel through Processes 1, 2, 13, 15, 16, 17, 21, and 22 before it can be delivered to the customer. Some of these process steps are performed within one work center, but most are discreet processes. Also, circuit cards may repeat some steps if there are quality problems.
Volume per month at Glenrothes ranges from 2 to 200 cards per card type. This falls into the definition of "low volume" because there is not enough volume to support a dedicated line for any of these products. To further support the low volume categorization, the CCA industry identifies low volume as less than 30,000 circuit cards per year.
Most circuit cards are supplied to customers that build electronic systems on a long term
contract. These systems typically have a regular build schedule each month that is known weeks ahead of time. This means most circuit cards have a fairly stable demand and any demand changes will be known weeks in advance. There are exceptions to this. If a group of circuit cards fails at a customer, a new order for that card might come earlier than expected. However,
this does not happen very frequently. Therefore circuit cards in Glenrothes are best characterized by low demand variability.
Circuit cards at Glenrothes have a low degree of customization from order to order. Engineering changes do come through from time to time, but these can be planned for and managed on an exception basis. The vast majority of card types are built the same way every time.
These production characteristics for circuit card assembly can be plotted on the Key System Characteristics Continuum as shown in Figure 3.
Figure 3: Key System Characteristics for Glenrothes
FAVORS LEAN FAVORS QRM
IMPLEMENTATION IMPLEMENTATION
Low Mix High Mix
High Low
Volume Volume
Low Demand High Demand
Variability Variability
Low Degree of High Degree of
Customization Custorization
Glenrothes CCA's Position on the Continuum
Two of the characteristics fit a Lean implementation (demand variability and degree of customization), while two others fit a QRM implementation (high mix and low volume). The
right philosophy to improve manufacturing performance is not clear in this case. This gives us an excellent chance to explore how Lean and QRM concepts compare in a "mixed system characteristics" environment..
1.4.4. Circuit Card Production History
Circuit cards have been produced at the Glenrothes site for over a decade. Prior to the beginning of the LFM internship, two Raytheon UK circuit card assembly sites were consolidated into the Glenrothes facility. This more than doubled the variety and volume of existing cards.
Equipment from the other facility (referred to as Plant B or Customer B) was transferred to Glenrothes and production began six-months before the internship start date. Most of the cards transferred to Glenrothes were shipped to Plant B after assembly for inclusion in higher-level electronic systems. Thus Plant B became Glenrothes' largest customer of circuit cards.
The state of circuit card production at the beginning of the internship was not good by any measure. Plant B was already behind in orders before production was transferred, and a substantial increase in orders accompanied the transition. Quality was achieved through significant rework, a condition that remained unchanged after the transfer. The computerized planning (MRP) system was launching circuit cards into production to meet this backlog, clogging the floor with inventory. Significant time was being spent by production personnel, engineering, and management to expedite "hot" cards through the system. It was taking upwards of 12 weeks for a card to ship to the customer once it had started the assembly process. Finally, deliveries were late on nearly 40% of the circuit cards needed by Customer B.
An improvement team was created to tackle these problems. This team consisted of
representatives from numerous functions, including engineering, quality, operations, and supply chain. The author joined this team at the beginning of the internship. At this point, the team was in the midst of implementing Lean Manufacturing within circuit card assembly.
2. Literature Review 2.1. Lean Manufacturing
Lean Manufacturing is a term coined by James Womack, Dan Jones, and Daniel Roos in their book "The Machine that Changed the World", a study of the post-WWII auto industry. Womack and Jones showed that there was a marked difference between quality and productivity levels among American, European, and Japanese automakers, with the Japanese holding a clear advantage. This advantage can be traced to the manufacturing philosophy of the Japanese companies, with Toyota the prime example of how Japanese auto manufacturing differed from US or European producers.3 The Toyota Production System ("TPS"), as it is now known, is the
basis for Lean Manufacturing principles. A follow-up work by Womack and Jones, "Lean Thinking", generalizes Lean principles beyond auto manufacturing.
At its heart, Lean Manufacturing is the relentless pursuit of the elimination of "muda", or waste, in all parts of production. Waste is defined as any activity that does not provide value in the eyes of the customer. The seven wastes as defined by Taiichi Ohno, the founder of TPS, include overproduction ahead of demand, waiting for the next processing step, unnecessary transport of materials, overprocessing of parts due to poor tool and product design, inventories more than the
absolute minimum, unnecessary movement by employees during the course of their work, and production of defective parts.4
There are five steps in the journey towards Lean Manufacturing. The first is to define value from the customers' perspective. Most manufacturers include process steps that they feel are needed but are not valuable to the customer, such as quality checks or transferring inventory between
steps. Although these steps may be needed in the current production system, they do not add value in the eyes of the customer.5
The second step is to identify the value stream, which is the set of actions required to
manufacture and deliver a specific product. Ideally the value stream can be identified from the most basic raw materials all the way to the end customer that uses the product. This value stream "mapping" will uncover obvious wasteful activity that is clearly non-value added and can be eliminated immediately.6
The next step in a transformation to Lean is to make the remaining, value-creating stepsflow. Traditional manufacturing breaks work down to specialized steps that are very "efficient" when viewed in isolation. Products travel from department to department, waiting in front of
specialized machines before being processed in large batches. Lean thinking rejects this traditional manufacturing mindset in favor of the idea that material should flow smoothly between value-creating steps. Products should not be made in batches, but instead should move
3 James P. Womack, Daniel T. Jones, and Daniel Roos, The Machine That Changed the World, (New York: Harper Perennial, 1990)
4 James P. Womack and Daniel T. Jones, Lean Thinking, (New York: Simon & Schuster, 1996), 309-3 10
5
Ibid., 16-19
6
in single units through the factory waiting as little as possible and moving the least distance possible.7
The fourth step in a Lean transformation is to let the customer pull the product as needed rather than push products onto customers. In a perfect Lean value chain, no operation is started until the upstream operation indicates it is needed.
The last step is not one that can actually be implemented, but a goal to strive for: perfection. Perfection is achieved when all waste from a process has been eliminated and product flows effortlessly at the pull of the customer. This drive for perfection is what keeps companies like Toyota, who are far ahead of most of the competitors in terms of quality, cost, and profit margin, from becoming complacent. There is always more waste to uncover and never an end to
continuous improvement.9
Becoming "lean" is a major objective for many corporations, including Raytheon, the sponsoring company for the internship. Lean has been written about for nearly 15 years, but it still holds a strong appeal, particularly within LFM partner companies. Some form of Lean Manufacturing implementation was the subject of ten internships this year.
Lean is also at a point where its definition is becoming diluted. For many people, it has become synonymous with anything good for manufacturing - if you are improving manufacturing, it must be getting leaner. It also is purported to be universally applicable. The authors of Lean Thinking do not suggest limiting the application of Lean to any particular type of manufacturing system. To Womack and Jones, all products and even services would be improved by applying the five Lean steps. This has given rise to a mantra by many companies that they must get "lean" in all products and processes. The executives at these companies may not be quite sure what that actually means, but they do believe their business will be better off for it.
2.2. Quick Response Manufacturing
Quick Response Manufacturing is a manufacturing philosophy exhorted by Professor Rajan Suri at the University of Wisconsin. He authored the book "Quick Response Manufacturing: A Companywide Approach to Reducing Lead Times" in 1998 that explains what QRM is, where it is applicable, and how to implement it in manufacturing. In a nutshell, QRM is the pursuit of ever decreasing lead times, with lead time defined as the time it takes from customer order to fulfillment of that order."I
Suri suggests that this singular focus on lead time is the right strategy for certain companies or certain markets. These companies are characterized by a high variety of different products that are produced in one manufacturing system, customers who demand highly customized products,
' Ibid., 21-24
8 Ibid., 24-25 9 Ibid., 25-26
' Rajan Suri, Quick Response Manufacturing, (Portland, OR: Productivity Press, 1998), 4
" The terms lead time and cycle time are taken to mean the same thing for the purposes of this thesis. The lead time or cycle time of a portion of the manufacturing process is defined as the average time it takes for a product to complete this portion of the process.
and where demand is highly variable.'2 The largest benefit with QRM is seen when the
customers for these products value short lead times from a supplier over long lead times. Quick Response Manufacturing is a way to drive down lead times to both create a competitive
advantage in the marketplace and improve the internal manufacturing operations. QRM starts with ten basic principles that debunk some widely held beliefs in most manufacturing companies. 3 Here a few examples:
" Do not attempt to operate with people and machines at full capacity: Operate at 70% to 80% capacity on critical resources to accommodate system variability.
* Do not focus on individual machine efficiencies to reduce lead time; instead, measure the reduction of lead times and make this the main performance measure.
* Do not place great emphasis on "on-time delivery" measures. Over time, this will work against lead time reduction. Instead, measure lead time - improvements in this metric will lead to improved on-time delivery performance.
* Scrap uantity discounts from suppliers and to customers and move towards smaller lot sizes.
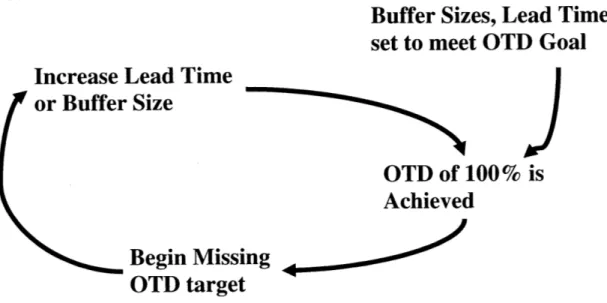
QRM uses system dynamics to help analyze a manufacturing system. The most important concept to understand using this approach is the "Response Time Spiral" shown in Figure 4.
Figure 4: Response Time Spiral
OTD
Goal
Set at 100%
Buffer Sizes, Lead Times
set to meet OTD Goal
Increase Lead Time
or Buffer Size
OTD of 100% is
Achieved
Begin Missing
OTD target
Most companies rely heavily on on-time delivery as a primary metric for factory performance. They also usually place emphasis on efficient machines/work centers that are highly utilized.
12 Rajan Suri, "Quick Response Manufacturing: A Competitive Strategy for the 2 1" Century" (Proceedings of the
2002 POLCA Implementation Workshop, 2002), xiv
" Suri, 1998, 18-22
Machines running at near capacity tend to create significant queues in front of them, which drives up lead times. Over time companies find themselves missing deliveries because the desire to operate the system near peak capacity works against the on-time delivery goal. A factory manager's response to slipping on-time delivery metrics is usually to ask his/her management for longer promised lead times to customers. Senior management often goes along with this
reasonable request because the factory seems to be running very "efficiently" (i.e., each work center is highly utilized). In order to avoid serious customer service issues, the promised lead time is lengthened or the product is excessively buffered. As this cycle repeats over time, lead times continue to grow. 5
Certain steps are needed to implement QRM. After making lead time the driving metric, production must be reorganized away from functional centers and into product-focused cells.'6
The next step is to change to lot sizes that minimize lead time.17 Then a new production control
system can be implemented, with the MRP system being used for material planning and a unique system called "POLCA" used to manage the flow of products through the factory.18
QRM is much less well known and widely used than Lean Manufacturing. This is
understandable for two reasons; Lean has been around longer, but more importantly, Lean is seen as universally applicable to all manufacturing systems. QRM does not purport to fit all
manufacturing systems, but those that are high mix, low volume, with highly variable demand and highly customized orders.
2.3. Production Control Methods 2.3.1. Push vs. Pull
The five different methods for controlling the movement of product from the beginning to the end of production described in this section of the thesis can all be characterized as either a push or pull system (or some combination of the two.) In a basic push system, product that completes one process step is pushed to the next step. Production does not stop as long as there is product awaiting that process step. Inventory is allowed to build up in front of less productive machines in this type of system.
In contrast to a push-style of production control is pull. In a basic pull system, production does not commence at a specific processing step until the downstream process sends a signal, usually in the form a certain level of inventory between the processes. Product might be waiting in front of that processing step, but production cannot commence until the downstream process
"demands" it. 2.3.2. MRP
Material Requirements Planning (MRP) is a computerized system that is typically laid on top of a traditional "push" manufacturing system with a functional layout. A functional layout is one where like machines are grouped together in "work centers" or "departments." Products usually
" Suri, 1998, 53-67
16 Ibid., 89-91
17 Ibid., 165-173 8 Ibid., 246-247
need to pass through many of these work centers, and managing what product goes to what work center when becomes a daunting task as the number of work centers and products increase. Many companies have implemented an MRP system to handle this complexity. An MRP system
can be programmed with the routings of all products and a reasonable time for each product to pass from one work center to the next. By combining these routings and processing times, a promised lead time can be generated for every product that starts on the factory floor.
MRP systems can run into problems because of the variability that is present in every
manufacturing system. Any hiccup in production, such as a machine going down or a process taking quite a bit longer than expected, starts a ripple in the system that usually magnifies. The product that gets behind will now reach the next work center at a different time than originally planned. This work center might now be working on the next product that MRP has planned, so either this must be broken into or the other product must be delayed further. As the variability effects add up, products get behind schedule and need to be expedited through the system. There are improved MRP systems that deal with variability more effectively. But rather than try to put a band-aid on a poor production control system, many companies use simpler, less
computerized production control systems that work more effectively. 2.3.3. Kanban
The first of these lower-tech alternatives is Kanban, the production control method used for Lean Manufacturing and the most widely used form of "pull". In order for Kanban to be implemented, production must be organized in such a way that a product or group of products follows the same sequence through the factory on dedicated equipment.
Kanban works by limiting the inventory between each step in a production process. Cards are created for each process step. Work cannot begin at a particular step until that step receives a card from the upstream process. Work therefore does not build up between work centers because the number of cards is limited. Kanban is the ultimate form of "pull" production because every step waits from the downstream step to signal or pull material rather than just produce what is placed in front of the process.
Kanban creates a very tight production system that is intolerant of variability. The failure of one step in the chain will quickly ripple through the system and shut down the other processes in the chain. An initial Kanban implementation will often result in poorer production performance
because of this. But Lean proponents insist this is only way to expose the problems in the process and eliminate the variability instead of living with it.
2.3.4. CONWIP
One alternative to Kanban is CONWIP, a production control strategy devised by Spearman, Woodruff, and Hopp.19 CONWIP stands for Constant Work In Process, and it operates by fixing the amount of inventory that can be on the factory floor at any one time. This limiting of
19 Mark L. Spearman, David L. Woodruff, and Wallace J. Hopp, "CONWIP: A Pull Alternative to Kanban," (Article Published in 2001)
inventory indicates it is form of pull production control. Usually this works by requiring that a
unit can only be issued to the line once another unit has completed production.20 The guiding principle behind CONWIP is Little's Law:
Average Lead Time = Average Inventory Average Throughput
This implies that with inventory fixed, lead time will change linearly with throughput. If demand is fairly constant over time (and a similar throughput is needed over time), then the easiest way to manage lead times is to fix inventory levels. The same principle is at work behind Kanban, but CONWIP allows more flexibility.
First, CONWIP does not specify where the inventory must collect in a system. Kanban puts a cap on inventory between each process step, while CONWIP just places an overall cap. This allows the inventory to collect before the constraint in the system and actually leads to a higher throughput than in a Kanban system. With Kanban, the constraint is starved more often than in a CONWIP system. CONWIP also is more flexible in that it does not require a dedicated process with linear flow. CONWIP could even be applied in a traditional functional environment.2 1
2.3.5. POLCA
The production control system favored by QRM is called POLCA (Paired-cell Overlapping Loops of Cards with Authorization), another form of pull. This system combines elements of
Kanban, CONWIP, and MRP to create what Dr. Suri believes is the best system for QRM-suited environments. A thorough explanation of POLCA would be very lengthy and not appropriate for
a literature review summary. A complete explanation can be found in Suri's 1998 book. With POLCA, Cards similar to Kanban are created for pairs of cells (or pairs of work centers). This allows for flexibility in the system so that products can take different paths through the factory (unlike Kanban). The number of cards is finite, capping the inventory in the system as in CONWIP. In order for production to begin at a particular process step, a card must be available and the work must be authorized by the MRP system. This authorization step is included to make sure a product that is well ahead of schedule does not tie up a process for a long time. Work that is on schedule or behind will not be blocked by the product that is ahead of schedule.
POLCA can work with a functional layout, but is made much less complicated by the
implementation of some groups of machines or processes into cells. POLCA is the system used between these cells. Suri does not specify the production control system to be used within the cells, so the complete production control system could be a combination of push and pull or just two different forms of pull.2 3
2 0
Ibid.
21 Ibid.
22 Suri, 1998, 243-255
3 Suri suggests using whatever production control method the cell team decides is best for their cell. This could be
2.3.6. Drum-Buffer-Rope
A fourth production control method is called "Drum-Buffer-Rope" or DBR. DBR uses a
combination of pull and push. This method is described in Eli Goldratt's book on the Theory of 24
Constraints. The first key element of this system is the "drum", or main constraint. This is the process step that has the least amount of excess capacity and controls the total throughput of the plant. The drum is scheduled to produce maximum output. In order to keep the drum from running out of parts to process, a buffer of inventory is maintained before the drum. The "rope" is a signal from the drum back to the beginning of the process that triggers the release of
material.
Downstream of the drum, product is pushed through to the end of production. This is not of great concern under the Theory of Constraints because the downstream processes should have plenty of excess capacity. Product should therefore flow rather quickly downstream of the drum even in push mode.
The part of the process between the drum and the rope is very similar to CONWIP production control. Setting a buffer level and linking the drum to the beginning of the process is just how CONWIP works. The main difference with Drum-Buffer-Rope is that the pace-setter is in the middle of the process and not the last production step.
3. Manufacturing Metrics
3.1. Cost, Quality, Delivery, Flexibility
Cost, quality, delivery, and flexibility are four of the most important attributes for determining the performance of a manufacturing system. Manufacturers would like to make the highest quality product at the lowest cost and deliver it exactly when the customer wants it. They also desire the flexibility to be able to change quickly with industry trends or changing customer demands.
For most of the 201h century, manufacturers believed each one of these attributes had tradeoffs. To achieve better quality, costs would have to rise. Costs could be reduced by automating processes, but this reduces flexibility. Delivery can be guaranteed with piles of finished goods inventory, but this inventory is an added cost for the company.
3.2. Waste vs. Lead Time
Significant changes to this "trade-off' idea occurred in the latter half of the twentieth century. Proponents of Lean Manufacturing claim that implementing Lean simultaneously improves quality, reduces cost, improves on-time delivery, and increases flexibility. This could be accomplished by the constant drive to eliminate waste from manufacturing. Toyota is a very good example of the positive effects of a Lean Manufacturing system on these four attributes. Toyota manufactures lower-cost, higher-quality cars than non-Lean auto manufacturers. They
also have the flexibility to produce multiple models on one assembly line.
Quick Response Manufacturing focuses on a different driving metric to improve manufacturing: lead time. Proponents of this philosophy believe that by reducing the time it takes to produce a product from order to delivery, total costs go down, and quality, delivery, and flexibility all improve. Products with very short lead times are simpler to manage, therefore overhead costs are low.
These two driving metrics of waste and lead time are not mutually exclusive. Lean systems usually result in much shorter lead times than the systems they replace. Systems that have implemented QRM contain much less waste than a non-QRM system. So why be so concerned about the particular metric one chooses to drive manufacturing improvement if they both produce the desired results? This will be explored in the context of CCA production in Glenrothes.
Another pertinent question is "Why does there have to be a focus on a single metric?" Why not use all four attributes of cost, quality, delivery, and flexibility as the basis for improvement? This is an option, but there are two reasons why a single metric is preferable over this approach. First, using four metrics can lead to an improvement in one metric over the detriment of the others. This is the "tradeoff" problem already mentioned. For example, a manager could see an opportunity to save on labor by reducing inspection costs, but quality may be negatively affected by this move. Second, a single metric creates a rallying point for everyone in manufacturing.
25
James P. Womack., Daniel T. Jones, and Daniel Roos, The Machine That Changed the World, (New York: Harper Perennial, 1990)
This leads to a focused workforce that is always looking for ways to eliminate waste (Lean) or drive down lead time (QRM).
If a manufacturer has identified its own production as being on the "Lean" end of the four characteristics of mix, volume, demand variability, and degree of customization, then a sole focus on waste is a very appropriate method to drive improvement. If, on the other hand, the manufacturing system has identified with being on the QRM end of the spectrum, then lead time is a more appropriate driving metric. What about manufacturers that fall somewhere in between, such as Raytheon Glenrothes? This is a much more difficult question, but can be explored using the internship as a case study to illustrate the effects of a focus on waste vs. a focus on lead time. 3.3. Waste vs. Lead Time at Glenrothes
Raytheon Glenrothes is characterized by high mix, low volume, stable demand, and standard products as explained in 1.4.3. The first two characteristics call for QRM methods, while the latter two fit a Lean production system.
At the beginning of the internship, the improvement team was operating under the "Lean Manufacturing" banner. It was assumed that Lean was the best production system for all environments, and that "Leaning" out circuit card manufacturing would lead to improvement. Following the Lean methodology, the team began to identify the various wastes in the system. In a typical Lean implementation, a value stream map is created as a guide to identifying which parts of the process are value-adding and which are waste. This map shows all the production
steps and information flows needed to complete a product. Raytheon's method for implementing Lean deviated somewhat from strict Lean principles here because a formal value stream map was not created. Waste was identified in a less formal manner, and the subsequent steps of the Lean implementation process, creating flow and pull, were emphasized.
Certain waste was identified by the Lean implementation team through brainstorming sessions without the help of the value stream map. The wastes that were focused on can be put into the following priority list:26
1. Unnecessary movement of employees 2. Overproduction ahead of demand 3. Unnecessary transport of materials 4. Production of defective parts
5. Excess inventories
The wastes of waiting for the next step and overprocessing because of poor tool/product design were not addressed with the initial Lean efforts.
Unnecessary Movement of Employees
This was seen by management as the largest source of waste in production. They often observed operators talking to each other about non-work related topics outside of break times and wasting time by looking for parts or production instructions. Direct labor was a very important factor in
26 This list has been created ex-post. This priority was not formally used during implementation, but does represent the relevant importance of the various types of waste to the team.
the calculation of total product cost, so any time wasted by the operators hit the bottom-line directly.
This waste was addressed by a number of initiatives. The first of these was the creation of accurate, easily accessible production instructions in the manual assembly portion of the process. This is commonly referred to as "standard work" in the Lean lexicon. The second was a change to the way material was presented to the line to reduce the need to "hunt" for parts. This is explored in detail in Chapter 7. Other proposals involved some form of better supervision to prevent the personal conversations between operators, but no significant action was taken on this front.
Overproduction Ahead of Demand
The main tool to address overproduction ahead of demand was to implement a pull system, which is described in detail in Chapter 6. As part of the initiative to reduce overproduction, all product that was on the production floor that was deemed not needed in the next month was pulled back to an upstream "buffer" of inventory.
Unnecessary Transport of Materials
This was addressed in two ways. The first was the layout of the production floor. Machine and assembly workstations were all located in the same footprint on the production floor so that product never had to leave that part of the building from start to finish.2 7 This was effective in minimizing travel distances. The second was the implementation of point of use materials. (Explored in Chapter 7)
Production of Defective Parts
There was a significant amount of rework generated by CCA production. A couple of changes were made to improve this situation. First, all rework was moved to a central location so the amount and severity of rework could be observed. Prior to this all rework was performed at employee work benches, which hid the magnitude of the problem. Second, standard work for the manual assembly steps was created to better instruct operators on the right way to assemble a board.
Excess Inventories
This was not a high priority for the Lean implementation team. An attempt was made to institute a rule to limit inventory in front of certain work centers to less than a day's worth, but inventory still was allowed to pile up in front of most work centers. Excess inventory was addressed to some degree with the implementation of a modified pull system that is described in detail in Chapter 6.
The actions to remove waste at the beginning of the project did have some impact on circuit card assembly performance. The removal of excess circuit card work-in-process inventory
temporarily dropped lead times. However, none of the initial steps to reduce waste resulted in major improvements in delivery, cost, or quality. The author argues that this is due to the
27
Some products did require a bonding step that was in a small building 100 feet from the production floor. The chemicals used in this process had to be kept a distance from normal production to avoid contamination.
piecemeal nature of the actions to eliminate waste. Attacking a little waste here and a little waste there is not going to have dramatic effects on overall system performance. Lean proponents would argue that the initial identification of obvious non-value added activity does not always generate the biggest gains. These gains should come by implementing flow and pull. Chapters 4 through 6 of this thesis explain how well these next steps in a Lean transformation can be
implemented in an environment that is not a perfect fit for Lean.
Another drawback to a sole focus on waste elimination is the potential harm to the system by removal of buffers. Buffers of inventory and capacity are very important in a system
characterized by high mix and variability in demand. These buffers help manage the variability in production requirements from time period to time period. Removing inventory and capacity
28
buffers can seriously hurt production performance. It would be preferable to smooth out the variability in mix and demand so that less buffering is needed, but this is not always possible. Taking out the "waste" of inventory and excess capacity before understanding the system variability can lead to disastrous results.
One final drawback to using waste as the driving metric: it is very difficult to measure progress against this metric. Waste comes in many forms, so one cannot easily devise a number that represents current total waste and the target waste level. This can be done indirectly by attaching costs to specific forms of waste, but this creates a bias where only waste that has direct cost benefits is considered for elimination. At Raytheon, the waste of waiting was a low priority initially, mainly because it was difficult to assign specific costs to this type of waste. However, the waste of waiting is very important to the performance of the manufacturing system.
If a single focus on eliminating waste through applying Lean principles produced limited lasting success for Glenrothes, then can QRM with its focus on lead time provide a better driving metric? This was tested in the second half of the internship. The focus of the team switched to reducing lead time as the primary metric. The time it took for a circuit board to begin processing to the time it was tested and placed into shipping became the most important measurement. Any changes that were implemented were gauged on this measure.
This raised the waste of waiting to the highest importance at the expense of the other wastes such as unnecessary movement of employees and unnecessary transport of materials. The waste of waiting was nearly ignored in the initial lean implementation effort, so the shift to a lead time focus required a significant shift in mindset. The question that now had to be asked about each step of the production process was not "where is the waste here?" but "why is this product waiting here?"
One benefit to this shift to a lead time focus was that there was a simple and direct measure of the improvement team's performance: circuit card lead time. This could be calculated weekly
and allowed for very good tracking of progress. A meaningful goal could also be set. The team set one week as the intermediate goal for lead time in assembly and test.
28 Capacity buffers are maintained by keeping key machine or workers idle some of the time. This is considered waste to Lean thinkers and should be eliminated.
Choosing lead time as the goal did not in itself create improvement, but the change in mindset set the stage for significant improvement as other parts of the QRM methodology were
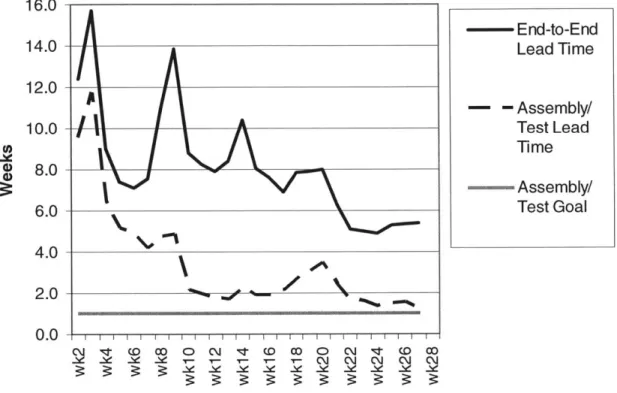
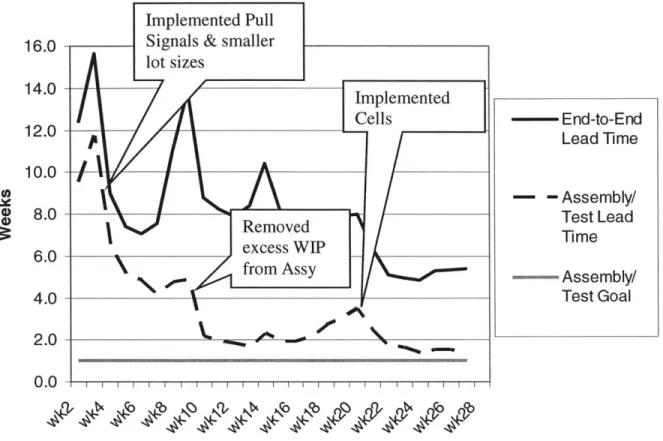
implemented. The specifics of these changes are discussed in Chapters 4 through 7, but the end result was significant improvement for Glenrothes Circuit Card manufacturing. The lead time chart in Figure 5 shows the progress towards lead time improvement within circuit card assembly.
Figure 5: CCA Lead Time Trends
16.0 14.0 12.0 10.0 0) 4) 8.0 6.0 4.0 2.0 0.0
A
A
-0 -(o 0 Co co 0 C~j c\jCM 'qiThe switch to a lead time mindset led the team to follow up with the implementation of other QRM principles that resulted in sustained lead time reduction. The specific changes that led to the decrease in Assembly/Test lead time and the resulting accomplishments are explained in detail in Chapter 9.2. End-to-End Lead Time -- - Assembly/ Test Lead Time --- . Assembly/ Test Goal C\I (0 CO
4. Factory Organization
The first significant changes to be made within circuit card assembly after some initial focus on waste was to the organization of the factory. This is the subject of Chapter 4.
4.1. Product Grouping
There are two extremes within a manufacturing environment for designing product groups or families. On one extreme is finding groups of products that have nearly identical processing steps and then dedicate equipment for each one of these product families (the product family approach). The other extreme is to group the machines by department and then allow every product the ability to travel through any process step (the functional or work center approach). There are different criteria for deciding which end of the spectrum is better for the manufacturing system. These include desired flexibility, equipment availability, and product similarity.
The work center approach allows for the most flexibility because any product can go through any piece of equipment. When demand varies between products, capacity can be shared. For
example, suppose three equipment groups are setup for three product families (A,B,C). Then suppose total demand for the three products is consistent at 300 per week, but the mix changes so that during any given week one of the families account for 50% of demand while the other two products account for 25%. In this case, capacity of 150 units is required for each equipment group (450 units total capacity). If the work center approach is used, then only 300 units of weekly capacity are needed.
Equipment availability is important when the production equipment is a significant capital cost and there is not enough existing equipment to setup the required groups. The benefits of families must be weighed against this additional cost of equipment. Product similarity is the basis for setting up families, so the more alike the processing of each product, the more easily families can be set up.
Lean and QRM both favor the product family approach. From the Lean perspective, only when a production line can be run with a specific set of machines that process parts with similar
processing times on each machine can a true flow and pull be implemented. But Lean does not provide any answers when, for reasons of required flexibility, equipment cost, or product dissimilarity, product families are not feasible. Mixed-Model Lean is the best resource for dealing with dissimilar products, but Duggan states clearly that the processing times must be
within 30% of each other for each step in order to create a Lean flow line in a mixed-model environment.29 In many production systems, including circuit cards in Glenrothes, this is not the
case for the majority of products.
QRM, on the other hand, does not place these restrictions on product groupings. QRM advocates product families for products that run on similar processes, even when these products have very different processing times and have different routings within the machine group.
In the case of Glenrothes Circuit Cards, two main product groups were identified within the entire circuit card portfolio. One product group (Product Group B) was associated with