HAL Id: ird-02438220
https://hal.ird.fr/ird-02438220
Submitted on 31 May 2021
HAL is a multi-disciplinary open access
archive for the deposit and dissemination of
sci-entific research documents, whether they are
pub-lished or not. The documents may come from
teaching and research institutions in France or
abroad, or from public or private research centers.
L’archive ouverte pluridisciplinaire HAL, est
destinée au dépôt et à la diffusion de documents
scientifiques de niveau recherche, publiés ou non,
émanant des établissements d’enseignement et de
recherche français ou étrangers, des laboratoires
publics ou privés.
Distributed under a Creative Commons Attribution| 4.0 International License
A thirteen-million-year divergence between two lineages
of Indonesian coelacanths
Kadar Kadarusman, Hagi Yulia Sugeha, Laurent Pouyaud, Régis Hocdé,
Intanurfemi Hismayasari, Endang Gunaisah, Santoso Widiarto, Gulam Arafat,
Ferliana Widyasari, David Mouillot, et al.
To cite this version:
Kadar Kadarusman, Hagi Yulia Sugeha, Laurent Pouyaud, Régis Hocdé, Intanurfemi Hismayasari,
et al.. A thirteen-million-year divergence between two lineages of Indonesian coelacanths. Scientific
Reports, Nature Publishing Group, 2020, 10 (1), �10.1038/s41598-019-57042-1�. �ird-02438220�
between two lineages of
indonesian coelacanths
Kadarusman
1,2, Hagi Yulia Sugeha
3, Laurent pouyaud
4, Régis Hocdé
5,
intanurfemi B. Hismayasari
1, Endang Gunaisah
1, Santoso B. Widiarto
6, Gulam Arafat
6,
ferliana Widyasari
6, David Mouillot
5& emmanuel paradis
4*Coelacanth fishes of the genus Latimeria are the only surviving representatives of a basal lineage of vertebrates that originated more than 400 million years ago. Yet, much remains to be unveiled about the diversity and evolutionary history of these ‘living fossils’ using new molecular data, including the possibility of ‘cryptic’ species or unknown lineages. Here, we report the discovery of a new specimen in eastern indonesia allegedly belonging to the species L. menadoensis. Although this specimen was found about 750 km from the known geographical distribution of the species, we found that the molecular divergence between this specimen and others of L. menadoensis was great: 1.8% compared to 0.04% among individuals of L. chalumnae, the other living species of coelacanth. Molecular dating analyses suggested a divergence date of ca. 13 million years ago between the two populations of Indonesian coelacanths. We elaborate a biogeographical scenario to explain the observed genetic divergence of indonesian coelacanth populations based on oceanic currents and the tectonic history of the region over Miocene to recent. We hypothesize that several populations of coelacanths are likely to live further east of the present capture location, with potentially a new species that remains to be described. Based on this, we call for an international effort to take appropriate measures to protect these fascinating but vulnerable vertebrates which represent among the longest branches on the Tree of Life.
Coelacanth fishes of the genus Latimeria are the only living representatives of the Actinistia, a group of verte-brates that flourished between the Early Devonian (ca. 400 millions of years ago, Ma) and the Late Cretaceous (ca. 80 Ma)1–3. Fossil fishes belonging to the subclass Actinistia have been found around the world, whereas the
two known living species of coelacanth are found only in the Western Indian Ocean (L. chalumnae4) and in
Indonesia (L. menadoensis5). Sampling living specimens of coelacanths is a difficult endeavour, because they live
at depths of 200 to 400 m although they occasionally occur at shallower depths of 100 m below the surface, while catches by fishermen are sporadic. Furthermore, direct observations suggest that coelacanths have a very sparse distribution and live in groups of a few tens of individuals6–8. Our current knowledge on the genetic diversity
of these enigmatic animals suggests that L. chalumnae is distributed along several thousands kilometers of the South-East African coast and has very low genetic diversity based on mitochondrial genome markers9,10 and on
nuclear microsatellites11, whereas L. menadoensis is distributed in a very small area near the northern part of
the island of Sulawesi, where only a few individuals have been studied genetically but show very close genetic affinities12,13 (Fig. 1). These population genetic data strongly suggest that both species may represent the relicts
of an ancient clade of early tetrapods decimated by extinctions14. Surprisingly, no specimens have been reported
outside of these two restricted regions, while the existence of other coelacanth sub-species or species has never been mentioned.
We here report results of the genetic analyses of a new coelacanth specimen, allegedly belonging to L.
mena-doensis, caught recently in West Papua, Indonesia, approximately 750 km from Sulawesi. We find significant but
Neogene-dated genetic differences between this individual and populations of L. menadoensis found in Sulawesi,
1Politeknik Kelautan dan Perikanan Sorong, KKD BP. SR SGK, Jl. Kapitan Pattimura, Tanjung Kasuari, Kota Sorong,
98401, Papua Barat, Indonesia. 2Sekolah Tinggi Perikanan, KKD Pengelolaan Sumberdaya Perairan. SR BE, Jl. AUP,
Pasar Minggu, Jakarta, 12520, Indonesia. 3Research Center for Oceanography, Indonesian Institute of Sciences, Jl.
Pasir Putih 1, Ancol Timur, Jakarta, 14430, Indonesia. 4ISEM, Univ Montpellier, CNRS, EPHE, IRD, Montpellier, France. 5MARBEC, Univ Montpellier, CNRS, Ifremer, IRD, Montpellier, France. 6Loka Pengelolaan Sumberdaya Pesisir dan
www.nature.com/scientificreports
www.nature.com/scientificreports/
challenging the view that living coelacanths are merely remnant populations of very anciently diverged lineages that have experienced little evolution since the early–mid Cenozoic.
Results
We sequenced 8164 base pairs (bp) of the mitochondrial genome of the new specimen, which represent 49.6% of the whole mitogenome of the Latimeria specimen from Manado (GQ911586, 16 446 bp). The alignement of these two sequences showed four deletions of one base (in tRNA-Phe, 16S rRNA, tRNA-Cys, and D-loop), and one deletion of two bases (D-loop) in the new specimen sequence, as well as two deletions of one base (in 16S rRNA and tRNA-Met) in GQ911586. This two-sequence alignment had thus 16 448 bp. The alignment with two genomes of L. chalumnae (AB257297, AP012199) added more gaps and resulted in an alignement with 16 454 bp. Alignments of 27 sequences of Latimeria spp., including sequences from previously sampled populations, gen-erated with MUSCLE or with MAFFT (see Methods), confirmed this result. The inferred maximum-likelihood (ML) gene tree topology showed unambiguously that the two Indonesian coelacanths are sister-lineages with a level of divergence never observed among the individuals of L. chalumnae (Fig. 2). The bootstrap analysis gave the following 95% confidence intervals (CI) for the two terminal branch lengths leading to the Indonesian coe-lacanths: [0.008, 0.013] for the Papua sequence, and [0.007, 0.013] for GQ911586. The 95% CI for the length of the internal branch connecting the two Indonesian specimens to the L. chalumnae clade was [0.034, 0.042].
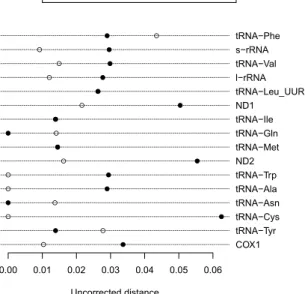
The pairwise genetic distances among individuals of L. chalumnae were zero for all genes except for tRNA-GLn (0.014 between AB257297 and AP012199). In four cases (tRNA-Phe, tRNA-Gln, tRNA-Asn, and tRNA-Tyr), the distance between the two Indonesian specimens was greater than the distance between the new specimen and
L. chalumnae (Fig. 3). In the twelve other cases, the opposite was observed, particularly for protein-coding and rRNA-coding sequences which are much longer than those coding for tRNAs. The p-distance between the two Indonesian specimens calculated using the first 655 sites of the COI gene (the segment used for fish DNA bar-coding) was 0.0122.
In addition to the deletions noted above during alignment, the two Indonesian individuals showed 149 base differences, whereas the number of differences between two individuals of L. chalumnae varied between 0 and 10. Among the 13 proteins coded by the mitogenome, three had their genes sequenced in the new specimen: ND1, ND2, and COI. While no amino acid (AA) substitutions were observed among the 12 unique sequences of L.
chalumnae, 35 AA replacements were observed between the Indonesian individuals and L. chalumnae (Table 1). Interestingly, it seems that all these replacements are the result of single events occurring on one of the three longest branches of the tree on Fig. 2. Among the 11 AA differences between the two Indonesian individuals, six can be inferred to result from substitutions that happened on the terminal branch leading to the new sequence, and five on the branch leading to GQ911586. The other 24 AA substitutions happened on the internal branch connecting the two main clades of Latimeria.
The ML phylogenetic analysis with ten mitogenomes resulted in an unambiguous tree that highlighted well-established relationships among the main clades of vertebrates (Fig. 4). A remarkable result from this phy-logeny is the substantial variation in molecular evolutionary rate among sampled lineages. It is also noteworthy that Pan was found to be a sister-lineage of the clade Andrias + Lacerta in the NJ tree which was used as initial tree of the ML analysis.
The estimated divergence date for the two Indonesian coelacanth populations was inferred to be 13.3 Ma by the ML method, and 12.4 Ma by the Bayesian method (95% highest posterior density, HPD: 1.5–34.1), in the middle Miocene.
The distance between Manado (where all individuals of L. menadoensis were caught until the new speci-men was captured, although some individuals were observed elsewhere; see Discussion section) and the location of the capture of the new individual was estimated to be 752 km (geodesic distance). The bathymetry around these locations is extremely variable with trenches more than 8000 m deep as well as shallow oceanic shelves (Fig. 5). Manado and Waigeo are separated by the island of Halmahera and a deep channel separates this island
Figure 1. Known geographical distributions of the two species of Latimeria. The localities where specimens of
L. menadoensis were captured are shown in bold, and the localities where this species has been observed in situ
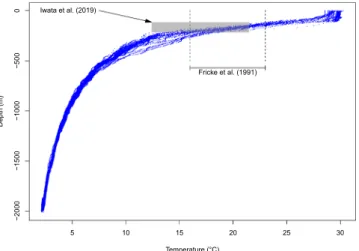
from Sulawesi. We extracted 25 724 temperature records taken at depth between 0 and 2011 m north of Papua.
Latimeria chalumnae is reported to prefer water temperatures ranging from 16 °C to 23 °C6, and these
tempera-tures were observed in our data at depths between 110 m and 270 m (Fig. 6).
Discussion
Before the capture of the new Latimeria specimen reported in this paper, all known specimens of L. menadoensis were captured near Manado in North Sulawesi8. However, submarine observations of coelacanths have been
reported 360 km southwest of Manado15 and in the Cendrawasih Bay to the north of Papua8, indicating potential
for undetected populations. Therefore, our findings provide an important contribution to better understand the diversity, distribution, and evolution of this important group of vertebrates16–18.
We acknowledge several limitations of our study with regard to relying on a mtDNA-only dataset from a single individual of the new population. For example, examining loci from both nuclear and mitochondrial genomes has revealed cases of cytonuclear discordance in other taxonomic groups19–21. In the current investigation, we
may have detected a divergent mitochondrial lineage in L. menadoensis. However, nuclear loci may reveal con-temporary gene flow between populations from Manado and Papua New Guinea. Sampling additional specimens and expanding future molecular investigations to include unlinked nuclear loci would extend our understanding of species limits and the evolutionary history of Latimeria. However, the most striking result from our analyses is the relatively deep but Neogene molecular divergence between the specimen from Papua and its counterpart representing the previously studied population from Manado. This divergence is apparent at the mitochondrial DNA level but also implied a substantial number of AA replacements in protein-coding mitochondrial genes, something that has not to-date been observed among L. chalumnae individuals. The ML bootstrap analysis of branches leading to the Indonesian coelacanth fish populations strongly suggests that molecular evolutionary rate was equal in these two lineages, thus supporting the hypothesis of a molecular clock for the mitochondrial genome within this clade. Furthermore, the number of amino acid substitutions were found to be almost the same on both branches (five and six, respectively).
This marked pattern of genetic divergence between the two Indonesian coelacanths suggests that it would be worthwhile to revisit an earlier hypothesis15, namely that the two known species of Latimeria have different
habitats and probably different life-history strategies that could be correlated to differences in their respective environments. East African coelacanth fish live in relatively calm oceanic waters while Indonesian coelacanth fish inhabit more disturbed and turbulent waters7,15. The eastern part of the Indonesian archipelago is characterized
by a complex system of strong oceanic currents22,23. This complexity is partly caused by the meeting of several
currents at the equator, where the Coriolis force becomes inverted. Particularly, the New Guinea Coastal Current (shown on the right-hand side of Fig. 5A) flows westward along the main coast of New Guinea, then northward after the island of Halmahera and finally eastward a few hundred kilometers further north. This phenomenon creates a whirlpool known as the Halmahera Eddy in the center of this loop with a depression of up to 120 m24.
A similar phenomenon exists around Manado with the Mindanao Current (on the left-hand side of Fig. 5A) and the Mindanao Eddy west of Manado. These sea surface currents flow between 0 and 350 m below sea surface. The Maluku Sea appears to separate both populations of Indonesian coelacanths. These oceanographic observations
III AP012199 AP012190 AP012191 AP012198 1e−040.0001
Figure 2. Maximum likelihood unrooted phylogeny reconstructed with 27 mitochondrial genome sequences
of Latimeria. The Roman numerals indicate sequences that are identical (I: AP012182, AP012184–AP012187, AP012189, AP012193, and AP012195; II: AB257297, AP012179, AP012180, and AP012188; III: AB257296 and AP012177; IV: AP012178 and AP012196; and V: AP012194 and AP012197).
www.nature.com/scientificreports
www.nature.com/scientificreports/
agree with the existence of a strong barrier between Sulawesi and Halmahera which has been observed in several groups of marine organisms25,26.
A crucial question, given these results, is whether this system shaped by strong sea surface currents has been stable over geological time, to maintain the divergence of coelacanth populations over thousands to millions of years. Modelling studies suggest that the contrasted oceanic topography is an important factor in this region where waters from the northern and southern hemispheres meet23,24. This topography is the result of a long and
complex tectonic history27,28. One of the most dramatic geological events was the uplift of New Guinea by the
accretion of terranes (pieces of tectonic plates) with different plates and arcs between 42 Ma and 18 Ma29. The
climax of changes in plate boundaries seem to have happened between about 25 and 20 Ma27. Therefore, this
hydrological connectivity among marine populations or species was still possible before 20 Ma and was probably interrupted after this date. Our molecular dating analysis is consistent with these geological inferences and sup-ports the interpretation of major barriers to connectivity between New Guinea and Sulawesi existing since around 20 Ma in the early- to mid-Miocene.
The molecular divergence observed between the individuals from Waigeo and Manado is further evidence of a low rate of molecular evolution among the lineages of Latimeria. Remarkably, such a low rate of molecular evolu-tion was observed in previous studies comparing the two species using mitochondrial13 or nuclear genomes30. The
observed divergence for the COI-based barcode between the two Indonesian specimens (1.22%) was greater than among individuals of the same species for several groups of fishes which averaged 0.59%31, 0.89%32, or 0.29%33.
This suggests that the new specimen is genetically distinct and may warrant formal recognition as a species, although in-depth taxonomic assessment would be required to test this hypothesis.
Iwata et al.8 performed 1173 dives in Sulawesi and Biak and observed 30 coelacanths at depths 115.6–218.9 m
and temperatures 12.4–21.5 °C (Fig. 6). These values widely overlap with those observed for L. chalumnae6,
though depths for the latter are slightly shallower. It is too premature to conclude that the temperature tolerances of these species are different, although the relatively old divergence between them (30–40 Ma) is likely to result in environmental niche divergence through time.
Figure 3. Uncorrected genetic distances for 16 genes of the mitogenome of Latimeria. Open symbols show
distances between the two Indonesian specimens; filled symbols show distances between the new Indonesian specimen and a specimen of L. chalumnae.
Sequence Protein ND1 ND2 COI 000001112333 00001111122222222333 001 177895786012 49990459902334489112 573 489687616553 15688350194250368390 623
Papua IAALYSTMVLLT ITQTVFMVIITMTTMTYTTD IIG
GQ911586 V...H.A....A T..IMY...V... .VS AP012199 VTTMHA.TIMF. TAPI.YTMV.ATAATAHIPG V..
Table 1. Replacements of amino acids among the new coelacanth specimen from Papua (Papua), an individual
from Manado (GQ911586), and an individual belonging to L. chalumnae (AP012199). The three rows of digits give the positions along the protein sequences and have to be read vertically.
Based on the available information from our results, in combination with patterns of oceanic circulation from the region, we hypothesize that the Latimeria specimen captured in Waigeo in July 2018 belongs to L. menadoensis, although it is likely that this specimen belongs to a distinct and as-of-yet undescribed species or subspecies of
Latimeria. We urgently call for future taxonomic studies integrating morphological and genetic data from
multi-ple specimens from different L. menadoensis populations, in order to test this hypothesis. Nevertheless, our results suggest that L. menadoensis likely has a much wider geographical range than previously thought. Given the pres-ence of this specimen nearby the New Guinea Coastal Current, we hypothesize that L. menadoensis populations can occur along the coast of New Guinea and probably further east of New Guinea. The waters of the northwest coast of New Guinea have been poorly sampled and it would not be surprising to find several populations of coelacanths in the region.
In light of our findings as well as the unique biology of coelacanths in general, we call for an international effort to take appropriate measures to protect these fascinating but vulnerable vertebrates. The conservation of relict species including the unique representatives of particular phylogenetic groups and their likely unique com-binations of characters is key to conserve phylogenetic diversity represented by the Tree of Life. Yet, the existing global system of marine protected areas (MPAs) may fail to cover areas where these relict species are located34. If
MPAs are to protect the unique and diverse marine lineages across the Tree of Life, we need to carefully recon-sider the protection of East Indonesian coasts where this new lineage of coelacanth occurs.
Methods
Sampling.
Mr. Dava Santoso, a recreational fisherman, accidentally caught a coelacanth on July 1, 2018, off southeast Waigeo Island (West Papua, Indonesia; Fig. 5A). The specimen was captured at a depth, estimated by Mr. Santoso, of about 300 m with a handline while using sardine fillets as bait. The gender of the specimen was not identified, and the body was around 1 m long. Unfortunately, the specimen was filleted and mostly consumed before the staff from Loka Pengelolaan Sumberdaya Pesisir dan Laut Sorong (LPSPL Sorong, Indonesia) and the Politeknik Kelautan dan Perikanan Sorong (Politeknik KP Sorong) obtained tissue samples from the fish and preserved them in absolute ethanol (100%).Figure 4. (A) Maximum likelihood phylogeny estimated with phangorn. The bold numbers give the node
support bootstrap values (1000 replications). The branch lengths are in expected number of substitutions. (B) Dated phylogeny (chronogram) estimated by Bayesian inference. The rectangles show the credibility intervals from the highest posterior densities.
www.nature.com/scientificreports
www.nature.com/scientificreports/
Laboratory analyses.
Laboratory analyses were carried out at the molecular laboratory of the Ministry of Marine and Fisheries Affairs in Jakarta, Indonesia. Whole genomic DNA was extracted using ZR Tissue & Insect DNA MiniPrep (Zymo Research, D6016). We amplified half of the whole mitochondrial genome includ-ing the whole control region (D-loop), 12S, 16S, ND1, ND2, and COX1, usinclud-ing 12 pairs of primers described in13 (Table S1) with an initial denaturation step at 94 °C for 2 min, a cycle of three steps (denaturation at 94 °Cfor 30 sec; annealing at 55 °C for 40 sec; elongation at 72 °C for 1 min) repeated 35 times, and a final extension of 10 min at 72 °C. The double-stranded PCR products were purified and sequenced using the BigDyeTM Terminator v3.1 Cycle Sequencing Kit at 1st BASE Manufacturer, Axil Scientific Pte Ltd., Singapore.
Statistical analyses.
We first compared the new mitogenome sequence with the sequence from an individ-ual of L. menadoensis caught in Manado (GenBank accession no: GQ91158613) and 25 sequences of L. chalumnaefrom Comoros (2) and Tanzania (23) (AB257296, AB257297, AP012177–AP0121989,10). We performed manual
sequence alignments as well as alignments with MUSCLE35 and MAFFT36. We examined the base substitutions as
well as the amino acid substitutions for the protein-coding sequences with ape37, and performed maximum
likeli-hood (ML) phylogenetic analyses under a GTR + Γ + I model using the phangorn R package38. Confidence in the
inferred clades was assessed using a bootstrap approach with 1000 pseudoreplicates39. Because we used a general
phylogenetic model with a distinct substitution rate for each branch (i.e., not a molecular clock model), we tested the hypothesis that the rate of molecular evolution was the same between specimens of Indonesian Latimeria using a bootstrap with 1000 pseudoreplicates and comparing the distribution of these estimates. This test makes no assumption on the substition rates on the other branches of the tree. The uncorrected genetic distances (also known as p-distances) were calculated separately for 16 sequences coding for tRNAs (11), rRNAs (2), or proteins (3) using annonations from GenBank.
Subsequent to the above steps, we dated the divergence between the two specimens of Latimeria found in Indonesia by reconstructing a phylogeny with the mitogenomes of several vertebrates, including the followings:
Figure 5. (A) Bathymetry of Eastern Indonesia. The arrows show the main surface currents. (B) Bathymetry
Acipenser dabryanus (KP981414), Gymnarchus niloticus (AP008930), Neoceratodus forsteri (AJ584642), Andrias japonicus (AB208679), Lacerta bilineata (NC_028440), and Pan troglodytes (NC_001643). These species were
selected in order to provide a reasonable sample whose genomes and relationships to Actinistia are well charac-terized40,41. A progressive alignment of these six additional genomes was performed on the alignement obtained
with the new sequence, GQ911586, AB257297, and AP012199 using MAFFT. An ML tree was estimated with this alignment under a GTR + Γ + I model and then dated with the ML method42 implemented in ape as well
as an independent analysis using the Bayesian approach implemented in BEAST 2.5.243. The ML analysis used
Sanderson’s correlated rate model where the substitution rates are assumed to be positively correlated on contig-uous branches of the tree44, whereas the Bayesian analysis assumed a relaxed lognormal clock model and Yule
priors on the distribution of trees. Three calibration points were used in both analyses41: 416.1–421.75 Ma for
the divergence between fishes and tetrapods (Actinopterygii–Sarcopterygii), 330.4–350.1 Ma for the divergence between amniotes and amphibians (Reptiliomorpha–Batrachomorpha), and 312.3–330.4 Ma for the divergence between reptiles and mammals (Sauropsida–Synapsida). These ages were considered as soft bounds in both anal-yses using normal priors in Bayesian analysis. The posterior distribution of the parameters were estimated by Markov chain Monte Carlo (MCMC) run during 107 generations sampled every 103 and discarding the first 106
generations as burn-in period.
In order to assess potential dispersal routes between Manado and Waigeo, we established the bathymetric profile of the region using the GIS database provided by the National Oceanic and Atmospheric Administration (https://www.ngdc.noaa.gov/mgg/global/relief/ETOPO1/data/bedrock/grid_registered/georeferenced_tiff/, accessed 2019-03-18). These data were processed with the R package rgdal45. Because no vertical ocean profiles
of temperature data are available on the location of the capture of the new specimen, we used data from the closest stations which are made available by the ARGO broad-scale global array of temperature and salinity pro-filing floats in the northeast of Waigeo. The area is crossed by the Halmahera Eddy throughflow from the Pacific Ocean to the Indian Ocean. We can therefore consider that the characteristics of the seawater column observed by the selected ARGO profiling floats are similar to those in Waigeo. ARGO is an international program that calls for the deployment of 3,000 free drifting profiling floats, distributed over the global oceans which measure the temperature and salinity in the upper 2 000 m of the ocean. The observation data are uploaded in the Global Data Assembly Centre (Argo GDAC46). Each ARGO autonomous profiling CTD has several sensors on board,
including a Sea-Bird SBE 41/41CP for the seawater temperature and salinity acquisition, and a Druck 2900 PSIA for the pressure acquisition. Argo CTD module was developed in response to the scientific need for highly stable and accurate temperature and salinity on profiling floats, with high and manual quality control process47. The
seawater temperature profiles were extracted from the ARGO database (http://www.ifremer.fr/co-argoFloats/ float?ptfCode=5904515) with an accuracy of 0.002 °C and a resolution of 0.0001 °C for the temperatures, and an accuracy of 1.5% and a resolution 0.01 dbar for the pressure. We extracted 209 profiles recorded during March 2019 at longitudes between 141.02°E and 161.21°E and latitudes between 8.18 °S and 1.67 °N.
Except for the BEAST analysis, all analyses were done with R version 3.5.248.
Data availability
The new sequence was deposited in NCBI GenBank (accession number: MK748470). Received: 11 June 2019; Accepted: 18 December 2019;
Published online: 13 January 2020
5 10 15 20 25 30
−2000
Temperature (°C)
Figure 6. Temperatures and depths recorded close to the capture location of the new specimen (blue dots). The
dashed lines show the depth range observed for L. chalumnae by Fricke et al.6, and the grey rectangle shows the
www.nature.com/scientificreports
www.nature.com/scientificreports/
References
1. Cloutier, R. & Forey, P. L. Diversity of extinct and living actinistian fishes (Sarcopterygii). Environ. Biol. Fish. 32, 59–74 (1991). 2. Zhu, M. et al. Earliest known coelacanth skull extends the range of anatomically modern coelacanths to the Early Devonian. Nature
Comm. 3, 772 (2012).
3. Gess, R. W. & Coates, M. I. Fossil juvenile coelacanths from the Devonian of South Africa shed light on the order of character acquisition in actinistians. Zool. J. Linn. Soc. 175, 360–383 (2015).
4. Smith, J. L. B. A living fish of Mesozoic type. Nature 143, 455–456 (1939).
5. Pouyaud, L. et al. A new species of coelacanth. C. R. Acad. Sci. III 322, 261–267 (1999).
6. Fricke, H. et al. Habitat and population size of the coelacanth Latimeria chalumnae at Grand Comoro. Environ. Biol. Fish. 32, 287–300 (1991).
7. Fricke, H. et al. The population biology of the living coelacanth studied over 21 years. Mar. Biol. 158, 1511–1522 (2011).
8. Iwata, M. et al. Field surveys on the Indonesian coelacanth, Latimeria menadoensis using remotely operated vehicles from 2005 to 2015. Bull. Kitakyushu Mus. Nat. Hist. Hum. Hist., Ser. A 17, 49–56 (2019).
9. Sasaki, T. et al. Mitogenomic analysis for coelacanths (Latimeria chalumnae) caught in Tanzania. Gene 389, 73–79 (2007). 10. Nikaido, M. et al. Genetically distinct coelacanth population off the northern Tanzanian coast. Proc. Natl. Acad. Sci. USA 108,
18009–18013 (2011).
11. Schartl, M., Hornung, U., Hissmann, K., Schauer, J. & Fricke, H. Relatedness among east African coelacanths. Nature 435, 901 (2005). 12. Inoue, J. G., Miya, M., Venkatesh, B. & Nishida, M. The mitochondrial genome of Indonesian coelacanth Latimeria menadoensis
(Sarcopterygii: Coelacanthiformes) and divergence time estimation between the two coelacanths. Gene 349, 227–235 (2005). 13. Sudarto et al. Mitochondrial genomic divergence in coelacanths (Latimeria): slow rate of evolution or recent speciation? Mar. Biol.
156, 2253–2262 (2010).
14. Lampert, K. P. et al. Population divergence in East African coelacanths. Curr. Biol. 22, R439–R440 (2012). 15. Fricke, H. et al. Biogeography of the Indonesian coelacanths. Nature 403, 38 (2000).
16. Bennett, D. J., Sutton, M. D. & Turvey, S. T. Evolutionarily distinct “living fossils” require both lower speciation and lower extinction rates. Paleobiology 43, 34–48 (2017).
17. Casane, D. & Laurenti, P. Why coelacanths are not ‘living fossils’. A review of molecular and morphological data. Bioessays 35, 332–338 (2013).
18. Cavin, L. & Guinot, G. Coelacanths as “almost living fossils”. Front. Ecol. Evol. 2, 49 (2014).
19. Schwarzer, J. et al. Repeated trans-watershed hybridization among haplochromine cichlids (Cichlidae) was triggered by Neogene landscape evolution. Proc. R. Soc. Lond. B 279, 4389–4398 (2012).
20. Pedraza-Marrón, C. D. R. et al. Genomics overrules mitochondrial DNA, siding with morphology on a controversial case of species delimitation. Proc. R. Soc. Lond. B 286, 20182924 (2019).
21. Després, L. One, two or more species? Mitonuclear discordance and species delimitation. Mol. Ecol. 28, 3845–3847 (2019). 22. Kashino, Y., Atmadipoera, A., Kuroda, Y. & Lukijanto, N. Observed features of the Halmahera and Mindanao Eddies. J. Geophys.
Res.: Oceans 118, 6543–6560 (2013).
23. Wijeratne, S., Pattiaratchi, C. & Proctor, R. Estimates of surface and subsurface boundary current transport around Australia. J.
Geophys. Res.: Oceans 123, 3444–3466 (2018).
24. Arruda, W. Z. & Nof, D. The Mindanao and Halmahera eddies—Twin eddies induced by nonlinearities. J. Phys. Oceanogr. 33, 2815–2830 (2003).
25. Barber, P. H., Palumbi, S. R., Erdmann, M. V. & Moosa, M. K. A marine Wallace’s line? Nature 406, 692–693 (2000).
26. Kool, J. T., Paris, C. B., Barber, P. H. & Cowen, R. K. Connectivity and the development of population genetic structure in Indo-West Pacific coral reef communities. Global Ecol. Biogeogr. 20, 695–706 (2011).
27. Hall, R. Cenozoic geological and plate tectonic evolution of SE Asia and the SW Pacific: computer-based reconstructions, model and animations. J. Asian Earth Sci. 20, 353–431 (2002).
28. Hall, R. Southeast Asia: new views of the geology of the Malay Archipelago. Annu. Rev. Earth and Pl. Sc. 45, 331–358 (2017). 29. Zahirovic, S., Seton, M. & Müller, R. D. The Cretaceous and Cenozoic tectonic evolution of Southeast Asia. Solid Earth 5, 227–273 (2014). 30. Nikaido, M. et al. Coelacanth genomes reveal signatures for evolutionary transition from water to land. Genome Res. 23, 1740–1748
(2013).
31. Kochzius, M. et al. Identifying fishes through DNA barcodes and microarrays. PLoS One 5, e12620 (2010).
32. Kartavtsev, Y. P. Divergence at Cyt-b and Co-1 mtDNA genes on different taxonomic levels and genetics of speciation in animals.
Mitochondrial DNA 22, 55–65 (2011).
33. Cariani, A. et al. Improving the conservation of Mediterranean chondrichthyans: the ELASMOMED DNA barcode reference library.
PLoS One 12, e0170244 (2017).
34. Mouillot, D. et al. Global marine protected areas do not secure the evolutionary history of tropical corals and fishes. Nature Comm.
7, 10359 (2016).
35. Edgar, R. C. MUSCLE: multiple sequence alignment with high accuracy and high throughput. Nucleic Acids Res. 32, 1792–1797 (2004). 36. Katoh, K. & Standley, D. M. MAFFT multiple sequence alignment software version 7: improvements in performance and usability.
Mol. Biol. Evol. 30, 772–780 (2013).
37. Paradis, E. & Schliep, K. ape 5.0: an environment for modern phylogenetics and evolutionary analyses in R. Bioinformatics 35, 526–528 (2019).
38. Schliep, K. P. phangorn: phylogenetic analysis in R. Bioinformatics 27, 592–593 (2011).
39. Felsenstein, J. Confidence limits on phylogenies: an approach using the bootstrap. Evolution 39, 783–791 (1985).
40. Brinkmann, H., Venkatesh, B., Brenner, S. & Meyer, A. Nuclear protein-coding genes support lungfish and not the coelacanth as the closest living relatives of land vertebrates. Proc. Natl. Acad. Sci. USA 101, 4900–4905 (2004).
41. Benton, M. J. & Donoghue, P. C. J. Paleontological evidence to date the tree of life. Mol. Biol. Evol. 24, 26–53, Erratum vol. 24, pp. 889–891 (2007).
42. Paradis, E. Molecular dating of phylogenies by likelihood methods: a comparison of models and a new information criterion. Mol.
Phyl. Evol. 67, 436–444 (2013).
43. Bouckaert, R. et al. BEAST 2: a software platform for Bayesian evolutionary analysis. PLoS Comput. Biol. 10, e1003537 (2014). 44. Sanderson, M. J. Estimating absolute rates of molecular evolution and divergence times: a penalized likelihood approach. Mol. Biol.
Evol. 19, 101–109 (2002).
45. Bivand, R., Keitt, T. & Rowlingson, B. rgdal: Bindings for the ‘Geospatial’ Data Abstraction Library, https://CRAN.R-project.org/ package=rgdal, R package version 1.3-6 (2018).
46. Argo. Argo Float Data and Metadata from Global Data Assembly Centre (Argo GDAC). SEANOE, https://doi.org/10.17882/42182 (2019). 47. Wong, A., Keeley, R., Carval, T. & Argo Data Management Team. Argo Quality Control Manual for CTD and Trajectory Data, https://
doi.org/10.13155/33951 (2019).
48. R Core Team. R: A Language and Environment for Statistical Computing. R Foundation for Statistical Computing, Vienna, Austria, http://www.R-project.org (2019).
competing interests
The authors declare no competing interests.
Additional information
Supplementary information is available for this paper at https://doi.org/10.1038/s41598-019-57042-1.
Correspondence and requests for materials should be addressed to E.P.
Reprints and permissions information is available at www.nature.com/reprints.
Publisher’s note Springer Nature remains neutral with regard to jurisdictional claims in published maps and
institutional affiliations.
Open Access This article is licensed under a Creative Commons Attribution 4.0 International
License, which permits use, sharing, adaptation, distribution and reproduction in any medium or format, as long as you give appropriate credit to the original author(s) and the source, provide a link to the Cre-ative Commons license, and indicate if changes were made. The images or other third party material in this article are included in the article’s Creative Commons license, unless indicated otherwise in a credit line to the material. If material is not included in the article’s Creative Commons license and your intended use is not per-mitted by statutory regulation or exceeds the perper-mitted use, you will need to obtain permission directly from the copyright holder. To view a copy of this license, visit http://creativecommons.org/licenses/by/4.0/.