Publisher’s version / Version de l'éditeur:
Vous avez des questions? Nous pouvons vous aider. Pour communiquer directement avec un auteur, consultez la première page de la revue dans laquelle son article a été publié afin de trouver ses coordonnées. Si vous n’arrivez pas à les repérer, communiquez avec nous à PublicationsArchive-ArchivesPublications@nrc-cnrc.gc.ca.
Questions? Contact the NRC Publications Archive team at
PublicationsArchive-ArchivesPublications@nrc-cnrc.gc.ca. If you wish to email the authors directly, please see the first page of the publication for their contact information.
https://publications-cnrc.canada.ca/fra/droits
L’accès à ce site Web et l’utilisation de son contenu sont assujettis aux conditions présentées dans le site LISEZ CES CONDITIONS ATTENTIVEMENT AVANT D’UTILISER CE SITE WEB.
Laboratory Memorandum (National Research Council of Canada. Ocean, Coastal and River Engineering); no. OCRE-LM-2017-007, 2017-07-24
READ THESE TERMS AND CONDITIONS CAREFULLY BEFORE USING THIS WEBSITE. https://nrc-publications.canada.ca/eng/copyright
NRC Publications Archive Record / Notice des Archives des publications du CNRC : https://nrc-publications.canada.ca/eng/view/object/?id=5a327056-ddb6-4ba9-8bab-f09b4866df61 https://publications-cnrc.canada.ca/fra/voir/objet/?id=5a327056-ddb6-4ba9-8bab-f09b4866df61 For the publisher’s version, please access the DOI link below./ Pour consulter la version de l’éditeur, utilisez le lien DOI ci-dessous.
https://doi.org/10.4224/40000398
Access and use of this website and the material on it are subject to the Terms and Conditions set forth at Assessing ice action on bridges in the context of climate change: prospective approach
Barrette, Paul; Richard, Martin; Poirier, Louis; Babaei, Hossein; Frederking, Robert
Assessing ice action on bridges
in the context of climate change: Prospective approach
Laboratory Memorandum OCRE-LM-2017-007
Paul Barrette, Martin Richard, Louis Poirier, Hossein Babaei, Robert Frederking 1200 Montreal Rd, Ottawa, ON K1A 0R6
July 24, 2017
National Research Council Conseil national de recherches
Canada Canada
Ocean, Coastal and River Génie océanique, côtier et fluvial Engineering
Assessing ice action against bridges
in the context of climate change: Prospective approach
Laboratory Memorandum OCRE-LM-2017-007 Paul Barrette Martin Richard Louis Poirier Hossein Babaei Robert Frederking July 24, 2017
National Research Council Conseil national de recherches
Canada Canada
Ocean, Coastal and River Génie océanique, côtier et fluvial Engineering
Assessing ice action against bridges
in the context of climate change: Prospective approach
Laboratory Memorandum OCRE-LM-2017-007
Paul Barrette, Martin Richard, Louis Poirier, Hossein Babaei, Robert Frederking
[Photograph: View from upstream of the two bridges in Quebec City crossing the St. Lawrence River. In front is the Pierre Laporte suspension bridge, built in the late 1960’s. The distance between the piers is approximately 600 m. Right behind it (about 150 m), darker colored, is the old Quebec cantilever bridge, built early in the 20th century. This picture was taken in March 2008 by Brian Morse, Ed Stander and Martin Richard, from an ice canoe on the river.]
i
Executive Summary
There are a large number of bridges in Canada which cross water expanses that freeze in the winter. Ice loads on bridge piers, which depend on floe size as well as ice strength, thickness and temperature, have to be factored in the design of these structures. Climate change is affecting ice growth patterns, in response to changes both in the water (floating ice) and in the atmosphere (precipitation). For instance, the extent of these changes, with positive or negative impact, needs to be addressed in order to guide codes and standards on bridge designs and construction.
These goals can be achieved via the following 4-step scheme:
1. Survey existing knowledge and background information and the prospective resources that could be mobilized – this report addresses that first step. 2. Analysis of today’s loading regime on a representative sample of Canadian
bridges, along with all required information on ice regime.
3. Derivation of ice regime based on climatic model recommended to us by CRBCPI, and estimation of loads in the next 50 and 100 years.
4. Recommendations for updates to relevant codes.
In Canada, the mandate for establishing design and construction requirements for highways, including highway bridges, lies with the provincial and territorial governments. All provinces and territories, with the exception of Manitoba, have mandated CSA S6-14 for use within their jurisdictions. Manitoba partners with the US Federal Highways Administration (FHWA) and uses AASHTO LFRD. In the US, the American Association of State Highway and Transportation Officials (AASHTO) develops and revises new editions of their bridge code nominally every two years. The International Organization for Standardization (ISO) has an offshore code – CSA/ISO 19906 Arctic offshore structures. For countries within the European Union a series of European standards known as Eurocodes (EN) related to construction have come into force.
During these investigations, a preliminary count of about 22,000 bridges managed by the public sector crossing water, has been obtained. Several provincial transportation departments have agreed to compile information on their bridge infrastructure and send that information to NRC – these procedures are pending. When designing a bridge, most jurisdictions have specific requirements related to ice, so as to complement those specified in the design code they use. For most of them, a major concern is the required vertical clearance under high water levels induced from an ice jam. Bridge piers instigate ice jams, which in turn allow the ice to rise and reach the superstructure. Important parameters such as discharge, ice thickness, and ice jam frequency and locations, depend on climatic conditions. Included in this report is a preliminary listing of the key contacts that were reached so far by the authors, for information on their jurisdiction’s bridge infrastructure.
The Confederation Bridge is well instrumented and presents an opportunity to gather insightful information on ice-induced load regimes over time. That bridge connects New
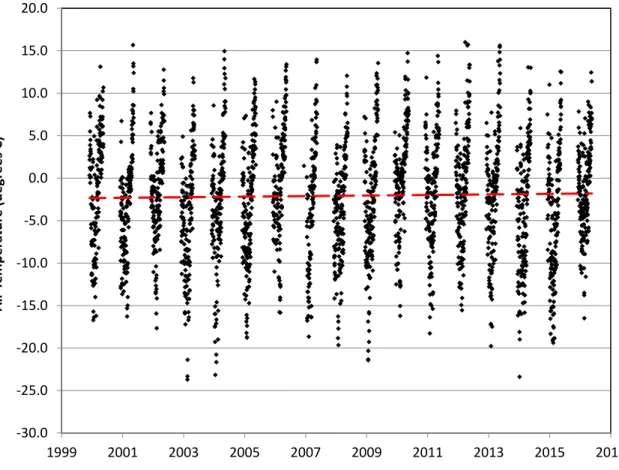
ii Brunswick and Prince Edward Island. It is 11 km long and has 44 piers, some of which are instrumented to monitor loads. Twenty years of data were analyzed in an attempt to perceive some indication of climate pattern changes. In all cases, consistent trends were observed, but are minor compared to data scatter. Air temperature shows a 0.66oC increase, concurrent with an overall decrease in ice thickness of 12 cm and an increase of 96 cm/s in wind speed.
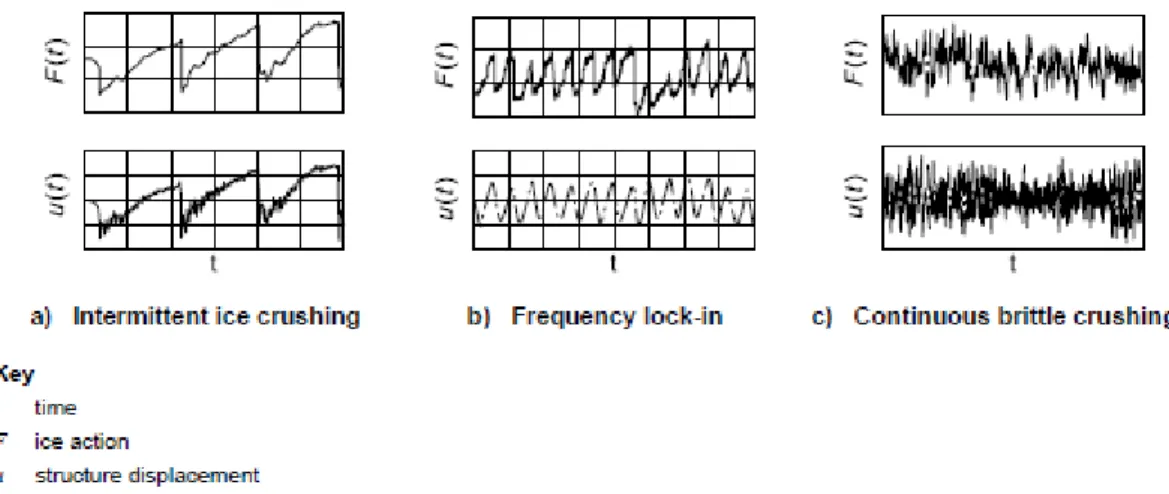
Depending on several factors, dynamic loading of bridge piers by ice may lead to structural failure. A preliminary overview of cyclic ice-pier interaction (intermittent ice crushing, continuous brittle crushing and frequency lock-in) is presented. Fatigue and resonance are two parameters that have to be addressed in design. Physical modeling is a small-scale simulation designed to better understand the behavior of a significantly larger event. NRC has extensive experience in the matter. This is a tool that could be put to good use later on, if required.
iii
Table of Contents
Executive Summary ... i
Table of Contents ... iii
Table of Figures ... v
Table of Tables ... vii
1. Introduction ... 1
2. Preliminary statement of work ... 2
2.1 Identify the parameters ... 2
2.2 Assessment of today’s loads ... 2
2.3 Assessment of future loads ... 2
2.4 Update to codes ... 3
3. Preliminary findings ... 4
3.1 Survey of standards that guide bridge design ... 4
3.1.1 General ... 4
3.1.2 Bridge codes in Canada ... 4
3.1.3 Bridge codes in the US ... 5
3.1.4 Other codes ... 5
3.1.5 How ice forces in bridge codes may be affected by climate change ... 6
3.2 Bridges in Canada that cross water expanses (river, lakes, sea water) ... 8
3.2.1 British Columbia (BC) ... 9 3.2.2 Alberta (AB) ... 10 3.2.3 Saskatchewan (SK) ... 14 3.2.4 Manitoba (MB) ... 14 3.2.5 Ontario (ON) ... 15 3.2.6 Québec (QC) ... 16 3.2.7 New Brunswick (NB) ... 17
3.2.8 Prince Edward Island (PEI) ... 18
3.2.9 Nova Scotia (NS) ... 19
3.2.10 Newfoundland and Labrador (NL) ... 21
3.2.11 Yukon (YT) ... 22
3.2.12 Northwest Territories (NWT) ... 22
3.2.13 Nunavut (NU) ... 24
3.2.14 Ice impact on the Canadian bridge infrastructure and climate change ... 25
3.3 Contacts and useful links ... 26
3.3.1 British Columbia ... 26 3.3.2 Alberta ... 27 3.3.3 Saskatchewan ... 28 3.3.4 Manitoba ... 28 3.3.5 Ontario ... 28 3.3.6 Québec ... 29 3.3.7 New Brunswick ... 29
iv
3.3.9 Nova Scotia ... 30
3.3.10 Newfoundland and Labrador ... 31
3.3.11 Yukon ... 31
3.3.12 Northwest Territories ... 31
3.3.13 Nunavut ... 31
4. Possible climate change effects on the Confederation Bridge ... 32
4.1 Bridge description ... 32
4.2 Bridge relevance to design – Accounting for climate change ... 33
4.2.1 Air temperature ... 34
4.2.2 Ice thickness ... 34
4.2.3 Wind speed ... 36
4.3 Summary ... 37
5. Dynamic loading on bridge piers ... 38
5.1 Modes of cyclic ice-structure interaction ... 38
5.1.1 The first mode ... 38
5.1.2 The second mode ... 38
5.1.3 The third mode ... 38
5.2 Parameters involved, design considerations and ice load calculations ... 39
5.2.1 Fatigue ... 39
5.2.2 Resonance ... 40
5.3 Climate change implications ... 40
6. Physical modeling of ice-pier interaction at NRC ... 41
6.1 General principles ... 41
6.2 NRC experience ... 41
6.2.1 Basin studies in Ottawa ... 41
6.2.2 Centrifuge modeling ... 42
7. Way forward ... 44
v
Table of Figures
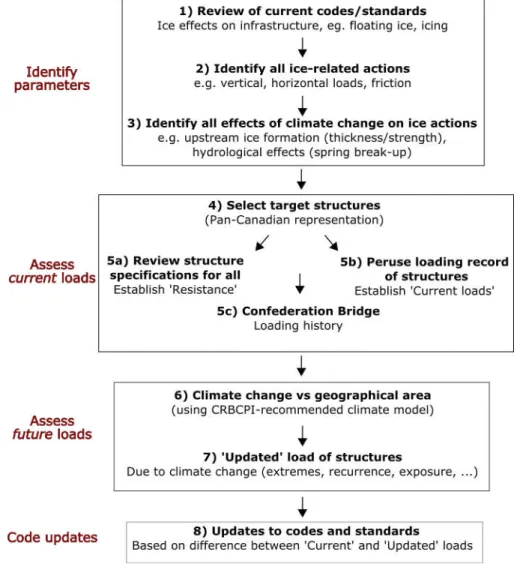
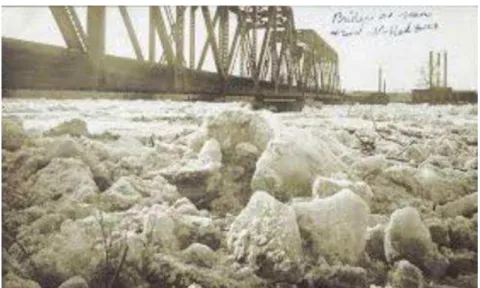
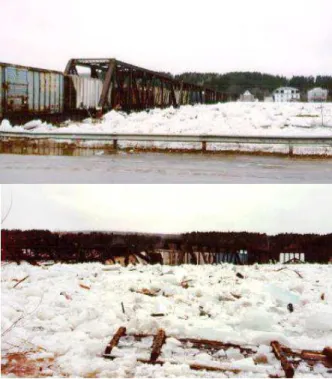
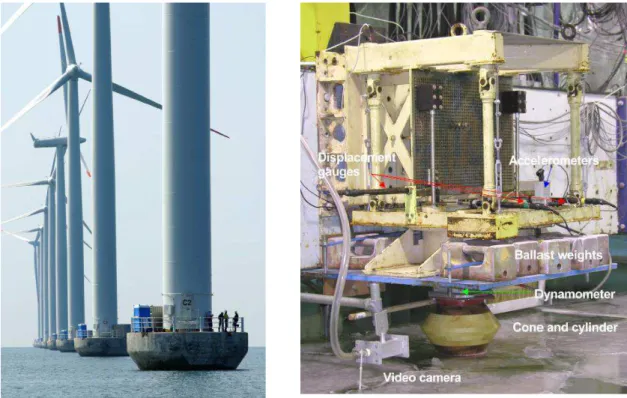
Figure 1: Approach to updating codes and standards in relation with bridge pier loading by ice. ... 3 Figure 2. Top left and right) Ice reaching the superstructure of a bridge located in Golden, across the Kicking Horse River on Highway 95. Bottom) Ice jam in Prince George on the railway bridge at the confluence of the Fraser River and the Nechako River. ... 10 Figure 3. Top) Hondo bridge pier. Bottom) Pembridge bridge pier. From Lipsett and Gerard, 1980. ... 12 Figure 4. Ice jam acting on a railway bridge on the Red Deer River. Courtesy of Peel's Prairie Provinces, a digital initiative of the University of Alberta Libraries. ... 13 Figure 5. Bridge crossing at Fort Vermillion. ... 14 Figure 6. Collapse, due to ice loading, of a bridge located on Tobacco Creek on PR 332 (MB). Courtesy of Manitoba Infrastructure and Transportation. ... 16 Figure 7. Top) Ice jam at a railway bridges in New Brunswick. Bottom) Collapsed bridge under ice forces. Images from the NB River Ice Manual. ... 18 Figure 8. Top left) The East River Bridge, in Sheet Harbour NS - courtesy of NSDTIR. Top right) Schematic of the piers geometry (from a technical memo provided by the NSDTIR). Bottom) The new Sydney River Bridge - courtesy of Transportation and Infrastructure Renewal. ... 20 Figure 9.The Sir Robert Bond Bridge, over the Exploits River, at the town of Bishop’s Falls (two angles). Note the signs of abrasion on the concrete piers resulting from ice action. Photos by Krysta Colbourne/Transcontinental Media. ... 22 Figure 10. Deh Cho Bridge, crossing the Mackenzie River, in the NWT. Top) Structure drawing (source: Wikimedia). Middle and bottom) Near and far range views of the bridge (source: The Deh Cho Bridge Project website by NWT Transportation) ... 24 Figure 11: Top) The Confederation Bridge sustaining ice action – drift is toward the right (S. Prinsenberg, April 2003). Note the linear wake behind the piers. Bottom) View of the bridge from the New Brunswick shoreline – taken by one of the authors (LP), January 2007. ... 33 Figure 12: Profile of the Confederation Bridge. ... 34 Figure 13: Daily average temperatures during the ice season in Summerside PEI. The dashed red line is a linear regression – it shows a very small increase in temperature over a 16 year time span. ... 35 Figure 14: Ice action at the water line (S. Prinsenberg, April 2003). ... 35 Figure 15: Average ice thickness at the Confederation Bridge from Canadian Ice Service Regional Charts. The dashed red line is a linear regression – it shows a very small decrease in thickness over a 15 year time span. ... 36 Figure 16: Daily average wind speeds during the ice season in Summerside PEI. The dashed red line is a linear regression – it shows a very small increase in speed over a 16 year time span. ... 37 Figure 17: Three types of loading scenarios (CSA/ISO 19906, 2011, p. 199). See text for discussion. ... 39 Figure 18: Left) Photograph showing as-built offshore wind turbines and ice-breaking cones (55j inverted cone), Nysted Offshore Wind Farm near Rødsand, Denmark (Barker
vi et al., 2005). Right) Experimental apparatus used to simulate the interaction with ice – note the structure is upside down (Barker and Timco, 2002). ... 42 Figure 19: Ice test package next to the C-CORE centrifuge basket – that facility was used by one author to conduct ice-pier interaction (Barrette et al., 1999; Barrette et al., 2000). ... 43
vii
Table of Tables
Table 1: Preliminary overview of the bridge infrastructure managed by each of the provincial and territorial jurisdiction in Canada. Some of these numbers are estimates. See text for more information. ... 9
1
1. Introduction
There is a significant number of bridges in Canada that cross water expanses which freeze in the winter. That ice exerts horizontal loads on the piers of bridges, the effect of which has to be factored in the design of these structures. Also the river stage at break-up potentially brings the bridge superstructure into contact with ice. How are these loads likely to change over time, due to climate change?
Global warming is affecting ice growth patterns in response to changes both in the water and in the atmosphere. Air temperature evolution over time is a prime parameter when evaluating these loads. There are two main reasons. Firstly, that parameter has a direct bearing on ice growth and therefore on the thickness ultimately achieved by the ice. Secondly, temperature also affects the mechanical strength of the ice – warm ice is weaker than cold ice. The extent of these temperature changes needs to be addressed in order to guide codes and standards on bridge designs and construction. Other parameters should also be considered even though they only indirectly affect ice-structure interaction. For instance, snow act as an insulating material, slowing down growth. Winds and hydrological regimes control displacement rate, which in turns influences ice strength.
The purpose of this report is two-fold. Firstly, it is to present a preliminary statement of the work the authors feel would be required in order to evaluate ice action against bridges and the impact climate change may have in the long term on this infrastructure. Secondly, the report includes the outcome of initial findings to guide the proposed follow up investigations. The work summarized in this report will lead to follow up investigations whose ultimate objective is to produce design recommendations that can be fed into relevant codes and standards.
2
2. Preliminary statement of work
If we are to advance current knowledge on bridge pier loads due to ice, present and future, several aspects will have to be approached in a sequential manner (Figure 1).
2.1 Identify the parameters
The first step is to compile a review of all current codes/standards related with ice effects on bridges, to obtain an idea of what is covered and what is not (knowledge gaps). This will also provide guidance in assessing the factors that need to be addressed. A comprehensive listing of these factors as well as any others should be compiled. This includes both the nature of the ice action (vertical, horizontal loads, friction) as well as the following parameters:
Air temperature (number of ‘freezing degree-days’) Upstream ice formation (thickness/strength)
Hydrological effects (particularly with reference to spring break-up and river stage)
Current velocity
2.2 Assessment of today’s loads
A representative sample will be collected of the bridges that span water bodies in the country. This will provide an understanding of the types of structures, their design to withstand ice action and their usage. On that basis, we will select a specific number of target structures – the number has yet to be determined – from various geographical areas (Pan-Canadian representation). Good candidates will be those for which there is a load record. For instance, the current CSA bridge code CSA-S6-06 is based on ice load measurements from only two bridges in the West (northern Alberta). These will be augmented by existing NRC in-house data.
The Confederation Bridge has been recording loads for about 20 years. These loads are currently being used to validate CSA/ISO 19906. Load data will be analyzed as part of the proposed project for extrapolation purposes.
The ultimate purpose of the exercise is to establish a link between the ice loads sustained at the selected locations, the nature of the ice at these locations and the recommendations in the existing codes. This will give us the opportunity to improve the current guidelines, and also allow us to establish a baseline against which future scenarios can be compared.
2.3 Assessment of future loads
In order to assess what loads can be expected at any given target location, we will need to estimate the ice conditions upstream of the bridge, namely thickness, size of drifting fragments and ice type and temperature (for strength determination). A critical parameter will be the number of freezing degree-days, which will be derived from the climatic model recommended to us by CRBCPI. This procedure will be calibrated against data from the previous step, where loads, ice conditions and temperature data were analyzed. For each selected structure, a parametric analysis will be conducted, where ice thickness and strength as well as temperature will be varied, thereby providing a range in expected
3 ice actions. The ultimate purpose of the exercise is the production of an updated load of structures due to climate change (extremes, recurrence, exposure, ...).
Figure 1: Approach to updating codes and standards in relation with bridge pier loading by ice.
2.4 Update to codes
The difference in loading between what the bridges see today with what they are expected to see in the next 50 and 100 years will be derived from the preceding exercises. Adaptation strategies, along with a baseline for prioritization, will be discussed at that stage.
4
3. Preliminary findings
In March 2017, OCRE was approached by CRBCPI to compile some information on the work plan shown in Figure 1. This preliminary work was divided into five parts:
Survey of standards that guide bridge design
Comprehensive listing of bridges in Canada that crosses water expanses (river, lakes, sea water), and related structural/hydrological parameters
Preliminary analysis of ice and climate data at the Confederation Bridge (PEI) Dynamic loading of bridge piers due to ice
Previous NRC experience with the physical modeling of ice-pier interaction This section summarizes the outcome of this preliminary work.
3.1 Survey of standards that guide bridge design
3.1.1 General
Standards are prepared by standards development organizations (SDO). The actual writing is done by a committee of technical experts and interested parties, and generally uses a consensus approach in deciding on content. Standards or codes usually comprise two parts, a normative or mandatory part that sets out requirements that must be met in order to conform to the standard and an informative (non-mandatory) commentary part providing guidance on how to meet the normative provisions.
The Standard Council of Canada is the national body that accredits SDOs. To be accredited requires that certain procedures be followed in the development and support of a standard. Some authority, usually a governmental one, mandates the use of a standard for particular applications.
3.1.2 Bridge codes in Canada
In Canada, the Canadian Standards Association (CSA) is one of several SDOs. CSA has a history of developing, supporting, and periodically revising a bridge design code. CSA has developed and continues to support the Canadian Highway Bridge Design Code, commonly referred to as the CHBDC. The most recent edition, the 11th, was published in 2014. It comprises two documents:
CSA S6-14 - Canadian Highway Bridge Design Code. Mandatory requirements of the code which is based on limit states design principles, defined design loadings, load combinations and load factors, criteria for earthquake resistant design, and detailed design criteria for the various structural materials used in bridges. This Code has been written to be applicable in all provinces and territories of Canada. It provides requirements for determining ice loads on bridge piers.
CSA S6.1-14, Commentary on CSA S6-14, Canadian Highway Bridge Design Code. This provides rationale and explanatory material for many of the clauses of this code. It contains background on ice load requirements.
5 In Canada, the mandate for establishing design and construction requirements for highways, including highway bridges, lies with the provincial and territorial governments. All provinces and territories, with the exception of Manitoba, have mandated CSA S6-14 for use within their jurisdictions. Most provinces and territories also publish supplements or exceptions to the bridge code to deal with situations specific to their local requirements. Examples of exceptions include:
Level of extreme river stage: 50-year, 100-year, 200-year Load restrictions on infrequently used bridges, etc.
Supplementary documents have been located by web searches for Alberta, British Columbia, Manitoba, Ontario, Quebec and Saskatchewan. A more exhaustive search was conducted (section 3.2) and additional documents were located and reported upon therein. Manitoba partners with the US Federal Highways Administration (FHWA) use AASHTO LFRD1 Bridge Design Specification for the following reasons:
Better support for the LRFD code than what is available for CHBDC More software applications for applying the provisions of the code
More research and reference material available (typically due to the availability of funding in the US for this)
Code updates and changes in the AASHTO LRFD code appear to be better reviewed.
The Canadian and US codes note that they are exclusively for use in freshwater bodies (rivers and lakes), and are not applicable for sea ice loads. The likely reason is that the experience base for the codes is bridges across rivers. CSA S6 does include some guidance on wave loading.
3.1.3 Bridge codes in the US
In the US, the American Association of State Highway and Transportation Officials (AASHTO) develops and revises new editions of their bridge code nominally every two years, most recent AASHTO LFRD Bridge Design Specification, 2014, 7th edition
Different format to deal with code requirements and commentary; it uses two columns, left one the code requirements, the right one commentary. The provisions for ice loading are identical to and refer to the CHBDC.
3.1.4 Other codes
The International Organization for Standardization (ISO) has an offshore code ISO 19906 Arctic offshore structures, which addresses a range of offshore structures in sea ice and marine environments. In terms of environmental loading from waves and ice it would be an applicable code for bridges in a marine (sea ice) environment such as the
Confederation Bridge. ISO 19906 is part of a suite of nine ISO standards that deal with environmental, structural design, materials and operational factors in a marine offshore environment.
6 For countries within the European Union a series of European standards known as
Eurocodes (EN) related to construction have come into force. The objective is to have a set of harmonized technical rules for the design of construction works throughout the EU.
o The structure codes start with EN1900: Basis of structural design covering safety, serviceability, durability and structural reliability.
o Additional codes in the series EN 1991 to EN 1999 cover definition of loading, structural design with different materials and foundations. o They apply to structural design of buildings and civil engineering works,
including highway bridges.
o There is no separate standard for highway bridges; bridge related aspects for different construction materials are addressed within each individual standard.
o As a separate initiative, Handbook 4 Design of Bridges (2005) provides a unified approach and refers to relevant parts of the Eurocodes.
o Provision is made for national annexes wherein certain parameters noted in the main standard are specifically left open to national choice
(Nationally Determined Parameters). These primarily are for issues related to climate and/or safety.
Norway has recently (2015) published a code for highway bridges and ferry piers in Norway. It has used ISO 19096 for guidance on ice forces on bridge piers and port structures. It is applied to structures in rivers, lakes and in coastal waters.
3.1.5 How ice forces in bridge codes may be affected by climate change
At this stage, it is worthwhile to briefly explore how climate change could affect the factors in codes that are used to determine ice loads. The CSA code is used here as an example but other codes will be similarly affected.
3.1.5.1 Load determination
CAN/CSA-S6-14 Canadian Highway Bridge Design Code is intended for calculating ice impact forces on highway bridge piers in rivers and lakes. Ice can fail in bending or crushing against a bridge pier and equations are provide for calculating ice load in either case. The equations contain environmental factors that are dependent upon climate and design factors for bridge piers that are optimized for the pier to serve its function.
The equation for ice failing in bending against a bridge pier is
Fb = Cn p t2
where
Cn = 0.5 tan (α + 15°), with α the slope from the horizontal of the pier’s leading
edge slope
p is effective ice crushing strength t is ice thickness at time of break-up
7
Fc = Ca p tw
where
Ca= √(5t/w + 1) w is pier width
and t and p are as defined previously.
The value of effective ice crushing strength, which is used in both equations, is not precisely defined. The code states (clause 3.12.2.1, p. 67):
“Unless more precise data is available, the following values for the effective crushing strength of ice, p, shall be used:
(a) the ice breaks up at melting temperature and is substantially disintegrated: 400 kPa; (b) the ice breaks up at melting temperature and is somewhat disintegrated: 700 kPa; (c) the ice breaks up or ice movement occurs at melting temperature and is internally sound and moving in large pieces: 1100 kPa; and
(d) the ice breaks up or ice movement occurs at temperatures considerably below the melting point or the ice: 1500 kPa.”
The values are rounded to whole numbers. A broad range of choices for ice crushing strength are available to the designer. The commentary adds the following (clause C3.12.2.1, p. 87):
“As a guide, the 400 kPa stress applies at localities in which ice effects are minimal, and the 1500 kPa stress is appropriate where ice loads are expected to be severe. The effective ice strength depends primarily on the temperature and coarseness of the ice texture. However, the tensile strength is not sensitive to temperature.”
On the matter of ice crushing strength, this still leaves a broad range with limited guidance.
3.1.5.2 Factors likely to be influenced by climate change
Thus there are two environmental input factors in the load calculation which will likely change in the future as the climate changes: ice thickness t and effective ice strength p. These factors in turn are dependent primarily upon air temperatures and precipitation (snow fall and snow depth). Temperature is a simple factor, but what is more important is its involvement in the more complex matter of climate patterns, as they will affect the thickness of the ice and its strength at the time of Spring breakup.
Future input needs include
Seasonal air temperatures Seasonal precipitation River stage at breakup
Climate patterns in winter and spring Outputs for revised or new codes include:
8 New distributions of ice conditions (thickness, strength and river stage) at
breakup for input to existing equations, A different range of ice crushing strengths
Possibly new formulas including other factors for determining ice forces
Other issues could be considered. For instance, provincial manuals or guides should be reviewed carefully in terms of how changes proposed would be applied in provincial jurisdictions. Also, a liaison could be established between the Climate-Resilient Core Public Infrastructure Project at NRC and the CSA Technical Committee on the Canadian Highway Bridge Design Code. NRC already participates in one of the subcommittees, durability, but our interest might be expanded.
3.2 Bridges in Canada that cross water expanses (river, lakes, sea water)
This section’s main objective was to initiate a comprehensive listing of bridges crossing water expanses in each province and territory. Stakeholders throughout the country were approached, including officials from provincial/territorial government departments responsible for bridge design, construction and maintenance, as well as personnel responsible for hydraulics and hydrological analyses, and monitoring and forecasting of ice and floods. For each province and territory, we have:
1. Identified key stakeholders;
2. Collected (or are in the process of collecting) a list of all bridges crossing water expanses which could be exposed to ice during the winter season;
3. Identified key bridges that have (or have had) piers on which ice loads are (or were) measured, or from which ice conditions/interactions are (or were) monitored;
4. Identified some recently designed bridges for which ice conditions were analyzed in more details during the design process and collected related relevant data, including drawings, pictures and engineering technical memoranda;
5. Collected known and available information on historical ice-related events that resulted in bridge damage or failure; and
6. Identified exceptions (when applicable) to the design code published by the province/territory used to account for situations specific to ice-related local requirements. Note that, as mentioned in section 3.1.2, all provinces and
territories use the Canadian Highway Bridge Design Code – CHBDC – with the exception of Manitoba which uses the AASHTO LFRD Bridge Design
Specification.
A brief summary of the information collected for each province and territory is presented in this section.
Table 1 is a preliminary count of the bridge network in the country crossing water. These do not include bridges managed by municipalities and the private sector.
9
Table 1: Preliminary overview of the bridge infrastructure managed by each of the provincial and territorial jurisdiction in Canada. Some of these numbers are estimates.
See text for more information.
3.2.1 British Columbia (BC)
The Ministry of Transportation (MoT) of British Columbia manages an inventory comprising of 4,500 structures throughout the province. For many of these structures, mostly those located in the south and southwest portions of the province, ice is not an important factor because these bridges are not exposed to ice conditions regularly and consistently during the winter season. The MoT maintains a Bridge Management Information System, to which the authors required access – that request has not been accepted as of this writing. The MoT is also currently preparing, for NRC, a list of bridges that are exposed to ice conditions for the entire province.
BC uses a supplement (published in a few volumes) to CHBDC S6-14, which is meant to be used in conjunction with the latter. Only Section 1.9.7.1 of Volume 1 refers to ice-related design considerations; additional specifications are provided with respect to vertical clearance. There is no explicit mention of ice loads in these documents.
The province has had a few historical events during which ice accumulations were reported to have reached the superstructure of bridges after an ice jam had formed or had been released, or during which ice jams had formed between a bridge’s piers (Figure 2). There were no recent bridge damage or failure identified resulting from ice actions in BC. There were no instrumented bridge piers for ice loads or bridges from which ice was specifically being monitored, identified within the province.
Jurisdiction Crossing water
Alberta 1,877 British Columbia 300 Manitoba 650 New Brunswick 2,600 Newfoundland and Labrador 3,600 Northwest Territories 618 Nova Scotia 113 Nunavut 5 Ontario 2,800 Prince Edward Island 1,300 Quebec 6,186 Saskatchewan 2,200 Yukon 129 22,378 Total
10
Figure 2. Top left and right) Ice reaching the superstructure of a bridge located in Golden, across the Kicking Horse River on Highway 95. 2 Bottom) Ice jam in Prince George on the railway bridge at the confluence of the Fraser River and the Nechako
River. 3 3.2.2 Alberta (AB)
The Alberta Ministry of Transportation (MoT), along with rural municipalities within the province, manage an inventory of over 23,600 structures (including bridges and bridge-sized culverts). The MoT provided the authors with a comprehensive list of structures in which information such as structure ID, geographical coordinates, type of structure, number and length of spans, age of structure, number of piers, materials, and much more, were listed. Within this list, bridges characterized as ‘major bridges’ with multiple spans are of the most interest with respect to ice. There are a total of 1,877 of these bridges in AB; they have a number of spans ranging between 2 and 28, and the length ranges from 6.1 m up to 1,494 m.
To complement CHBDC S6-14, for all projects involving bridge-sized structures, AB uses a series of guidelines that cover all aspects of bridge conceptual design, including 2 http://www.cbc.ca/news/canada/british-columbia/ice-jam-threatens-bridge-in-golden-b-c-1.2460456 3 http://www.cbc.ca/news/canada/british-columbia/fire-chief-says-children-playing-on-frozen-river-the-most-irresponsible-thing-he-s-seen-in-29-years-1.3914841
11 bridge location, sizing, geometries, and river protection works. In these guidelines, the following ice-related considerations are mentioned:
The potential impact of the pier locations should be assessed with respect to their impact on ice conditions (Sections 2.2.4 and 3.1);
Vertical clearance with respect to high ice-flood or ice-jam levels (Section 3.2.2.2);
To resist ice forces, the use of riprap is recommended as a river protection works design (Section 3.2.3); and
Ice-related design considerations should include design forces on piers, vertical clearance for ice jams, and structure blockage due to icing/aufeis (Section 3.2.4.1).
A new version of these guidelines will be released in the near future. MoT’s Structural Engineering Specialist, John Alexander, is the Chair of the CHBDC Technical Committee and the MoT’s representative on the regulatory authority committee. The MoT also sits on several technical sub-committees.
Several of Alberta’s bridges are crossing large rivers in the northern part of the province (e.g. the Peace River and the Athabasca River) and have a significant history of ice-related issues. Alberta Environment and Parks does annual monitoring of both these rivers during the break-up season. The bridges over the Athabasca River near Fort McMurray may be of particular interest for the present study.
There were no bridge failures due to ice events in recent history. However, there were some in the late 1800s and early 1900s; these were mostly due to vulnerable designs. The MoT has a tool, available for download, called the Hydrotechnical Information System (HIS) – it includes most flood observations at bridge sites managed by Alberta Transportation, including ice-related events.
Currently, there are no instrumented bridge piers in the province on which ice loads are measured or bridges from which ice conditions are monitored. However, the Alberta Research Council (ARC) collected a wealth of ice load data from instrumented bridge piers in the late 1960s through the late 1980s. The bridge crossing the Athabasca River on Highway 2 near Hondo was built with access and monitoring equipment to facilitate a study by the ARC (Figure 3). The instrumented bridge pier has a semicircular shape, is inclined 23° from the vertical, and has a diameter of 2.32 m. Accelerometers were also installed to measure the longitudinal and transverse acceleration of the pier. A total of 22 ice loading events were recorded from that pier (ice loads varied from 260 to 2,270 kN; ice thicknesses reported ranged from 0.4 to 1.1 m; ice floes were 5 to 50 m in diameter; and ice drift speeds between 0.4 and 2.9 m/s). During the same decades, another bridge crossing the Pembina River, in Pembridge, was also instrumented (Figure 3). This pier has a vertical face with a diameter of 0.86 m. A total of four ice loading events (all from the year 1974) were recorded (ice loads varied from 350 to 1,060 kN; ice thickness was reported to be 0.45 m; ice floes were 20 to 40 m in diameter; and ice drift speeds were estimated to be 1.04 m/s). The equipment has since been removed from both of these bridges. The ice load data collected from these bridges have been incorporated into the NRC Ice Load Catalogue (Timco et al., 1999).
12
Figure 3. Top) Hondo bridge pier. Bottom) Pembridge bridge pier. From Lipsett and Gerard, 1980.
Bernard Trevor, the current manager of the River Forecast Team with Alberta Environment, was involved in the projects during which ice forces on the bridges in Hondo and Pembridge were measured by the ARC. Mr. Trevor graciously provided the authors with scanned copies of six separate reports pertaining to these projects from the late 1970s and the 1980s (Huiskamp, 1983; Lipsett and Gerard, 1980; Lipsett and Montgomery, 1979; Van Der Vinne, 1988a; 1988b; 1988c). The ARC had also instrumented a bridge pier in advance of the flooding of the Oldman River dam reservoir. However, with the disbandment of the ARC in the early 1990s; no measurements were taken.
Bernard Trevor mentioned one historical event (around 1940) on the Red Deer River during which a railway bridge failed from river ice actions. We have not been able to locate the exact photo of the event, but Figure 4 shows how severe ice jams were on the Red Deer River on that bridge.
13 The river ice forecast team at Alberta Environment monitors freeze-up and break-up of the Peace River near the Town of Peace River, and break-up of the Athabasca River near Fort McMurray due to the high ice jam flooding risks at these communities. Over the last few years, they have observed significant ice runs at Fort McMurray. There are a number of bridges in that area: triple bridge crossing within Fort McMurray, Suncor mine site bridge north of Fort McMurray, and the Highway #63 crossing of the Athabasca River near Fort MacKay.
Figure 4. Ice jam acting on a railway bridge on the Red Deer River. Courtesy of Peel's Prairie Provinces, a digital initiative of the University of Alberta Libraries4.
Flows on the Peace River are controlled by BC Hydro and ice events on that river have not been spectacular in recent years. There is a bridge on Highway #986 crossing of the Peace River a few miles north of the Town of Peace River. A second bridge at the Town of Peace River is planned to go to tender before the summer of 2017. There is another bridge on Highway #88 crossing at Fort Vermillion (Figure 5). This bridge’s piers were specifically shaped to reduce ice loads. Pier vibration tests were also conducted over two winters – it has not yet been possible, as of this writing, to confirm if these tests were successful and if a report was issued.
14
Figure 5. Bridge crossing at Fort Vermillion. 3.2.3 Saskatchewan (SK)
Saskatchewan’s Ministry of Highway & Infrastructure (MHI) manages approximately 700 bridges (75% of which are short span bridges with slender substructure elements of either timber or pipe piling), and the Saskatchewan Association of Rural Municipalities (SARM) manages a little over 1,500 bridges located on lower level roads (SARM do not have larger bridges as the main traffic is expected to utilize nearby provincial highway crossings). MHI and SARM are both currently preparing a list of bridges over watercourses at the authors’ request – both organizations advised that this will take them some time. Major bridges that are exposed to ice and that might be of interest in the context of this study are bridges over the Saskatchewan River system, Battle River, and bridges located in the North of the province.
SK doesn’t have or use any general exceptions to the CHBDC S6-14. If they do require something specific for a given bridge construction, it would be listed in the Contractors and Consultants Bridge Design Criteria. This would however be on a project by project basis, only when and if required.
MHI does not keep a database of historical ice-related events or issues on their bridges. According to them, only a small number of bridges have had ice damage over the years, and these bridges had either timber piers or unfilled pipe piles bent. There were no recent bridge damage or failure identified resulting from ice actions in SK.
There were no instrumented bridge piers for ice loads or bridges from which ice was specifically being monitored, identified within the province.
3.2.4 Manitoba (MB)
Manitoba Infrastructure and Transportation (MIT) is responsible for an asset inventory of over 3,000 structures on the highway and water control networks, of which 1,150 are bridges and overpasses, and 650 are bridges crossing watercourses. MIT is currently preparing a list of all the bridges for the entire province of MB for NRC; they are advising that this will require some time.
As previously mentioned in this report, in Manitoba, the design and detail of all bridge structures and structural components have to conform to the requirements set forth in the latest edition, including the interim update(s), of the AASHTO Load and Resistance
15 Factor Design (LRFD) Bridge Design Specifications. MIT also publishes and uses a Structures Design Manual to modify and amend specific parts of AASHTO. In this manual, ice loading and vertical clearance requirements (Sections 2.2.4.1 and 2.2.4.2.3) are vaguely discussed. Although MIT do not design to the CHBDC, it is an alternate code that they also use and refer to internally.
There is no known damage or failures of “major” bridges caused by ice in MB. They have seen some failures due to ice loading, but these were typically timber bridges crossing provincial drains (these drains are typically man-made and ice floes typically come in larger pieces; the ice impact then bents the timber or steel bent). An example is the collapse, in April 2011, of a bridge located on Tobacco Creek on PR 332, approximately 5 km north of Lowe Farm Manitoba (Figure 6). The bridge was a typical four span timber bridge on timber piles. The ice destroyed the interior pile bent, causing collapse, with one span separating from the structure completely. There were likely other similar cases on similar types of bridges in the past few decades, but these are not catalogued or recorded in a specific database.
There were no instrumented bridge piers for ice loads or bridges from which ice was specifically being monitored, identified within the province.
3.2.5 Ontario (ON)
Ontario’s Ministry of Transportation (MoT) owns approximately 2,800 bridges on the provincial highway system (in addition to many culverts, retaining walls, sign supports and other highway infrastructure). Within the MoT, the Bridge Office contributes to the management of this infrastructure with the development, maintenance, and implementation of policies, procedures, guidelines, standards, manuals and specifications. The MoT’s Bridge Office is currently preparing a list of all bridges crossing water expanses for the province, which will be provided to the authors; they have to consult with all regional offices and have advised that it will take them some time.
According to Tony Merlo, Manager of the Bridge Office, bridge design with respect to ice is performed according to the CHBDC only. While there is a document that complement the CHBCD (“Exceptions to the CHBDC CSA S6-14 for Ontario”), the latter does not mention any specifications related to ice.
In the late 1980s and early 1990s, NRC instrumented a pier on the Minto Bridge, a heritage bridge crossing the Rideau River in Ottawa (Johnston et al., 1999). The pier is V-shaped in the horizontal plane, has a vertical face at the waterline, and a width perpendicular to the ice movement of 2 m. The ice load measurements were conducted as part of an experimental program during which controlled blasting of the river ice initiated an artificial break-up run. A total of 13 ice loading events were recorded from that pier (ice loads varied from 12 to 160 kN, ice thicknesses reported ranged from 0.3 to 0.6 m; ice floes were 2 to 15 m in diameter, and ice drift speeds between 0.75 and 1.25 m/s). These data have been incorporated into the NRC Ice Load Catalogue. There are currently no instrumented bridge piers in the province on which ice loads are measured or bridges from which ice conditions are monitored. There were no recent bridge damage or failure identified resulting from ice actions in ON.
16
Figure 6. Collapse, due to ice loading, of a bridge located on Tobacco Creek on PR 332 (MB). Courtesy of Manitoba Infrastructure and Transportation.
3.2.6 Québec (QC)
In the province of Quebec, the Ministère des Transports, de la Mobilité durable et de l'Électrification des transports (MTMDET) is responsible for a total of 6,185 bridge crossing watercourses. The MTMDET has provided the authors with a full list of these bridges, which includes the following information: structure ID, road, name of obstacle, municipality and geographical coordinates.
QC published and uses guidelines (in a few volumes) to the CHBDC S6-14, the “Manuel de conception des structures”. Section 3.4 of Volume 1 vaguely mentions ice loading; the Hydraulic Design Manual (Volume 3) has requirements with respect to the vertical clearance and ice levels.
17 It was difficult to obtain information from the MTMDET on historical events for which ice actions on bridges resulted in either damage or failure of the structure. No major event was found through a superficial search on the internet, although there surely exist historical events during which high water levels resulting from ice-related flooding would have impacted or endangered the superstructure of some bridges in the province.
There were no instrumented bridge piers for ice loads or bridge from which ice was specifically being monitored, identified within the province. However, a few lighthouses in the St. Lawrence Seaway have been instrumented in the past (e.g., Frederking et al., 1992). Also, the Pierre Laporte Bridge (in Quebec City) and the Laviolette Bridge (in Trois-Rivière) have cameras overlooking the St. Lawrence River (which can be accessed in near real-time).
3.2.7 New Brunswick (NB)
The New Brunswick Department of Transportation and Infrastructure (NBDTI) is responsible for over 2,600 bridges and culverts within the province. Most of the bridges in NB are solely exposed to freshwater ice, but some of them located in coastal areas are exposed (at least partially, depending on the tidal regime) to saline ice. The authors requested a more detailed listing of bridge structures within the province; the NBDTI has yet to confirm whether or not they will be able to provide such a list.
Because the province has historically been extremely vulnerable to floods, and because 70% of the floods in NB are ice-related, the province has adopted a proactive approach in how they deal with these issues by sponsoring a fair amount of river ice research on their rivers. A NB Subcommittee on River Ice was established under the Flood Forecasting Technical Committee within the Canada-New Brunswick Flood Damage Reduction Program (FDRP). The Subcommittee is composed of the following agencies: New Brunswick Department of Environment (NB ENV), the New Brunswick Electric Power Commission (NBEPC), the University of New Brunswick (UNB), and Environment Canada, as represented by the National Water Research Institute (NWRI), the National Hydrology Research Institute (NHRI), the Atmospheric Environment Service (AES), the Water Resources Branch (WRB) and the Water Planning and Management Branch (WPM). This Subcommittee has published a ‘NB River Ice Manual’, which provides details of general river ice processes and specific characteristics of the river ice regime in New Brunswick’s rivers. Many of the researchers involved in this Subcommittee also have published a significant amount of literature over the past few decades.
Several ice-related floods and ice-related bridge damage events have occurred in NB (e.g., Figure 7), notably on structures crossing the Saint John River. Beltaos et al. (2003; 2006) reported several ice-related flood events (in the late 1800s, early 1900s and one in 1970) that resulted in five or more bridges being damaged or destroyed, with the 1970 ice-induced flood resulting in 32 bridges destroyed and over 75 bridge structures damaged. Spyros Beltaos, a pioneer in the river ice research, has conducted a lot of his research on the Saint John River in NB. The focus of the river ice research in NB has been with respect to ice jams and ice-induced flooding. Other ice-induced flood-prone rivers in the province include the Nashwaak River, the Canaan River, and the Kennebecasis River.
18 In 1986, a bridge in Bathurst failed due to moving ice floes during a spring freshet, forcing the closure of the road for over one month. In 1987, the Perth-Andover Bridge over the Saint John River sustained superstructure damage due to ice impacts. In 2006, an ice jam on the Saint John River threatened the covered bridge in Hartland. A 2014 flood resulting from an ice jam on the Saint John River caused more than $16M in damage. Two bridges were washed away and one was pushed off its abutments by ice.
While there are no formal exceptions to the CBHDC published for NB, when designing a bridge, in addition to ice loading, the province also considers the impact of bridge piers on the potential for ice jamming, and the potential high water levels during ice-induced floods. As part of the engineering design of a new bridge at Clair in the early 2000s (as reported in Beltaos et al., 2003), the NBDTI optimized the number of piers and their relative location within the channel. This was done to minimize the impact that the new bridge would have on the ice regime, and to minimize the potential for ice jamming and, therefore, for ice-induced flooding. They changed an initial design of four piers to a final design with two, more robust piers.
Figure 7. Top) Ice jam at a railway bridges in New Brunswick. Bottom) Collapsed bridge under ice forces. Images from the NB River Ice Manual.
3.2.8 Prince Edward Island (PEI)
The Department of Transportation, Infrastructure and Energy (TIE) of Prince Edward Island has an overall network of over 1,500 structures, of which 219 are bridges (five overpasses, and the remaining being structures over water). The Highway Design and Bridges section of the Department is responsible for providing design services for the highway and bridge network within PEI, as well as maintaining inspection and
19 maintenance programs. The Department has provided the authors with a comprehensive list of structures in which information such as structure ID, location, type of structure, number and length of spans, age of structure, number of piers, materials, and much more, were listed. Most bridges in PEI are single span bridges (67%); 96% of all bridges have four spans or less. Bridge lengths in PEI vary from 3 to 248 m and averages 22 m. The Department has also identified a sub-list of bridges that they consider would be of interest in the context of this study (i.e., bridges with multiple spans and which are impacted by ice during the winter).
While some of the bridges in PEI are solely exposed to freshwater ice, many of them are located in estuaries and/or close to bays and are exposed to saline ice. Notwithstanding the Confederation Bridge (which is not managed by the province), the bridge with the most spans (17) on the island is in Grand River on Highway 12 (crosses the Grand River which flows into Malpeque Bay). The longest bridge is located in Charlottetown as part of the Trans-Canada Highway and crosses the Hillsborough River.
PEI does not publish or use exceptions to CHBDC S6-14 when designing bridges.
There were no bridge failures or significant damages incurred on a bridge from ice in recent history in the province. It was pointed out by the maintenance people that the most common form of damage caused by ice on their bridges was in the form of abrasion on the sub-structure elements.
Apart from the Confederation Bridge, there are no instrumented bridges in the province. Note that the Confederation Bridge is not discussed here, as an entire section of the present report is dedicated to it.
3.2.9 Nova Scotia (NS)
The Nova Scotia Department of Transportation and Infrastructure Renewal (NSTIR) is responsible for 4,100 bridges (except those under the Halifax Dartmouth Bridge Commission), including 200 steel truss bridges and a large quantity of smaller bridges, with a lot of them built out of timber. NSTIR provided the authors with a list of over 3,600 structures (bridges and culverts) and all available related information (structure ID, location, type of structure, number and length of spans, age of structure, number of piers, materials, etc.), along with a suite of Google Earth KMZ files (which includes these bridges and many more, like overpasses). The NS government also has an ‘open data’ project (https://data.novascotia.ca/) which contains all of the roads, structures (including bridges), and water features within the province.
The NSTIR designs bridges to the CHBDC and do not publish any exceptions to the code with respect to ice (they have a ‘Standard Specification’ document, but it has no mention of ice). All new structures have a hydraulic study completed as part of the pre-engineering work so that high water flows are considered, with and without ice, both in terms of vertical clearance requirements and whether high levels could contribute to additional ice loading.
20
Figure 8. Top left) The East River Bridge, in Sheet Harbour NS - courtesy of NSDTIR. Top right) Schematic of the piers geometry (from a technical memo provided by the
NSDTIR). Bottom) The new Sydney River Bridge - courtesy of Transportation and Infrastructure Renewal.
On one new structure built recently by the NSTIR (the East River Bridge located in Sheet Harbour) and for which ice was specifically considered in the design, ‘ice skirts’ (also referred to as ‘ice shields’ in their documentation) were included on the piers (see Figure 8). Analyses have shown that ice forces generated from crushing on a vertical pier would induce deflections well beyond the Service Limit State (SLS) allowable value. For this reason, in order to promote ice failure in bending and reduce the ice loads, the final design included a sloped surface (the ice skirts) on the piers, with a slope of 38° from the vertical. A similar design was considered for the new Sydney River Bridge. The latter is located in Sydney Harbour and is exposed to tidal conditions; it is therefore exposed to
21 both saline and freshwater ice originating from both the Gulf of St. Lawrence and the river. For both these new bridges, and on all new bridges, the NSTIR allows for an increased vertical clearance based upon the 1:100 flood event (open-water and ice-covered) and an additional amount for sea level rise (when applicable). For the existing infrastructure, the NSTIR typically do not proactively retrofit for water levels or ice flows, unless there is a major rehab of the bridge.
The NSTIR does not keep an exhaustive list of historical ice-related issues/events for bridges in the province. One of the most infamous cases of ice-related bridge failure in the province is that of the Bridgewater Bridge (LUN003). This bridge is a 100+ year old deck truss bridge crossing over the LaHave River. In 2003, ice jams had reached very close to the underside of the bridge and the bridge was closed for engineering assessments. That same structure had one span washed down the river during a flood circa 1976. Similar situations may happen on a somewhat regular basis during spring thaws.
There were no instrumented bridge piers for ice loads or bridges from which ice was being monitored identified within the province.
3.2.10 Newfoundland and Labrador (NL)
In NL, the Highway Design and Construction Section of the Department of Transportation and Works (TW) is responsible for the design, management and maintenance of all bridges. Over 750 bridges were listed in the province, of which 618 are over watercourses. For each of these bridges, additional information was collected, including the structure ID, location, type of structure, number and length of spans, age of structure, number of piers, materials, photos, current state of the structure (with respect to the superstructure and the substructure), the hydrology (including the ice and a list of possible/known ice-related problems on the bridge), and other general observations. TW-NL designs bridges to the CHBDC and do not publish any exceptions to the code. There is no formal registry/database of historical ice-bridge events in NL. Some areas are well known for being prone to ice-induced flooding, such as the Exploits River at the Town of Badger. The Exploits River is the most important river on the Island of Newfoundland. The concrete piers of the Sir Robert Bond Bridge, which crosses the Exploits River at the town of Bishop’s Falls, show clear signs of abrasion resulting from the action of water and ice. Metal plates have been added on the upstream sides of the piers (Figure 9) to offer extra protection against ice abrasion.
No bridges are instrumented for ice loads or used to explicitly monitor ice conditions around bridges in the province.
22
Figure 9.The Sir Robert Bond Bridge, over the Exploits River, at the town of Bishop’s Falls (two angles). Note the signs of abrasion on the concrete piers resulting from ice
action. Photos by Krysta Colbourne/Transcontinental Media5. 3.2.11 Yukon (YT)
Yukon’s Department of Transportation (DoT) maintains 4,800 kilometres of road (from which only 250 kilometres are paved - the third smallest in the country ahead of only the Northwest Territories and Nunavut). Within this highway system, there are a total of 129 bridges. It has been difficult to get in touch with key personnel in the Highways and Public Works Section of the DoT and to obtain more details on their bridge network and design practices. More information will be added in the near future when it becomes available.
3.2.12 Northwest Territories (NWT)
The Highways and Marine Division of the Department of Transportation (DoT) of the NWT manages over 300 bridges and major structures (of which 113 bridges are crossing water expanses – these range from 10 m to 1,045 m in length) spread within 3,835 km of all-weather highway and winter roads. The NWT also has four ferry and ice crossings. The DoT has provided the authors with a detailed list of all bridges (which contains the structure ID, location, asset name, geographical coordinates, number of spans, length, year constructed, materials used, and superstructure and substructure type and shape). Of this list, a sub-list of 17 multi span bridges was created in which the main bridges for which ice is an important consideration are identified.
The only exception to the CHBDC used in the NWT relates to the required vertical clearance. The NWT requires 1.5 m freeboard (as opposed to 1.0 m as per the CHBDC). This is to accommodate ice build-up (aufeis) conditions and water back-up at break-up which may cause drifting ice to pile up, in the case of bridges on tributaries near the
5
http://www.gfwadvertiser.ca/news/local/2015/6/2/tender-awarded-for-latest-bond-bridge-ph-4167610.html
23 Mackenzie River, for example. During break-up, the Mackenzie water levels may rise when there is an ice jam or if it is still frozen further north. This would cause the water to backflow into tributary rivers, and the combination of the tributary flow with the Mackenzie backflow could cause both high water and drifting ice to ride higher up the piers and shores. The DoT uses hydrological studies, field evidence and the additional 0.5 m freeboard to determine the minimum bridge soffit elevation.
Drifting ice and ice loading has not caused problems with any of the bridges currently in place in the NWT. There are, however, some bridge openings that experience aufeis (winter overflow/icing); ice plugs create an issue at freshet when the restricted opening resists spring melt run-off.
There are no piers instrumented for ice loads or bridges used to explicitly monitor ice conditions in the NWT.
The largest bridge in the NWT is the relatively recent Deh Cho Bridge, on the Mackenzie River (Figure 10). The bridge was built to eliminate lengthy and uncertain ferry disruptions during winter freeze-up and spring break-up. The bridge is 1,045 m long and crosses a 1,600 m span of the Mackenzie River on the Yellowknife Highway (kilometer 23 of Highway 3) near Fort Providence. There are two lanes, nine spans and eight piers in water. The longest span is 190 m long (central) and the other spans are 90 m, 112.5 m and 112.5 m (identical on each side). The bridge is exposed to fairly significant ice conditions during the winter. The piers are sloped at the waterline, promoting flexural failure of the ice and lower ice loads relative to crushing loads. Each pier consists of a lower solid concrete cone (reinforced with an outer steel shell protecting the concrete against ice actions) and an upper steel head. The steel head has a base, two inclined legs, and a tie-beam connecting the legs.
24
Figure 10. Deh Cho Bridge, crossing the Mackenzie River, in the NWT. Top) Structure drawing (source: Wikimedia6). Middle and bottom) Near and far range views of the
bridge (source: The Deh Cho Bridge Project website by NWT Transportation7)
3.2.13 Nunavut (NU)
The majority of bridges in Nunavut are within community boundaries and are considered municipal infrastructure. As a result, they are the responsibility of the Department of Community Government Services (CGS) (and not of the Department of Economic Development and Transportation). There are 26 communities in Nunavut (17 of which are above the Arctic Circle), and there is no road infrastructure connecting them. People rely on air transport for their essential needs.
There are only a handful of bridges in Nunavut and there is no official database for these bridges:
Iqaluit (across Apex Creek, between Iqaluit and Apex)
6https://en.wikipedia.org/wiki/Deh_Cho_Bridge#/media/File:Pont_de_Deh_Cho.png 7http://www.dehchobridge.info/photos.html
25 Pangnirtung, just outside Arctic Bay
in Rankin, just outside Cambridge Bay in Kugaaruk
in Coral Harbour
There are also a small number of bridges on privately-built roads, such as the one connecting Baker Lake and the Meadowbank Gold Project. All of these bridges are exposed to ice actions for a fair amount of the year.
Nunavut does not have any standards/codes to design bridges. If a bridge requires replacement, the Department of CGS would ask a consultant to design to industry standards or to those set out by AASHTO.
There were two historical bridges failures known to the official at the Department of CGS with which the NRC had discussions: the bridge at Kugaaruk (age-related – the bridge was replaced), and the bridge in Pangnirtung, which had a sudden failure caused by erosion. It is unknown what role ice played in these failures.
3.2.14 Ice impact on the Canadian bridge infrastructure and climate change
More than 22,000 bridges crossing water expanses have been identified across Canada as part of this study. This is a preliminary estimate, based on a semi-complete dataset, as described in this section. For most provinces and territories, ice interaction with bridges is a major concern and is explicitly considered in the design of bridges. Throughout the country, examples of historical events of ice-induced damage on a bridge or, in the worst cases, failure of the bridge due to ice, were identified.
When designing a bridge, most jurisdictions have specific requirements related to ice, so as to complement those specified in the design code they use. For most of them, a major concern is the required vertical clearance under high water levels induced from an ice jam. While ice loading on a pier is always a consideration while designing a bridge (as a pier has to be able to sustain the ice load and maintain an acceptable deflection), it is the secondary effects of the ice presence in a river that has had the most impact on Canadian bridges historically: ice jams inducing flooding and high water levels resulting in ice impacting the superstructure, or bridges being pushed off their abutments and/or being washed out. Over saline waters, such as is the case for the Confederation Bridge, the ice regime is different than in rivers and therefore the main concerns are of a different nature. For those, ice loads and ice jamming across the piers are more of a concern.
Climate change is affecting the ice regimes in rivers and estuaries in many different ways and the processes governing ice interactions with bridges are directly impacted by these changes. Important parameters such as discharge, ice thickness, and ice jam frequency and locations, all depend on climatic conditions (Beltaos et al., 2007). In New Brunswick, for example, it has been reported that warmer and shorter winters are resulting in earlier spring breakup, reduced snow pack due to more precipitation falling as rain and, as a result, more frequent mid-winter thaws that can enhance the severity of midwinter breakup and ice jamming (Beltaos et al., 2007).

![[DOC] Cours stratégies de groupes GPO dans Windows 2000](data:image/gif;base64,R0lGODlhAQABAIAAAP///wAAACH5BAEAAAAALAAAAAABAAEAAAICRAEAOw==)