Dust as a tipping element: The Bode´le´
Depression, Chad
Richard Washingtona,1, Christel Bouetb, Guy Cautenetb, Elisabeth Mackenziea, Ian Ashpolea, Sebastian Engelstaedtera, Gil Lizcanoa, Gideon M. Hendersonc, Kerstin Schepanskid, and Ina Tegend
aClimate Research Lab, Centre for the Environment, University of Oxford, South Parks Road, Oxford OX1 3QY, United Kingdom;bLaboratoire de
Me´te´orologie Physique, Unite´ Mixte de Recherche, Centre National de la Recherche Scientifique 6016, Universite´ Blaise Pascal, 63177 Aubie`re Cedex, France;
cDepartment of Earth Science, University of Oxford, Parks Road, Oxford OX1 3PR, United Kingdom; anddLeibniz Institute for Tropospheric Research, 04318
Leipzig, Germany
Edited by Hans Joachim Schellnhuber, Potsdam Institute for Climate Impact Research, Potsdam, Germany, and approved March 24, 2009 (received for review December 17, 2007)
Dust plays a vital role in climate and biophysical feedbacks in the Earth system. One source of dust, the Bode´le´ Depression in Chad, is estimated to produce about half the mineral aerosols emitted from the Sahara, which is the world’s largest source. By using a variety of new remote sensing data, regional modeling, trajectory models, chemical analyses of dust, and future climate simulations, we investigate the current and past sensitivity of the Bode´le´. We show that minor adjustments to small features of the atmospheric circulation, such as the Bode´le´ Low-Level Jet, could profoundly alter the behavior of this feature. Dust production during the mid-Holocene ceased completely from this key source region. Although subject to a great deal of uncertainty, some simulations of the 21st century indicate the potential for a substantial increase in dust production by the end of the century in comparison with current values.
mineral aerosol兩 regional climate model 兩 low-level jet
M
ineral dust, as one of the most abundant aerosol species in the atmosphere (1), plays an important role in determin-ing the heatdetermin-ing of the planet. Sdetermin-ingle scatterdetermin-ing albedo of dust largely controls the backscattering of solar radiation to space, but the inf luence of dust on the longwave-radiation budget is similar to greenhouse gases because of efficient absorption of the relatively large particle size characteristic of dust. The degree of absorption hinges mainly on the vertical profile of dust (2). As a result of these complexities, the sign and magnitude of the net radiative forcing of dust has the potential for high spatial and temporal variability (3). Local instantaneous direct radiative forcing effect, for example, has been measured in situ as 130 W䡠m⫺2 off the coast of West Africa (4), and a 50-W䡠m⫺2 longwave direct radiative dust effect over land areas of North Africa was measured for July 2003 (5).Dust as a Tipping Element
Dust has been implicated in the activation and early growth of cloud droplets (6), in convection over the Atlantic (7), and in the reduction of the burden of anthropogenic species at sub-m sizes, thereby limiting their residence time in the atmosphere (8). Dust interacts with a variety of large-scale circulation compo-nents, such as African easterly waves (9), with the potential to alter natural dust-source emissions through feedbacks. It has been argued that dust radiative forcing reduces the downward mixing of momentum within the planetary boundary layer and the surface-wind speed, thus reducing dust emission (10), a process which could decrease global dust load by 10 –20%. Mineral aerosol deposition affects global ecosystems and pro-cesses, such as the biogeochemical cycle of the oceans, which requires Fe supplied by dust (11). Trace elements derived from dust emissions from a single part of the Sahara (12), for example, have also been proposed to be important in the Amazon basin (13), and phosphorus from Asian dust is argued to be vital to the Hawaiian Islands (14).
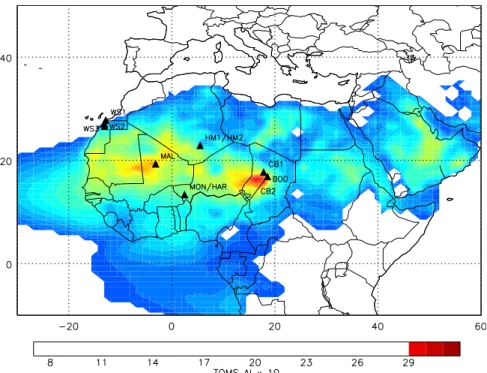
Recent satellite analyses have confirmed the importance of North African deserts in global dust production (15). Within this region, the Bode´le´ Depression in Chad stands out as a key emission source. Several factors earmark the Bode´le´ region as a potential tipping element, although the Bode´le´ has not, as yet, been independently considered a tipping element (16). First, the Bode´le´ may generate more than half the Sahara’s mineral aerosol output (17, 18) (Fig. 1) and the accompanying impact on the Earth system. Second, it is a small, unvegetated depression
(some 150 km ⫻ 150 km) lying only 200 km north of the
contemporary monsoon rainfall limit (roughly one grid box in most global climate models) in the Sahara desert. Minor mod-ifications to the global circulation could increase dust production from the Bode´le´ or else reduce it to near zero. There is evidence of such extreme variability during the Late Quaternary Period (19). During the Last Glacial Maximum, atmospheric dust concentration was as much as an order of magnitude more than present values (20). Observations suggest that annual mean African dust may have varied by a factor of 4 between 1960 and 2000 (21). With changes in aridity and circulation expected in forthcoming decades (22), it is likely that dust concentrations in the atmosphere will alter as well and that key dust sources like the Bode´le´ will play a central role in modulating this production. This paper outlines the nature of the Bode´le´ source and provides reasons for its prominence. It goes on to evaluate the controls on Bode´le´ dust emission and the sensitivity of these controls, in part through multiple years of integration from 2 regional climate models. By using a Lagrangian trajectory model, we provide the first climatology of transport from the basin and present a chemical analysis of dust samples from the Bode´le´ compared with another key Saharan dust hotspot in Mali. We go on to provide a perspective of the basin’s history during the Holocene before considering the possible behavior of the Bode´le´ in climate change simulations of the 21st century. We argue that the Bode´le´ is indeed capable of profound changes in future emissions. Although the full consequences of these change have not yet been quantified, the case exists for doing so. Anatomy of the Bode´le´ Depression
Many studies have pointed to the Bode´le´ Depression as one of the key dust sources in the world (17, 23–27). Individual dust plumes from this source are clearly evident in MODerate Resolution Imaging Spectroradiometer (MODIS) true color imagery (28), occur⬇100 times per year, average 370 km ⫻ 700 km in area, carry 700,000 tons of sediment, and are responsible
Author contributions: R.W., C.B., G.C., E.M., I.A., S.E., G.L., G.M.H., K.S., and I.T. performed research; and R.W., C.B., and G.C. wrote the paper.
The authors declare no conflict of interest. This article is a PNAS Direct Submission.
for up to 40% of the Aerosol Optical Thickness (AOT) over the equatorial Atlantic and Amazon basin (12).
Two key components are required for such extensive def la-tion, namely extensive, highly erodible sediments and a colocated erosive wind. The Bode´le´ Dust Experiment (BoDEx) (29, 30) confirmed that the MODIS dust plumes originate from a shallow basin of exposed diatomite sediment, much of which was depos-ited under paleolake Megachad some 7,000 years ago when it was the biggest lake on the planet (19). This silicious, low-density, and highly friable material covers⬇10,800 km2of the basin. The northeastern portion of the depression is being invaded by large barchans dunes (some more than 1 km from horn to horn) that are composed of silt-sized diatomite pellets. The northern part of the basin is underlain by diatomite slabs⬇1 m in diameter. Toward the central and southern parts of the basin, the diatomite is broken into pellets of a few cm or less in diameter.
The wind responsible for def lating the diatomite has been identified as the Bode´le´ low-level jet (LLJ) (26) which is part of the northeasterly Harmattan f low. It is accelerated between the topography of the Tibesti mountains and the Ennedi ridge to
reach a low-level wind speed maximum ⬇200 m above the
surface of the basin. The LLJ is absent in the time-mean f low at other longitudes across the Sahara. Regional modeling studies show that the presence of the topography accelerates the wind by⬇40% (31). Pilot balloon measurements during BoDEx point to a marked diurnal cycle in the wind speed such that the LLJ accelerates over a near frictionless inversion by night but is mixed down to the surface by extreme radiative heating through modification of eddy viscosity to produce a surface-wind-speed maximum by⬇1100 local time (32).
Controls on Dust Emission
One way of assessing the sensitivity of the Bode´le´ as a tipping element is to evaluate the controls on the variability of the erodibility and erosivity components that determine def lation. If it can be shown that Bode´le´ dust emission is subject to strong modulation on a variety of time scales that inf luence the overall output of dust, then insights into the thresholds which constrain
the system may be gained. These controls are discussed in this section on time scales ranging from the diurnal to the annual cycles and to the long-term behavior during the Holocene. Contemporary Controls
Dust emission from the Bode´le´ is strongly modulated on a diurnal cycle. Composites of surface-wind speed from both dusty and dust-free days measured during BoDEx featured a strong diurnal amplitude (0 – 6 m/s⫺1on dust-free days, 4 –13 m/s⫺1on dust-emission days) with an early-evening minimum near 2100 local time and a midmorning maximum near 1100 local time. Although MODIS satellites only pass twice daily and cannot therefore be used to determine the diurnal cycle of dust emission directly, analyses of imagery from this satellite have shown that distinct packages of dust plumes are traceable for several days downwind of the Bode´le´, indicating that large-scale emissions are strongly modulated by the diurnal cycle (28). Recently available data at 15 min time resolution derived from the geostationary Meteosat Second Generation satellite’s Spinning Enhanced Visible and Infrared Imager has been used to analyze Saharan dust (33). The spatial Dust Source Activation Fre-quency emerging from this work has been applied to the Bode´le´ Depression (Fig. 2) where activation was found to occur on 65% of all days. In all months, the diurnal peak in onset of emissions is very clearly between 0700 and 1000 local time, followed by the previous or subsequent 3-h period on a monthly dependent basis. Minimum dust emission occurs in the evening. This data, although only analyzed for 17 months, corroborates other sat-ellite and field data, enforcing the view that dust emissions are transport-limited by the pulsing of the surface wind. A key control of Bode´le´ dust output is therefore the behavior of the Bode´le´ LLJ, which ranges naturally within and beyond the threshold required for def lation.
On a day-to-day basis, the strength of the Bode´le´ LLJ is modulated by the ridging of the Libyan high-pressure system (LHPS) (26) which has the effect of raising surface winds above the threshold for def lation of ⬇10m/s⫺1 (34). The LHPS en-hances the pressure gradient, causing acceleration in the f low
Fig. 1. TOMS AI annual average 1979 –1992 for North Africa. Sample locations from Table 1 also shown. BOD, Bode´le´; CB1-2, Chad Basin; HAR, Harmattan; HM1-2, Hoggar Massif; MAL, Mali; MON, monsoon; WS1-3, Western Sahara.
ENVIRONMENTAL SCIENCES SUSTAINABILITY SCIENCE SPECIAL FEATURE
that typically lasts 1–3 days between the Tibesti and Ennedi topography. The f low is ageostrophic, possibly resulting from density currents consequent on large-scale evaporation at the leading edge of the ridging anticyclone (35). The association between the synoptic forcing of dust events and the role of the Bode´le´ LLJ has been verified here by running a regional model for all large-scale dust events (established from plumes def lating from the Bode´le´ in MODIS imagery) (32) from January to March between 2002 and 2005 by using the Fifth Generation National Center for Atmospheric Research/Penn State Regional Mesoscale Meteorological Model, Version 5 (MM5) previously set up for the Bode´le´ domain (31). Composites of these events for each of the months have been studied. In all cases, the Bode´le´ LLJ was enhanced in MM5 by 3 to 4 m/s⫺1above the daily mean (Fig. 3) and occurred in conjunction with a ridging anticyclone through Libya.
Satellite-derived dust-emission data [e.g., Total Ozone Map-ping Spectrometer (TOMS), AOT, MODIS] used to quantify the annual cycle in the Bode´le´ point to a minimum in Bode´le´ dust emissions from June to September and a maximum between December and March (32). An exception is the TOMS aerosol index (AI) data, which places the maximum during May. This exception may be the result of a bias inherent in the TOMS AI definition that makes the index sensitive to the altitude of the dust layer. Def lation is still active in May, but surface heating is near a peak during this month given the low cloudiness and the near-zenith position of the sun. The combination of intense convection and surface dust may loft dust to midlevels where the TOMS AI bias results in a peak in detection. In cooler months, when convection is less intense, the dust stays close to the surface and may consequently be underestimated by TOMS AI.
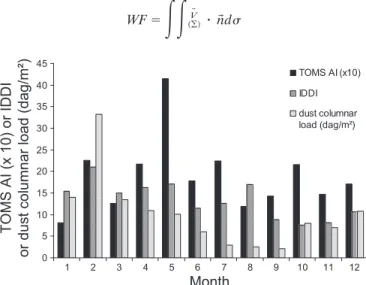
Dust emissions from the Regional Atmospheric Modeling System (RAMS) (36) coupled online with the Dust Production Model (37– 40) have been calculated for 2001 by using a hori-zontal resolution of 50 km both in x and y directions over 0 °E to 27 °E and 12 °N to 27 °N with 30 vertical levels from ground to 22 km, including 12 levels from surface to 1.2 km. The simulation emulates the annual cycle of dust derived from the Infrared Difference Dust Index (IDDI) (41) satellite product
reasonably well, with a maximum in dust concentration in winter and a minimum in summer (Fig. 4). Moreover, the phase of the annual cycle of observed surface-wind speed (at Faya-Largeau, 18 °N, 19 °E) is fairly well reproduced by RAMS, whereas it is quasiinexistent in the reanalysis data (Fig. 5). This result again reinforces the important control imposed by the Bode´le´ LLJ.
To understand the modulation of the annual cycle better, the surface-wind f lux WF, taken as the airf low entering the defile between the Tibesti and the Ennedi mountains across a control surface oriented northwest to southeast, with a horizontal width of 250 km and a height of 50 m, has been computed from the RAMS regional model for 2001 as follows:
WF⫽
冕冕
共¥兲Vជ 䡠 nជd Fig. 2. Diurnal [in 3-h categories 00 – 03 universal time coordinated (UTC),etc.] and annual cycles of dust-source activation frequency over the Bode´le´, March 2006 to July 2007.
Fig. 3. Wind-speed anomalies (latitude vs. height) in m/s from MM5 regional model integrations for major Bode´le´ dust plume events in February 2004.
0 5 10 15 20 25 30 35 40 45 1 2 3 4 5 6 7 8 9 10 11 12 TOMS AI (x10) IDDI dust columnar load (dag/m²) Month TOMS AI (x 10) or IDDI or dust column ar load (d ag/m² )
Fig. 4. Annual cycle of Bode´le´ dust as estimated from TOMS AI, IDDI, and the RAMS dust columnar loading.
where Vជ is the wind vector and nជ is the unit vector normal to surface d.
A negative WF value (wind direction from northeast to southwest, as is the case in winter), is associated with high surface-wind velocity over the Bode´le´ dust-source area, and therefore intense dust emissions. On the other hand, when wind direction is reversed (positive WF) acceleration through the venturi no longer exists, and surface-wind velocity rarely exceeds the wind threshold necessary for dust emission (Fig. 6). The nondimensional Froude number representing f low’s ability to overpass an obstacle, Fr, has also been computed from the RAMS data for negative WF cases as follows:
Fr⫽ U
Nh
where U is the mean wind velocity and N is the Bru¨nt-Va¨isa¨la¨ frequency. In the present study, h is the order of magnitude of the Tibesti Mountain. Only the relative variations of Fr (because
the barrier is finite and the absolute variability of Fr is conse-quently not applicable) with wind speeds are considered (Fig. 7). When the Fr value is lower, airf low is forced into the venturi and the f low accelerates.
It is clear from the analysis of contemporary controls on Bode´le´ dust emission on time scales ranging from the diurnal to the annual that erosivity in the form of the Bode´le´ LLJ currently modulates dust emission. Whether or not erodibility factors also exert an inf luence needs to be established by considering longer time scales.
Holocene
Considerable evidence suggests that paleolake Megachad was the world’s largest lake sometime before 7,000 years ago (19, 42, 43). Intercalation of diatomites and dune sands in the north-eastern Bode´le´ show that this lake has filled and emptied ⱖ3 times during the last 3,000 to 4,000 years. Diatomite was deposited when the lake was filled; in dry periods, quartz sand dunes driven in by the northeasterly Bode´le´ LLJ invaded the lakebed as they are again doing at present (19, 31). Erodibility places key limitations on the long-term behavior of the Bode´le´. Reversion to wetter conditions indicates a shutdown in dust production from this key source, accompanied by lower atmo-spheric optical depths across West Africa and the Atlantic.
It has been argued that the cycle of wetting and drying in the Bode´le´ forms an important component in the operation of this tipping element (31) beyond simply a relaxation in def lation in wetter times followed by def lation in drier times. Climate model simulations of the Last Glacial Maximum show an even stronger Bode´le´ LLJ compared with that of the present, and dated evidence points to the conditions under which def lation would have been capable of excavating the depression which was later partly filled by paleolake Megachad (31). Importantly, the lake was subsequently populated by the diatomite material which is currently being def lated. It follows that a combination of atmo-spheric, hydrological, and geomorphological processes in the past have been responsible for maintaining and intensifying what is now the greatest dust source on Earth, and this process necessarily entails periods during which no def lation occurs. In this sense, the Bode´le´ has remarkable capacity as a potential tipping element. Periods of low def lation are simply important opportunities for recharge of the erodible sediment.
Jan Feb Mar Apr May Jun Jul Aug Sep Oct Nov Dec
Monthl y ave raged surface w ind v e locity (m/s ) RAMS ECMWF Obs. 0 5 10 15
Fig. 5. Monthly mean values of surface-wind velocity as measured at Faya (18 °N; 19 °E) meteorological station (black stars) and as modeled by the European Centre for Medium-Range Weather Forecasts (ECMWF) global model (green triangles) and the mesoscale RAMS model (red diamonds) for 2001. Vertical bars represent the standard deviation.
Wind flux < 0
Dust mass flux
(kg/m
2/s
)
Surface wind flux (m3/s)
-2E11 0 2E11 4E11
-6E11 Wind flux > 0 0 1x10⁻⁶ 8x10⁻⁷ 6x10⁻⁷ 4x10⁻⁷ 2x10⁻⁷
Fig. 6. Modeled (RAMS) dust mass flux (in kg/m⫺2/s⫺1) as a function of
modeled surface-wind flux (m3/s⫺1) for 2001.
Jan Feb Mar Apr May Jun Jul Aug Sep Oct Nov Dec Monthly averaged surface wind velocity (m/s) at the Bodélé Froude number x 50 Wi nd vel o ci ty (m /s ) or Froude n umbe r (x 50 ) 0 2 4 6 8 10
Fig. 7. Monthly mean values of the modeled (RAMS) surface-wind velocities
(in m/s) at the Bode´le´ (solid line) and Froude number (⫻50; stars) for 2001.
ENVIRONMENTAL SCIENCES SUSTAINABILITY SCIENCE SPECIAL FEATURE
Contemporary Dust Chemistry and Transport
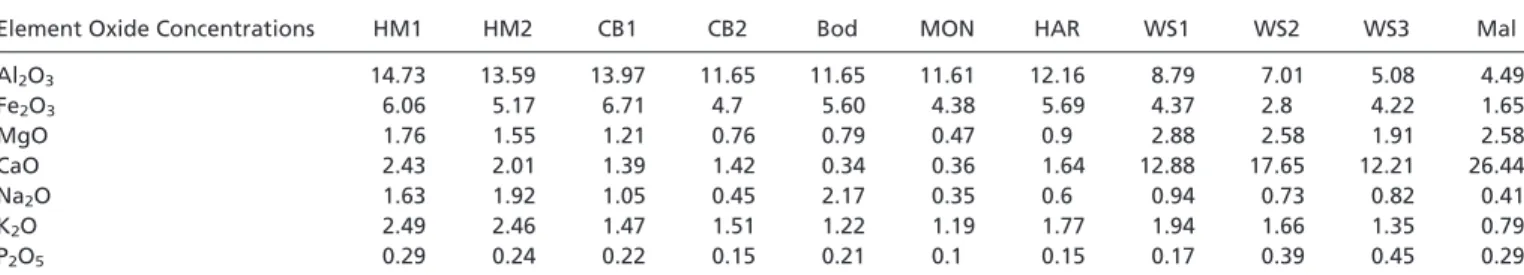
A vital component of diagnosing the role of the Bode´le´ in the Earth system rests on its contribution to biogeochemical cycling. Although measurements of aerosols from airborne work (e.g., ref. 44) and land-based and shipboard filter systems (e.g., ref. 45) all point to the spatial variability of aerosol chemistry, these techniques sample a mixture of aerosols from different regions. The chemistry of the individual source regions has not been extensively investigated. An exception is a geochemical study of 9 source samples, including 2 samples from the Bode´le´ Depres-sion (Table 1) (46). We augment this data with major element compositions for 2 new samples— one from the Bode´le´ Depres-sion, and, for comparison, one from the unsampled and ex-tremely remote Taoudeni Basin that spans much of Northern Mali. The Taoudeni Basin represents a distinct geological en-vironment from other North African dust sources and consists of an extensive Lower Paleozoic sedimentary sequence that includes frequent carbonate units (47). The sample derives from a hotspot of dust in West Africa (near 19.5 °N, 3.125 °E) that represents the second most significant dust source in the Sahara (48).
The Bode´le´ source region chemistry ref lects weathered aver-age continental crust. The major-element chemistry of these 3 samples (Table 1) is similar despite differing local settings of collection, probably as a result of mixing of source material on the land surface. Al2O3and Fe2O3contents are typical for upper continental crust with Fe/Al ratio of 0.40 – 0.48. Content of more soluble elements (e.g., Ca, Mg, Na) are lower than in average continental crust, probably because of the absence of sedimen-tary carbonates in the region. The Bode´le´ sample chemistry is in
marked contrast to that the Taoudeni Basin. That sample has Al2O3 and Fe2O3 contents about one-third those of average continental crust but with significantly higher CaO concentra-tion, ref lecting frequent carbonate rocks in this area.
We have computed the transport pathways from the Bode´le´ Depression by using a Lagrangian advection model driven by 3-dimensional ERA-40 reanalysis winds. Twenty-five forward trajectories were released every 6 h from a region overlying the depression (17 °N, 18 °E) for the period from January 1970 to December 1999, and the parcel positions were noted for each 6-h period for 4 days after release. The median path of the trajec-tories (Fig. 8) in the peak dust-production months reaches the Atlantic in just under 5 days. During the summer, when dust production is much lower, the transport pathway is over West Africa in the core of the African Easterly Jet. The sediment that is def lated in this season then augments the material derived from the key summertime sources over Mali and Mauritania.
The chemistry of the mineral dusts from these source regions has a significant impact on biogeochemical cycles in the Atlantic Ocean (49). Fe is an essential nutrient for ocean ecosystems, and its supply limits the productivity of large areas of the modern ocean (11). Supply of new Fe to surface waters of the open Atlantic is thought to be dominated by dissolution of mineral aerosols (11), as is clearly seen by using dust-sourced Al as a tracer of Fe supply even after rapid biological consumption of Fe (50). Variation in the supply of dust from North African sources therefore has potential to cause significant changes in the size and function of ocean ecosystems across much of the Atlantic basin. The extent of present-day primary Fe limitation in the Table 1. Key major element oxide concentrations for new Bodélé and Mali samples in comparison with other Saharan dust samples
Element Oxide Concentrations HM1 HM2 CB1 CB2 Bod MON HAR WS1 WS2 WS3 Mal Al2O3 14.73 13.59 13.97 11.65 11.65 11.61 12.16 8.79 7.01 5.08 4.49 Fe2O3 6.06 5.17 6.71 4.7 5.60 4.38 5.69 4.37 2.8 4.22 1.65 MgO 1.76 1.55 1.21 0.76 0.79 0.47 0.9 2.88 2.58 1.91 2.58 CaO 2.43 2.01 1.39 1.42 0.34 0.36 1.64 12.88 17.65 12.21 26.44 Na2O 1.63 1.92 1.05 0.45 2.17 0.35 0.6 0.94 0.73 0.82 0.41 K2O 2.49 2.46 1.47 1.51 1.22 1.19 1.77 1.94 1.66 1.35 0.79 P2O5 0.29 0.24 0.22 0.15 0.21 0.1 0.15 0.17 0.39 0.45 0.29
Units are wt % oxide. Sample locations are shown in Figure 1. HM1-2, Hoggar Massif; CB1-2, Chad Basin; BOD, Bode´le´; MON, monsoon; HAR, Harmattan; WS1-3, Western Sahara; MAL, Mali.
Atlantic remains a matter of debate (51), suggesting that the system is poised relatively close to Fe limitation and may be sensitive to change of Fe inputs, particularly to decreases in supply. Fe supply is important even in regions directly under the Saharan dust plume (shown in the trajectory analysis to be augmented by Bode´le´ dust) where, although primary Fe limita-tion is unlikely, the supply of Fe exerts a secondary control on ocean productivity because it is required for the fixation of nitrogen, the main limiting nutrient in these areas (52). This secondary role suggests that even an increase of dust input to further reduce primary Fe limitation may have important im-plication for Atlantic ecosystems and carbon cycling.
North African mineral dust also exerts considerable inf luence on tropical landmasses east of the Atlantic. Saharan dust is the primary source of mineral material in soils in many areas of the Caribbean, and impacts corals reefs in the area through both particulate and chemical supply (53). The Bode´le´ Depression is particularly important in the supply of mineral dust to the Amazon region during winter when the Bode´le´ source is at its strongest (27). Although the median trajectories fail to reach the Amazon within 10 days, some 10% of parcel trajectories in the December to May season do. This vector may be a significant and time-varying source of nutrients to the Amazon rainforest. There is clear evidence that the supply of mineral dust to the tropical western Atlantic region has been controlled by environmental conditions in the Saharan region during the 20th century (21)
with increases in dust supply linked to increased aridity since 1970. Such changes in dust supply have the potential to signif-icantly alter biogeochemical cycles, to impact Atlantic open-ocean ecosystems, Caribbean coral reefs, and the Amazon rainforest. It is clear from the analysis of Holocene conditions in the Bode´le´ that for extended periods this supply of nutrients was nonexistent. Quantification to determine whether or not the dust f lux constitutes a true tipping element is yet to be established, but the case exists for assessing its role.
Bode´le´ Future
The Bode´le´ Depression has undergone profound changes during the Holocene. Its current dust output is essentially transport-limited, but with expected changes in future atmospheric circu-lation in response to increasing greenhouse gas concentrations, changes to def lation in the Bode´le´ may impose critical changes on the behavior of the Earth system in response to the role that dust plays in the biosphere and the sheer quantity emitted from this key region.
An extensive set of model integrations available from the Program for Climate Model Diagnosis and Intercomparison for the Fourth Assessment Report of the Intergovernmental Panel on Climate Change (IPCC AR4) have been analyzed over the 21st century for West Africa (54, 55) to assess the likely future climate in this key region. The models reported in the IPCC AR4 disagree about future rainfall in the Sahel, with some suggesting
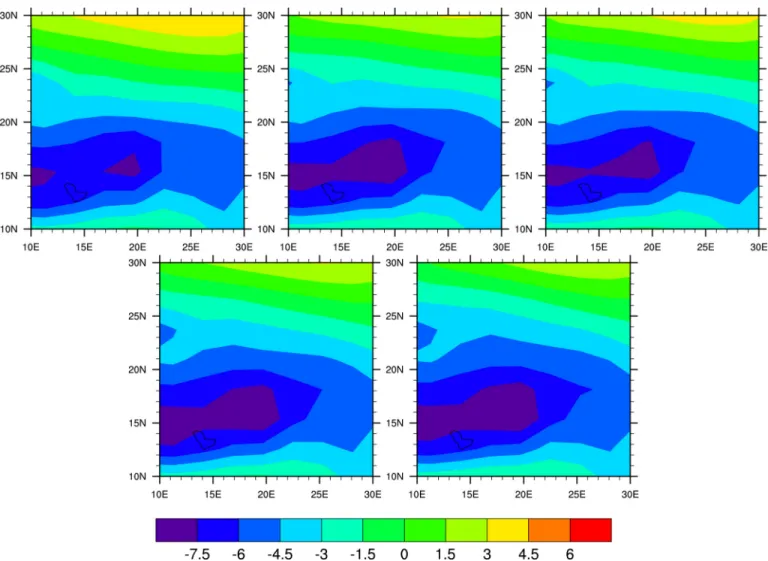
Fig. 9. Zonal 925-hectopascal (hPa) winds in m/s from the MRI model for January to March over the Bode´le´ for 1991–2000 (Upper Left), 2046 –2055 (Upper Middle), 2056 –2065 (Upper Right), 2081–2090 (Lower Left), 2091–2100 (Lower Right).
ENVIRONMENTAL SCIENCES SUSTAINABILITY SCIENCE SPECIAL FEATURE
wetter future conditions and some drier (54). The coarse reso-lution of global models, together with regional uncertainties in precipitation, make it difficult to assess the probability of def lation becoming supply-limited consequent on wetting of the Bode´le´ and/or increased vegetation cover over the basin. Clearly this cannot be ruled out, and, if it were to occur, the Bode´le´ may enter one of the replenishment phases. Based on a sample of 10 leading IPCC AR4 models (CNRM, CSIRO, GISS, MIUB, HadGEM, CCCMA, GFDL, ECHAM5, MRI, HadCM3), 4 models show that, in comparison with 1971–2000, more rainfall over the Bode´le´ is likely for the last decade of the 21st century, whereas 6 show that drier conditions are likely. The ensemble mean is for wetter conditions. The wettest model (⬎70–100 mm by 2100) shows an increase in rainfall in the early decades of the 21st century but also shows decades that are drier than present. Given that the ensemble mean temperature is projected to rise by 4 –5 °C by 2100 in this region, evaporation will rise consid-erably too. From this perspective, the model projections suggest that rainfall increases would not be sufficient to support suffi-cient vegetation to stop dust emission. With a larger increase in rainfall (approximately⬎300–400 mm), dust production from the world’s premier aerosol source would be reduced consider-ably and could plausibly cease altogether, with concomitant consequences for the Earth system in terms of nutrient supply to both terrestrial and oceanic ecosystems and the direct and indirect impact on the radiative balance.
Of the 10 models considered, 8 show an increase in mean annual surface-wind speed by the last decade of the 21st century compared with 1971–2000, and all 10 show an increase from January to March (JFM) (max, ⫹0.8m/s⫺1; min, ⫹0.2 m/s⫺1). Choosing only those models with a realistic simulation of the current climate, the selection is limited to 3 models, 2 of which, Meteorological Research Institute (MRI) and Geophysical Fluid Dynamics Laboratory (GFDL), show dry conditions over the Sahel during the 21st century (55). We analyze the daily MRI circulation fields in detail for the Special Report on Emissions Scenarios (SRES A2) scenario over the Bode´le´, as regional drying in this model denotes that surface winds will remain the primary inf luence on dust emissions from this arid region. MRI is also suitable for this study because it demonstrates good skill in reproducing the Bode´le´ LLJ characteristics over the focus region of Northern Chad.
Near-surface zonal winds over the Bode´le´ Depression in MRI enhance considerably during the course of the 21st century based on decadal means. In the decade 1991–2000, easterly winds exhibit an average peak speed of 9 m/s⫺1within the core of the jet, extending from 15–17 °N, 17–20 °E and fragmenting over Lake Chad. By 2091–2100 the spatial coverage of the LLJ has increased, extending from 3–21 °E across the region with a clear focus of expansion over the Bode´le´ (Fig. 9). Decadal variability in the wind strength is evident (e.g., diminished winds from 2056 –2065 relative to the previous decade), but this is to be expected given the natural decadal and multidecadal f luctua-tions inherent to the climate of North Africa.
Because dust mobilization arises from synoptic-scale events in the Bode´le´, the extremes of daily wind-speed distribution and their frequency of occurrence in each month are crucial com-ponents in modeling dust output. Although the shape of wind-speed distribution remains relatively constant through the de-cades, peaking between 11–13 m/s⫺1, the frequency of winds stronger than 10 m/s⫺1(a rough threshold for def lation in the basin) is markedly greater in the latter half of the 21st century (Fig. 10). The percentage of JFM days with winds exceeding 11 m/s⫺1increases from 45% (1991–2000) to 49% (mid-21st cen-tury), exceeding 56% by the end of the century. The Bode´le´ winds show a doubling in the number of February days with wind speeds exceeding 11m/s⫺1by the end of the century (all increases at or better than P⫽ 0.05%).
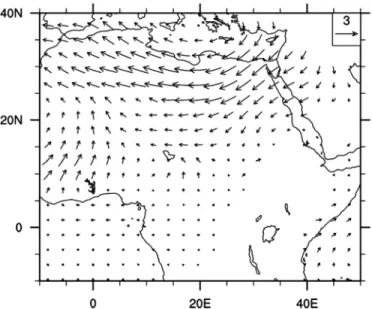
Bode´le´ LLJ strength correlates with shifts in the pressure gradient driving the northeasterlies, originating from a ridging of the LHPS (26). An increased strength of this LHPS is recognized in the JFM vector wind differences between the decades 1991– 2000 and 2091–2100, which exhibit a strengthening of northeast-erlies driving over the Libya–Chad border across the leading edge of the depression (Fig. 11). Almost identical results emerge from the Model for Interdisciplinary Research on Climate (MIROC) model for the same sampling base. Taken together, it is clear that large-scale adjustments to the general circulation are capable of increasing Bode´le´ winds in these models when forced with the A2 SRES scenario. Given the cubic sensitivity of dust mobilization to wind speed, these results point to the possibility of a substantial increase in dust output from the world’s largest mineral aerosol source toward the end of the 21st century. Summary
Several factors distinguish the Bode´le´ as a potential tipping element. It is the largest single source of mineral dust on the
50 60 70 0 10 20 30 40 50 1991-2000 2091-2100 0 1 2 3 4 5 6 7 8 9 10 11 12 13 14 15 16 windspeed m/s
Fig. 10. Histogram (frequency of occurrence on vertical axis vs. wind speed on horizontal axis) of JFM Bode´le´ 925-hPa winds in m/s for 1991–2000 and 2091–2100 from the MRI model.
Fig. 11. JFM Bode´le´ 925-hPa vector wind differences for 1991–2000 and 2091–2100 from the MRI model. Vector shows 3 m/s.
planet, producing about half of the Sahara’s mineral aerosol loadings. Mineral dust plays a key role in modifying climate through interaction with cloud physics and radiative heating. It is also involved in numerous biophysical feedbacks both in the oceans and on land. The Bode´le´ is, nevertheless, a very small region, and the controls on def lation are sensitive to changes in both erosivity and erodibility. Def lation is currently transport-limited and is extremely sensitive to a small-scale atmospheric feature in the form of the Bode´le´ LLJ. The critical parameters controlling large-scale def lation are known. Modulation of the surface-wind strength in response to the jet characteristics currently exerts a profound control on the output from the depression. Modulation of the jet on diurnal to annual cycles provides a clear demonstration of this sensitivity. On longer time scales, adjustments to the global circulation over the last 7,000 years have, during wetter times, reduced def lation from the
depression to zero. But during these times, the material which is currently being def lated is replenished. The Bode´le´ may revert to such a state toward the end of the 21st century, and the transition times may be very short—as little as one season. On the other hand, some climate model simulations suggest that on these time scales the dust output from the basin may increase substantially. The full impacts of Bode´le´ dust on the Earth system are as yet unknown. The Bode´le´, at this stage, qualifies as a potential tipping element until more work can be done to quantify the radiative impacts and biogeochemical consequences of mineral aerosols.
ACKNOWLEDGMENTS. We thank Chris Scott (www.sahara-overland.com) for
collecting the sediment sample in a remote part of Mali. RAMS modeling was supported by the national program Chimie Atmosphe´rique, a part of the Les Enveloppes Fluides et l’Environnement national program.
1. Penner JE, et al. (2001) Climate Change 2001: The Scientific Basis, eds Houghton J, et al. (Cambridge Univ Press, Cambridge, UK).
2. Tanre D, et al. (2003) Measurement and modeling of the Saharan dust radiative impact: Overview of the Saharan Dust Experiment (SHADE). J Geophys Res, 10.1029/ 2002JD003273.
3. Miller RL, Tegen I (1998) Climate response to soil dust aerosols. J Clim 11:3247–3267. 4. Haywood J, et al. (2003) Radiative properties and direct radiative effect of Saharan dust measured by the C-130 aircraft during SHADE: 1. Solar spectrum. J Geophys Res 108:8577.
5. Haywood JM, et al. (2005) Can desert dust explain the outgoing longwave radiation anomaly over the Sahara during July 2003? J Geophys Res, 10.1029/2004JD005232. 6. McFiggans G, et al. (2006) The effect of physical and chemical aerosol properties on
warm cloud droplet activation. Atmos Chem Phys 6:2593–2649.
7. Koren I, Kaufman YJ, Rosenfeld D, Remer LA, Rudich Y (2005) Aerosol invigoration and restructuring of Atlantic convective clouds. Geophys Res Lett, 10.1029/2005GL023187. 8. Bauer SE, Koch D (2005) Impact of heterogeneous sulfate formation at mineral dust surfaces on aerosol loads and radiative forcing in the Goddard Institute for Space Studies general circulation model. J Geophys Res 110:D17202.
9. Jones C, Mahowald N, Luo C (2004) Observational evidence of African desert dust intensification of easterly waves. Geophys Res Lett 31:L17208.
10. Miller RL, Perlwitz J, Tegen I (2004) Feedback upon dust emission by dust radiative forcing through the planetary boundary layer. J Geophys Res 109:D24209. 11. Jickells TD, et al. (2005) Global iron connections between desert dust, ocean
biogeo-chemistry, and climate. Science 308:67–71.
12. Koren I, et al. (2006) The Bode´le´ Depression: A single spot in the Sahara that provides most of the mineral dust to the Amazon forest. Environ Res Lett 1:014005. 13. Okin GS, Mahowald N, Chadwick OA, Artaxo P (2004) Impact of desert dust on the
biogeochemistry of phosphorus in terrestrial ecosystems. Global Biogeochem Cycles 18:GB2005.
14. Chadwick OA, Derry LA, Vitousek PM, Huebert BJ, Hedin LO (1999) Changing sources of nutrient during four million years of ecosystem development. Nature 397:491– 487. 15. Prospero JM, Ginoux P, Torres O, Nicholson SE, Gill TE (2002) Environmental charac-terization of global sources of atmospheric soil dust identified with the Nimbus 7 Total Ozone Mapping Spectrometer (TOMS) absorbing aerosol product. Rev Geophys 40:1002.
16. Lenton TM, et al. (2008) Tipping elements in the Earth’s climate system. Proc Natl Acad
Sci USA 105:1786 –1793.
17. Washington R, Todd MC, Middleton N, Goudie AS (2003) Dust-storm source areas determined by the Total Ozone Monitoring Spectrometer and surface observations.
Ann Assoc Am Geogr 93:297–313.
18. Goudie AS, Middleton NJ (2001) Saharan dust storms: Nature and consequences.
Earth-Sci Rev 56:179 –204.
19. Drake N, Bristow C (2006) Shorelines in the Sahara: Geomorphological evidence for an enhanced monsoon from paleolake Megachad. Holocene 16:901–911.
20. Harrison SP, Kohfeld KE, Roelandt C, Claquin T (2001) The role of dust in climate changes today, at the last glacial maximum and in the future. Earth-Sci Rev 54:43– 80. 21. Prospero JM, Lamb PJ (2003) African droughts and dust transport to the Caribbean:
Climate change implications. Science 302:1024 –1027.
22. Meehl GA, et al. (2007) in Climate Change 2007: The Physical Science Basis, eds Solomon S, et al. (Cambridge Univ Press, Cambridge, UK).
23. Herman JR, et al. (1997) Global distribution of UV-absorbing aerosols from Nimbus7/ TOMS data. J Geophys Res 102:16911–16922.
24. Brooks N, Legrand M (2000) Dust variability over Northern Africa and rainfall in the Sahel. Linking Climate Change to Land Surface Change, eds McLaren S, Kniveton D (Kluwer Academic Publishers, Dordrecht), pp 1–26.
25. Middleton NJ, Goudie AS (2001) Saharan dust: Sources and trajectories. Trans Inst
British Geographers 26:165–181.
26. Washington R, Todd MC (2005) Atmospheric controls on mineral dust emission from the Bode´le´ Depression, Chad: The role of the Low Level Jet. Geophys Res Lett 32:L17701.
27. Washington RM, Todd C, Middleton N, Goudie AS (2003) Dust-storm source areas determined by the total ozone monitoring spectrometer and surface observations.
Ann Assoc Am Geogr 93:297–313.
28. Koren I, Kaufman YJ (2004) Direct wind measurements of Saharan dust events from Terra and Aqua satellites. Geophys Res Lett 31:L06122.
29. Tegen I, et al. (2006) Modelling soil dust aerosol in the Bode´le´ depression during the BoDEx campaign. Atmos Chem Phys 6:4345– 4359.
30. Giles J (2005) The dustiest place on Earth. Nature 434:816 – 819.
31. Washington R, et al. (2006) Links between topography, wind, deflation, lakes and dust: The case of the Bode´le´ Depression, Chad. Geophys Res Lett 33:L09401.
32. Washington R, Todd MC, Engelstaedter S, M’Bainayel S, Mitchell F (2006) Dust and the low-level circulation over the Bode´le´ Depression, Chad: Observations from BoDEx 2005. J Geophys Res 111:D03201.
33. Schepanski K, Tegen I, Laurent B, Heinold B, Macke (2007) A new Saharan dust source activation frequency map derived from MSG-SEVIRI IR-channels. Geophys Res Lett 34:L18803.
34. Todd MC, et al. (2007) Mineral dust emission from the Bode´le´ Depression, northern Chad, during BoDEx 2005. J Geophys Res 112:D06207.
35. Knippertz P, Fink AH (2006) Synoptic and dynamic aspects of an extreme springtime Saharan dust outbreak. Q J R Meteorol Soc 132:1153–1177.
36. Cotton WR, et al. (2003) RAMS 2001: Current status and future directions. Meteorol
Atmos Phys 82:5–29.
37. Cautenet G, et al. (2000) Modelling a Saharan dust event. Meteorol Z 9:221–230. 38. Bouet C, et al. (2007) Mesoscale modeling of aeolian dust emission during the BoDEx
2005 experiment. Geophys Res Lett 34:L07812.
39. Marticorena B, Bergametti G (1995) Modeling the atmospheric dust cycle 1. Design of a soil-derived dust emission scheme. J Geophys Res 100:16415–16430.
40. Marticorena B, et al. (1997) Modeling the atmospheric dust cycle 2. Simulations of Saharan dust sources. J Geophys Res 102:4287– 4404.
41. Legrand M, Plana-Fattori A, N⬘Doume C (2001) Satellite detection of dust using the IR imagery of Meteosat 1. Infrared Difference Dust Index. J Geophys Res 106:18251– 18274.
42. Servant M, Servant S (1983) Paleolimnology of an upper quaternary endorheic lake in Chad basin. Monographiae Biologicae 53:11–26.
43. Schuster M, et al. (2003) Coastal conglomerates around Hadjer el Khamis inselbergs (western Chad, central Africa): New evidence for Lake Mega-Chad episodes. Earth Surf
Proc Land 28:1059 –1069.
44. Formenti P, Elbert W, Maenhaut W, Haywood J, Andreae MO (2003) Chemical com-position of mineral dust aerosol during the Saharan Dust Experiment (SHADE) airborne campaign in the Cape Verde region, September 2000. J Geophys Res 108:8576. 45. Chiapello I, et al. (1997) Origins of African dust transported over the northeastern
tropical Atlantic. J Geophys Res 102:13701–13709.
46. Moreno T, et al. (2006) Geochemical variations in aeolian mineral particles from the Sahara-Sahel dust corridor. Chemosphere 65:261–270.
47. Schluter T (2006). Geological Atlas of Africa, (Springer, Berlin), pp 152–154. 48. Engelstaedter S, Washington R (2007) Atmospheric controls on the annual cycle of
North African dust. J Geophys Res 112:D03103.
49. Martin JH, Fitzwater SE (1988) Iron deficiency limits phytoplankton growth in the north-east Pacific subarctic. Nature 331:341–343.
50. Measures CI, Landing WM, Brown MT, Buck CS (2008) High-resolution AL and Fe data from the Atlantic Ocean CLIVAR-CO2 repeat hydrography A16N transect: Extensive linkages between atmospheric dust and upper ocean geochemistry. Global
Biogeo-chem Cycles 22:GB1005.
51. Blain S, et al. (2004) Availability of iron and major nutrients for phytoplankton in the neartheast Atlantic Ocean, Limmol. Oceanography 49:2095–2104.
52. Mills MM, Ridame C, Davey M, LaRoche J, Geider RJ (2004) Iron and phosphorus co-limit nitrogen fixation in the eastern tropical North Atlantic. Nature 429:292–294. 53. Garrison VH, et al. (2003) African and Asian dust: From desert soils to coral reefs.
Bioscience 53:469 – 480.
54. Hoerling M, Hurrell J, Eischeid J, Phillips A (2006) Detection and attribution of twen-tieth-century northern and southern African rainfall change. J Clim 19:3989 – 4008. 55. Cook KH, Vizy EK (2006) Coupled model simulations of the West African Monsoon
system: Twentieth- and twenty-first century simulations. J Clim 19:3681–3703.
ENVIRONMENTAL SCIENCES SUSTAINABILITY SCIENCE SPECIAL FEATURE