HAL Id: hal-01608379
https://hal.archives-ouvertes.fr/hal-01608379
Submitted on 25 May 2020
HAL is a multi-disciplinary open access archive for the deposit and dissemination of sci-entific research documents, whether they are pub-lished or not. The documents may come from teaching and research institutions in France or abroad, or from public or private research centers.
L’archive ouverte pluridisciplinaire HAL, est destinée au dépôt et à la diffusion de documents scientifiques de niveau recherche, publiés ou non, émanant des établissements d’enseignement et de recherche français ou étrangers, des laboratoires publics ou privés.
variations in sorghum
Vincent Ranwez, Audrey Serra, David Pot, Nathalie Chantret
To cite this version:
Vincent Ranwez, Audrey Serra, David Pot, Nathalie Chantret. Domestication reduces alternative splicing expression variations in sorghum. PLoS ONE, Public Library of Science, 2017, 12 (9), pp.1-20. �10.1371/journal.pone.0183454�. �hal-01608379�
Domestication reduces alternative splicing
expression variations in sorghum
Vincent Ranwez1, Audrey Serra1, David Pot2, Nathalie Chantret3
*
1 Montpellier SupAgro, UMR AGAP, Montpellier, France, 2 CIRAD, UMR AGAP, Montpellier, France, 3 INRA, UMR AGAP, Montpellier, France
Abstract
Domestication is known to strongly reduce genomic diversity through population bottle-necks. The resulting loss of polymorphism has been thoroughly documented in numerous cultivated species. Here we investigate the impact of domestication on the diversity of alter-native transcript expressions using RNAseq data obtained on cultivated and wild sorghum accessions (ten accessions for each pool). In that aim, we focus on genes expressing two isoforms in sorghum and estimate the ratio between expression levels of those isoforms in each accession. Noticeably, for a given gene, one isoform can either be overexpressed or underexpressed in some wild accessions, whereas in the cultivated accessions, the balance between the two isoforms of the same gene appears to be much more homogenous. Indeed, we observe in sorghum significantly more variation in isoform expression balance among wild accessions than among domesticated accessions. The possibility exists that the loss of nucleotide diversity due to domestication could affect regulatory elements, con-trolling transcription or degradation of these isoforms. Impact on the isoform expression bal-ance is discussed. As far as we know, this is the first time that the impact of domestication on transcript isoform balance has been studied at the genomic scale. This could pave the way towards the identification of key domestication genes with finely tuned isoform expres-sions in domesticated accesexpres-sions while being highly variable in their wild relatives.
Introduction
Alternative splicing (AS) is the mechanism by which two or more processed mRNA isoforms result from the maturation of the same primary transcribed precursor mRNA molecule (pre-mRNA) [1]. One of the main steps of the pre-mRNA maturation is the splicing process, during which introns are removed from the pre-mRNA molecule, orchestrated by a whole array of
trans-acting regulator proteins as well as cis-acting elements within the pre-mRNA itself.
Occurring in all eukaryotes, AS has been extensively described and studied in humans [2] and other animals [3]. Through increasing diversity and complexity of transcriptomes, AS has two major outcomes: proteome diversification and regulation of gene expression. AS was suggested to be one of the possible origins of the large phenotypic differences among species which oth-erwise share a similar repertoire of protein-coding genes, as vertebrates do, for example [3].
a1111111111 a1111111111 a1111111111 a1111111111 a1111111111 OPEN ACCESS
Citation: Ranwez V, Serra A, Pot D, Chantret N
(2017) Domestication reduces alternative splicing expression variations in sorghum. PLoS ONE 12 (9): e0183454.https://doi.org/10.1371/journal. pone.0183454
Editor: Manoj Prasad, National Institute of Plant
Genome Research, INDIA
Received: April 19, 2017 Accepted: August 6, 2017 Published: September 8, 2017
Copyright:© 2017 Ranwez et al. This is an open access article distributed under the terms of the
Creative Commons Attribution License, which permits unrestricted use, distribution, and reproduction in any medium, provided the original author and source are credited.
Data Availability Statement: All RNAseq raw data
are freely available on the NCBI RSA database (Sequence Read Archive) (cultivated: SAMN05277472 to SAMN05277481; wild: SAMN06052464 to SAMN06052472 and SAMN07313361). Other data (1) can be freely downloaded fromhttp://bioweb.supagro.inra.fr/ AlternativeSplicing/and (2) are within the paper and its Supporting Information files (S1_Table and S1_File).
Funding: This study was conducted in the
AS is recognised to be a “pivotal step between transcription and translation” [4]. It has been described as varying according to organ, according to developmental stages and even accord-ing to cell type [5]. AS complex regulation is the guarantee of a consistent development for a given organism [6], several AS misregulations have been identified as causing diseases [7,8]. Its role has been increasingly pointed out as a key factor of regulation in animals. The question of its prevalence in plants was much slower to emerge [9]. At the beginning of the last decade, AS started to be investigated in model species at the scale of the genome. The proportion of genes described as affected by AS has increased following the progress in sequencing technolo-gies, to reach values of 48% and 61% of the intron-containing genes for recent estimations in rice [10] andArabidopsis thaliana [11] respectively. Since RNAseq data is getting easier and cheaper to use, and bioinformatic tools are now available to process data and predict AS events (e.g. [12]) AS is now described, at the genomic scale, for many more species:Brachypodium distachyon [13],Vitis vinifera [14],Hordeum vulgare [15], tomato [16] and sorghum [17] to cite only a few of them. Some comparative analyses of AS have now started to be carried out on several species [18].
Regardless of the studied organism, the proportion of mRNA isoforms identified that are actually translated into functional proteins is not precisely known [19] and AS impact on plant proteome diversification is still being debated [20]. However, owing to the diversity and com-plexity of mRNA molecules AS generates, it is believed to play an essential role in the regula-tion of expression, and/or to affect translaregula-tion probability, via the nonsense-mediated decay (NMD). NMD is a process during which alternatively spliced isoforms possessing a premature stop codon are degraded [21,22]. Indeed AS induced regulation is very sensitive to environ-mental conditions. It has been shown that important changes in AS patterns occur in plants in response to environmental stresses (recently reviewed in [23,24,25]). A steady stream of new papers continuously brings additional examples of the role of AS in mechanisms involved in stress responses [26,27]. Finally AS has been shown to play a role in plant immunity, through plant disease resistance genes (R-genes) AS (reviewed in [28]).
Although AS plays a key role in several biological processes, the question of its intraspecific variability has been raised only recently and only a few cases of plant intraspecific variability have been studied so far. In a recent study, Potenza et al. explored the AS landscape in ten grapevine cultivars [14]. They found that the AS isoforms are well conserved across individuals with up to 21% of them conserved across the 10 genotypes despite the fact that in most cases (~70%) one isoform is expressed at least ten times less strongly than the canonical forms. An open question remains concerning AS isoform repertoire variation among cultivars possibly due to variability in the splicing sites or possibly to the fine tuning of the spliceosome machin-ery (other regulatory elements,cis or trans), or both.
Up to now, how AS is finely tuned in a given individual, organ, or developmental step, is not known but the mere fact that AS varies according to genotypes and environmental changes [24] is a clue to its potential role in genetic adaptation. Consequently, one could wonder whether crop and animal domestication has a significant impact on the pattern of variability of AS.
All the traits making the crop different from its wild relative are grouped under the term of ‘domestication syndrome’. In the case of plants, this includes changes in secondary metabo-lites, modifications of plant architecture, increases in fruit size, loss of seed dormancy and alteration of dispersion capacity, to cite only the main changes. However, it is quite variable according to species, and in particular, annual crops, such as sorghum, have been shown to exhibit significantly stronger domestication syndrome than perennial ones [29]. From a genetic standpoint, domestication is a combination of genetic drift effects caused by founder sampling (the strength of the resulting bottleneck varies according to species), and of selective effects caused by the deliberate selection of alleles for the advantage they confer for human
org), a project funded by Agropolis Fondation under the reference ID ARCAD 0900-001.
Competing interests: The authors have declared
uses [30]. One of the recurrent objectives is to identify the underlying genetic architecture of adaptation and ultimately the genes controlling physiological and morphological traits for which changes are observed between crops and their wild relatives [31]. The search for such genetic/phenotypic relationships is routinely done using Quantitative Trait Locus (QTL) map-ping, genome wide association study (GWAS) or selection scan approaches, although the latest do not directly explore the statistical links between allelic and phenotypic diversity.
Finally, beyond the methods aiming to correlate genetic to phenotypic variations caused by domestication, recent studies have focused on intermediate steps lying between genetic and phenotype, gene expression, in particular. Expression of 18,242 genes was surveyed in maize and teosinte, its wild ancestor [32,33]. Changes in expression levels were observed for 600 of them, but at the genome-wide scale, the coefficient of variation of expression among lines was not significantly different in maize and teosinte [33]. When considering the subset of ‘candi-date genes’ located in regions that they identify as undergoing either domestication or poste-rior selection, they observed a reduced variation in expression levels in maizeversus teosinte.
This could suggest thatcis-acting regulatory regions were affected by domestication [32]. In cotton, comparative gene expression showed a parallel up-regulation of several genes of the same gene family in independently domesticated cotton species [34]. In tomato, comparative transcriptomics revealed expression divergence between cultivated and wild accessions, and a correlation between network rewiring and light responsiveness in domesticated tomato [35]. In common bean a very clear decrease of gene expression variability (18%) was also detected in domesticated beans as compared to their wild counterparts [36]. Another strategy is to focus on the transcriptome of organs which underwent major morphological changes during domestication such as glumes in wheat [37] for which decreased expression levels of genes involved in cell walls, lignin, pectins and wax biosynthesis potentially contribute to the diver-gence of the glume’s properties between wild and cultivated wheat. In cotton, it was shown that domestication affected the expression of many genes in fiber cells, with twice as many genes differentially expressed in fiber cell development in domesticated cotton versus wild [38]. This approach may help to understand the biological mechanisms underlying the com-plex links between genotype and phenotype, even if the causal mutation(s) controlling the dif-ference of expression is (are) not identified. Additionally, as gene expression is an
‘intermediate’ trait, its analysis may help to identify genes that would have been missed through exclusive final phenotype variability analysis due to a lack of statistical power. Finally, a recent study identified a subset of genes expressing more isoforms in maize than in teosinte (wild relative of maize) but found no significant difference between their AS isoform reper-toires (i.e. type of alternative splicing events: intron retention, alternative acceptor site and so on) [39]. However, whether domestication has impacted alternative splicing expression vari-ability, and how, has not been described up to now.
In this paper, we study the impact of sorghum domestication on alternative splicing by identifying whether differential patterns of isoform expression are observed when comparing cultivated and wild compartments. Sorghum currently ranks fifth for grain production ton-nage, providing staple food for 500 million people worldwide [40]. Its success is mainly due to its high level of drought tolerance and to its adaptation to a large spectrum of environmental conditions and uses. The recent release of its genome sequence [41], its phylogenetic proximity with several important C4 species (maize, switchgrass, sugarcane) and its low genome com-plexity contribute to its interest on a more fundamental level.
TheSorghum bicolor species includes three sub-species: ssp. bicolor (the domesticated
form), ssp.verticilliflorum (the closest wild relative) and ssp. drumondii (the weedy form which
corresponds to stable hybrids between the wild relatives and the cultivated types). The wild and domesticated pools are inter-fertile and intense gene flows occur (e.g. [42–45]). However
a clear domestication syndrome is visible between the wild and cultivated pools. A key pheno-typic difference between the cultivated and wild sorghum forms, controlled by theSH1 gene
[46], is that the cultivated type has large non shattering seeds whereas the wild type has small shattering seeds. Other traits corresponding to plant architecture (tillering), seed weight etc. are also highly divergent between these pools.
Concerning the mating system, the cultivated form does less outcrossing than the wild one, but even if selfing is predominant, outcrossing can reach up to 20% in some cultivated races such as the Guinea [47].
According to Hamblin [48], the domestication history of sorghum is complex and cannot be summarized by a single bottleneck event. Such a simple model simply does not fit their data and more complex scenario, e.g. including multiple domestications or introgression from wild congeners, have to be considered. There is, however, no doubt that sorghum domestication has induced a significant reduction of its molecular diversity. Considering a sample that is rep-resentative of the extensive diversity of sorghum together with a whole genome sequencing approach, [49] showed that nucleotide diversity estimated throughπand wwere
respec-tively 35% and 28% lower in sorghum landraces compared to the wild genotypes. These reduc-tions reach respectively 39% when considering the whole genome and 34% when considering the genic regions only. The present paper aims at studying whether or not this documented loss of allelic diversity is accompanied by a loss of diversity in gene isoform relative expression.
The growing evidence of widespread intraspecific variability of AS, along with its potential role in adaptation makes it susceptible to demographic and selective events. As plant domesti-cation is a well-studied evolutionary process, during which demographic and selective effects are combined, we ask if, and how, domestication may have impacted AS. We ask also whether an extreme difference of AS patterns, between wild and cultivated accessions for a given gene, could be the signature of a selective effect on this gene AS pattern itself. Taking advantage of an mRNA dataset produced to document the domestication of several agronomical species [50] we chose to focus on sorghum for the quality of its genome assembly and annotation. To supplement [50] and [51] we used an additional sorghum accession (WS7) to be able to bal-ance the number of accessions so that we had ten for each compartment. RNAseq data from these ten cultivated and wild sorghum accessions were mapped on the sorghum reference genome. We focused on genes for which exactly two isoforms were identified and we studied the variability of the expression ratio between those isoforms across compartments.
Material and methods
Sorghum genome and annotation
We used the sorghum genome assembly Sbi1.4 and the corresponding transcript annotations provided on the plantGDB database (http://www.plantgdb.org/XGDB/phplib/download.php? GDB=Sb). The gene ontology annotations of those annotated sorghum genes have been down-loaded thanks to the biomart facilities of the plant ensEMBL database.
Biological material
Ten accessions of cultivated sorghum have been used to produce the sequence information,
Sorghum bicolor subsp. bicolor (denoted CS1 to CS10), and ten wild relatives (denoted WS1 to
WS10), chosen in order to best represent the genetic diversity of each compartment (Table 1). Note that below we used indifferently the terms ‘population’ and ‘compartment’.
We were mainly interested in comparing features observed within the compartment of 10 cultivated sorghum accessions, denoted as popCS10below, with those observed in the sample
Preliminary genomic analysis raised doubts concerning the assignation of the accession WS8 as a wild type. Indeed, SSR verifications and phenotypic observations of the seed lot received from the genebank revealed a misidentification. Additionally, a surprisingly low per-centage of reads from accessions WS1, WS2 and WS5 could be properly mapped on the refer-ence sorghum genome (details in result section). Thus, we removed those 4 accessions from our initial wild type sample popWS10(thereby generating a sample we noted popWS6) and, to
check for potential bias induced by sample sizes, we randomly subsampled 6 accessions in the cultivated sample. Four such subsamples were obtained (called popCS6_1, popCS6_2, popCS6_3,
popCS6_4below).
We use popCSx(respectively popWSx) to designate one of the above mentioned samples of
cultivated sorghum (respectively wild sorghum) in assertions that hold for all of cultivated (respectively wild type) samples. Finally, we use popSxto designate any of those sorghum samples.
RNA extraction and sequencing
The RNAseq data used were obtained from a larger project dedicated to the comparison of cul-tivated plants with their wild relatives ( http://www.arcad-project.org/projects/comparative-population-genomics). Tissue samples were collected from different organs, including leaves, grains, and inflorescence. Details for RNA extraction, Illumina libraries production and sequencing conditions are available in the Materials and Methods section of [50]. The cDNA libraries that contain a mixture of 65% RNA from the inflorescence, 15% from leaves and 20% from maturing seeds, for each accession, were sequenced using the Illumina mRNA-Seq, end protocol on a HiSeq2000 sequencer (one run for each compartment). The paired-end reads, in the illumina FASTQ format, were cleaned using cutAdapt [52] to trim read ends of poor quality (q score below 20) and to keep only those with an average quality above 30 and a minimum length of 25 base pairs. Those data are freely available on the NCBI RSA database (Sequence Read Archive) (cultivated:SAMN05277472toSAMN05277481; wild:
SAMN06052464 to SAMN06052472 and SAMN07313361).
Estimation of alternative transcript expression levels
Transcript expression levels have been estimated thanks to the Tuxedo pipeline [12]. This pipeline proceeds as follows. Firstly, for each accession, RNAseq reads are mapped on the
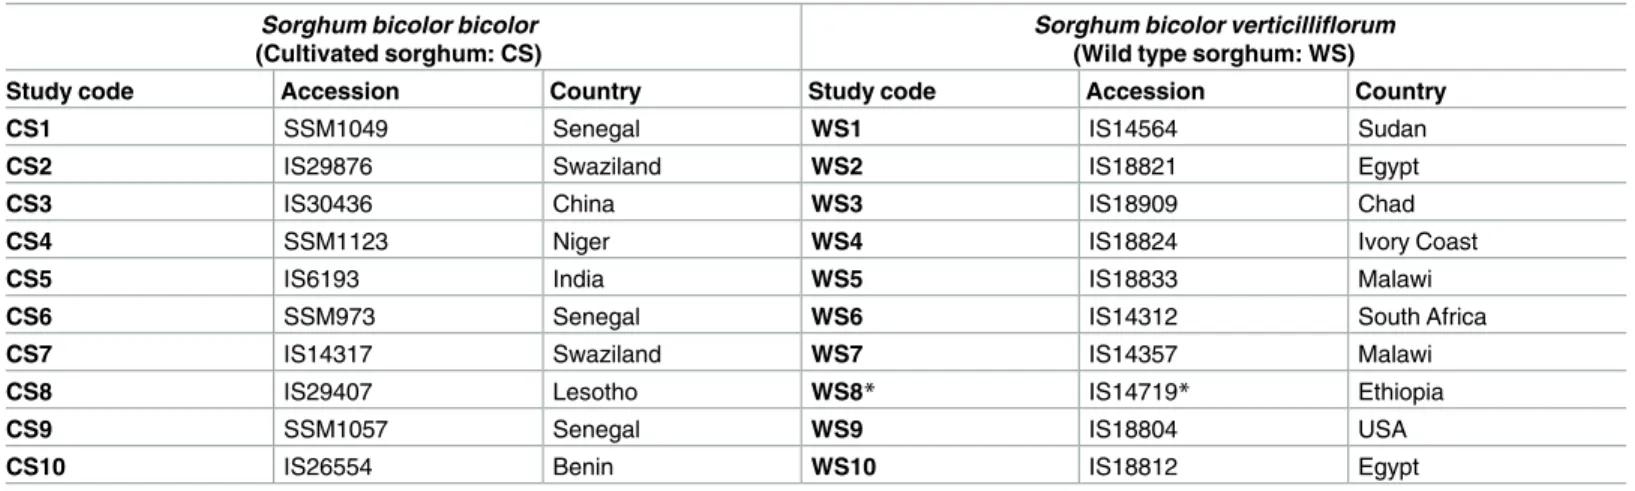
Table 1. Accession names and origins of sequenced sorghum accessions.
Sorghum bicolor bicolor
(Cultivated sorghum: CS)
Sorghum bicolor verticilliflorum
(Wild type sorghum: WS)
Study code Accession Country Study code Accession Country
CS1 SSM1049 Senegal WS1 IS14564 Sudan
CS2 IS29876 Swaziland WS2 IS18821 Egypt
CS3 IS30436 China WS3 IS18909 Chad
CS4 SSM1123 Niger WS4 IS18824 Ivory Coast
CS5 IS6193 India WS5 IS18833 Malawi
CS6 SSM973 Senegal WS6 IS14312 South Africa
CS7 IS14317 Swaziland WS7 IS14357 Malawi
CS8 IS29407 Lesotho WS8* IS14719* Ethiopia
CS9 SSM1057 Senegal WS9 IS18804 USA
CS10 IS26554 Benin WS10 IS18812 Egypt
*This accession was mis-assigned to the wild compartment (see next paragraph in M&M section).
reference genome using Tophat v2.0.13 [53] with bowtie2 v2.2.5 [54]. Secondly, the resulting mappings are used to enrich the initial gene and transcript predictions used, thanks to cuff-merge and cufflink, two programs of the cufflink suite v2.2.1 [55]. Finally, reads mappings and enriched annotations are combined to estimate, for each gene and accession, the expression level of every alternative transcript using cuffdiff, another program from the cufflink suite. The expression level is measured by cufflink as an ‘FPKM’ (Fragments Per Kilobase Of Exon Per Million Fragments Mapped), to account for heterogeneity of i) total number of reads per indi-vidual and ii) mRNA length.
When the average depth coverage of a gene was smaller than 5 for an accession, we consid-ered that the corresponding expression level could not be reliably estimated and we replaced the cuffdiff estimation by a missing data (NA) for the corresponding gene in the considered accession.
Estimation of alternative transcript expression ratios
We compare two panels of genotypes, popWSxand popCSx, based on a subset of genes selected
according to the following characteristics: i) genes expressing exactly two alternative tran-scripts (6,226 genes taken from the 33,795) ii) genes having an average depth coverage of at least 5 reads for every accession of popWSxand popCSx(i.e. no missing data) and iii)
tran-scripts of genes both being expressed in at least one accession of popWSxand at least one
accession of popCSx. These filters, being quite stringent, still allow us to rely on more than a
thousand genes for comparing any pair of wild/cultivated samples (cf. Results section). For such genes with exactly two isoforms, the alternative transcript expression levels can be sum-marized by a single expression ratio, denoted as eT-ratio below. The eT-ratio is simply the
expression of one transcript divided by the overall expression of the gene. For a given gene, if we denote by x its eT-ratio then using the alternative transcript at the numerator would have
led to an eT-ratio of 1-x. As long as the same isoform is used to calculate the eT-ratio for all
accessions (within the cultivated and wild samples), using one isoform or the other at the numerator of a gene eT-ratio does not matter when comparing their diversity in cultivated
ver-sus wild type samples. To homogenize the presentation of the results among genes we there-fore systematically used, for the eT-ratio numerator of a gene, the isoform leading to the
highest average eT-ratio along popWSxU popCSx, so that most of our eT-ratios range between
0.5 and 1 instead of being evenly spread between 0 and 1.
Estimation of transcript expression diversity within population
For a given gene G and sample popSx, the diversity of the transcript expression is simply the
diversity of its eT-ratios among the considered sample. If all eT-ratios of the given sample are
close to 1, the ‘first’ transcript of G (i.e. the isoform which, on average, is the most expressed
and hence used as the numerator of the eT-ratio) is much more expressed than its alternative
transcript in all accessions of this population. Note that eT-ratios can be roughly constant
among accessions of popSxno matter the value of this constant. The diversity of the expression
balance between the two isoforms of gene G among popSxcan be measured by the spread of its
eT-ratios, which can be quantified using either their variance (denoted asσr) or their
inter-quartile range (denoted as iqr). Both measures capture the variability of the eT-ratios but the
variance is much more sensitive to outlier eT-ratio values than the inter-quartile range.
Simi-larly, we will summarize the eT-ratios of a gene G among the popSxusing either the average
Results
Dataset characteristics
For each accession, the proportion of clean paired-end reads that successfully mapped on the sorghum V1.4 genome is provided inFig 1. Less than 50% of the clean reads of individuals WS1 (37.8%), WS2 (46.6%) and WS5 (46.7%) have been successively mapped on the sorghum genome. This low percentage strongly contrasts with other accessions for which at least 81.3% (for individual WS3) of the read pairs have been successively mapped. Similar results were obtained with other mapping tools, showing that this is not just an artifact of the chosen ping method. We did not find any satisfactory explanation to this low percentage of read map-ping and preferred to discard those three accessions for the current analysis together with individual WS8 for which we have some suspicions of misidentification.
The impact of the gene filtering applied to our dataset, in order to base our population com-parisons solely on genes with a relatively high sequencing coverage and no missing data in the compared populations, is detailed inTable 2. Note that despite quite a drastic filtering proce-dure, all pairwise population comparisons are conducted on more than one thousand genes.
Among the 1397 genes harboring exactly two isoforms (comparison popCS6_2 vs popWS6
Table 2, the highest number of genes among all the comparisons), 826 genes were already identified with two isoforms of transcripts in the publically available annotation, 556 genes
Fig 1. Number of clean pairs of reads mapped on the sorghum genome. The number of clean read pairs of each individual is indicated
by a blue bar for cultivated sorghum accessions or an orange bar for wild sorghum accessions. For any given accession, the darker or lighter part of each bar corresponds to mapped or not mapped read pairs on the sorghum genome.
were annotated with only one isoform of transcript, and 15 genes correspond to loci where no genes were identified. The information related to these genes is available inS1 Table(gene id, protein sequence when predictable, its length) and includes the nucleotide identifier number for mRNA sequences available inS1 File.
Distribution of e
T-ratio within cultivated and wild type sorghum
For each pairwise population comparison, we used either eT-ratio mean values and variances
within each population (Table 3), or eT-ratio medians and interquartiles (Table 4). For all
popCSxvs popWSxcomparisons, diversity of eT-ratios is significantly higher in cultivated
pop-ulations than in domesticated ones. Indeed, most genes have an eT-ratio variance higher in the
wild population than in the cultivated one. For instance, eT-ratio variance is higher in
popWS10than in popCS10for 773 genes out of 1134 (~68%). The percentage of genes having
an eT-ratio which is more variable in the wild population than in the cultivated population
var-ies depending on the compared populations but is always significantly higher than 50% according to paired student t-test (highest p-value 1.63e-110) and Wilcoxon test (highest p-value 5.09e-10). The same observation holds true for comparisons based on eT-ratio medians
and inter-quartile ranges. In all population comparisons but one, the inter-quartile range is very significantly lower in the cultivated population (p-value<1.50e-8for student test and
<1.79e-9for Wilcoxon test). The sole minor exception is for the comparison of popCS10and
Table 2. Number of genes considered for the analysis after filtering on quality and coverage.
Compared Population Number of genes with 2 isoforms and a gene coverage above 5 for each individual
and both isoforms expressed in both populations popCS10vs popWS10 6,226 1,385 1,134 popCS10vs popWS6 6,226 1,635 1,358 popCS6_1vs popWS6 6,226 1,653 1,350 popCS6_2vs popWS6 6,226 1,698 1,397 popCS6_3vs popWS6 6,226 1,668 1,356 popCS6_4vs popWS6 6,226 1,682 1,383 https://doi.org/10.1371/journal.pone.0183454.t002
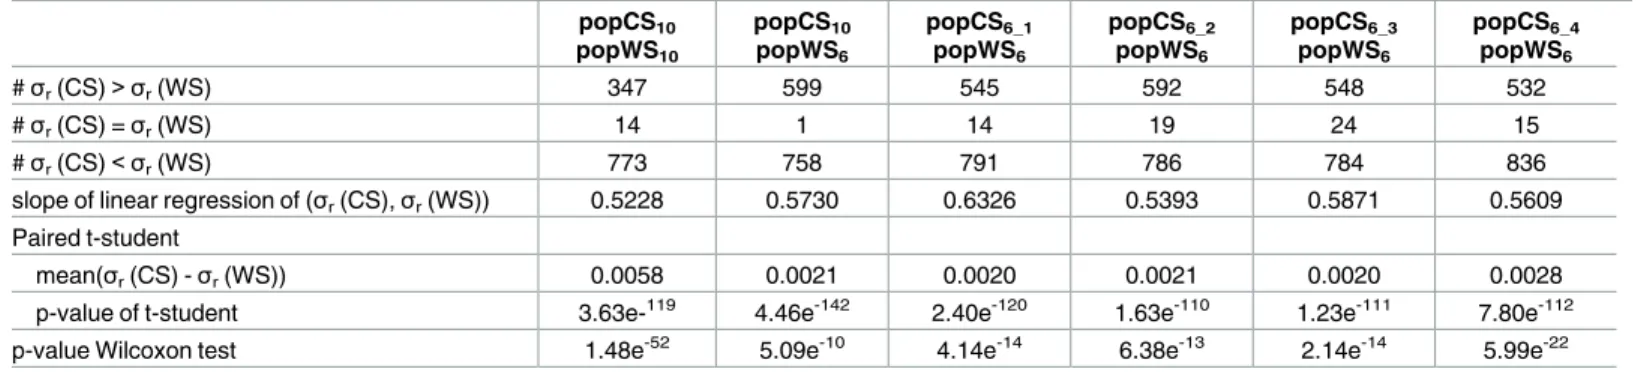
Table 3. Comparison of the eT-ratios variance between cultivated and wild sorghum samples. popCS10 popWS10 popCS10 popWS6 popCS6_1 popWS6 popCS6_2 popWS6 popCS6_3 popWS6 popCS6_4 popWS6 #σr(CS)> σr(WS) 347 599 545 592 548 532 #σr(CS) =σr(WS) 14 1 14 19 24 15 #σr(CS)< σr(WS) 773 758 791 786 784 836
slope of linear regression of (σr(CS),σr(WS)) 0.5228 0.5730 0.6326 0.5393 0.5871 0.5609 Paired t-student
mean(σr(CS) -σr(WS)) 0.0058 0.0021 0.0020 0.0021 0.0020 0.0028
p-value of t-student 3.63e-119 4.46e-142 2.40e-120 1.63e-110 1.23e-111 7.80e-112
p-value Wilcoxon test 1.48e-52 5.09e-10 4.14e-14 6.38e-13 2.14e-14 5.99e-22
Each column corresponds to the comparison between a sample of cultivated genotypes and a sample of wild genotypes. In the first (resp. second and third) line are reported the number of genes with an eT-ratio variance (σr) in the cultivated panel higher than (resp. equal to, lower than) in the wild sample. The fourth line indicates the slope of the linear interpolation of the points havingσr(CS) as abscises andσr(WS) as ordinate. The mean value of the differences betweenσr(CS) andσr(WS) is provided in the next line, and the last two lines provide respectively the value of the paired t-test and the p-value of the Wilcoxon test to statistically asses the significance of the difference betweenσr(CS) andσr(WS) distributions.
popWS6, two populations of different sizes, that do have significantly different eT-ratio
inter-quartile ranges but with not so low p-values (p-value 0.0039 for the paired student t-test and 0.0452 for the Wilcoxon test). The simple eT-ratio dot plot displayed inFig 2gives visual
prominence to this general trend of higher variance (or interquartile range) of eT-ratio in wild
populations than in cultivated ones.
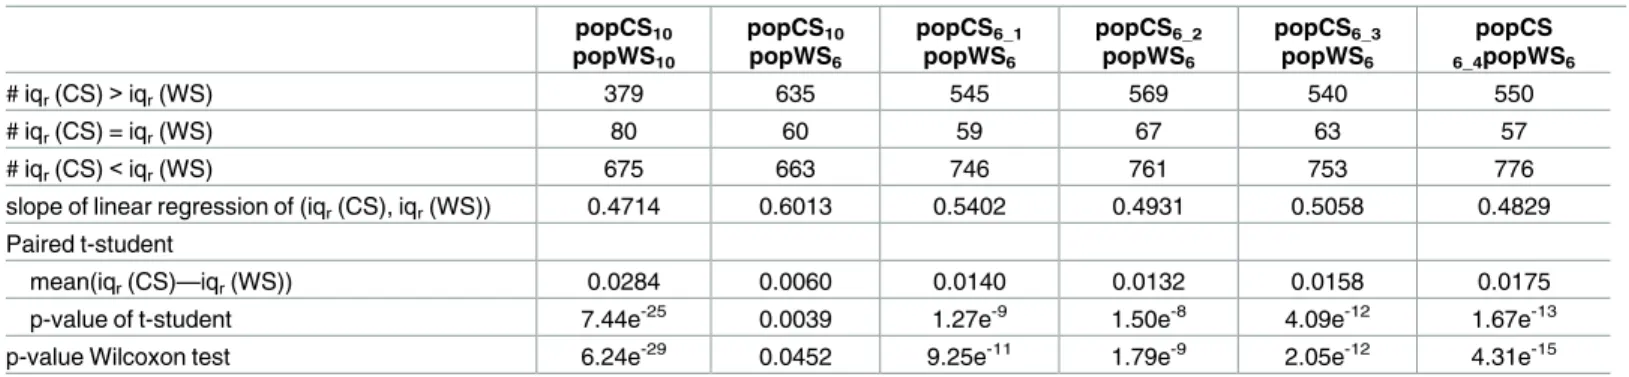
Table 4. Comparison of the eT-ratio inter-quartile range between cultivated and wild sorghum samples. (see detailed legend inTable 3). popCS10 popWS10 popCS10 popWS6 popCS6_1 popWS6 popCS6_2 popWS6 popCS6_3 popWS6 popCS 6_4popWS6 # iqr(CS)>iqr(WS) 379 635 545 569 540 550 # iqr(CS) = iqr(WS) 80 60 59 67 63 57 # iqr(CS)<iqr(WS) 675 663 746 761 753 776
slope of linear regression of (iqr(CS), iqr(WS)) 0.4714 0.6013 0.5402 0.4931 0.5058 0.4829 Paired t-student
mean(iqr(CS)—iqr(WS)) 0.0284 0.0060 0.0140 0.0132 0.0158 0.0175
p-value of t-student 7.44e-25 0.0039 1.27e-9 1.50e-8 4.09e-12 1.67e-13
p-value Wilcoxon test 6.24e-29 0.0452 9.25e-11 1.79e-9 2.05e-12 4.31e-15
Each column corresponds to the comparison between a sample of cultivated genotypes and a sample of wild genotypes. In the first (resp. second and third) line are reported the number of genes with an eT-ratio inter-quartile range (iqr) in the cultivated panel higher than (resp. equal to, lower than) in the wild sample. The fourth line indicates the slope of the linear interpolation of the points having iqr(CS) as abscises and iqr(WS) as ordinate. The mean value of the differences between iqr(CS) and iqr(WS) is provided in the next line, and the last two lines provide respectively the p-value of the paired t-test and the p-value of the Wilcoxon test to statistically asses the significance of the difference between iqr(CS) and iqr(WS) distributions.
https://doi.org/10.1371/journal.pone.0183454.t004
Fig 2. Dot plot comparison of the eT-ratio spread among cultivated and wild type populations. In each plot a dot represents a gene
whose position corresponds to its eT-ratio spread measure by interquartile range (resp. variance) in the three top (resp. bottom) plots,
observed in a sample of cultivated sorghum (abscise) and in a sample of wild sorghum accessions (ordinate). The red lines represent the linear interpolation of those points (the line slopes are provided in Tables3and4) and the dashed lines depict the y = x line to ease picture interpretation.
Organization of sorghum accessions based on their e
T-ratios
The eT-ratios are not only less variable in the domesticated compartments, they also seem to
be sufficient to correctly differentiate cultivated accessions from wild type accessions. Consid-ering the eT-ratio of each gene as a coordinate, each accession can be positioned in a highly
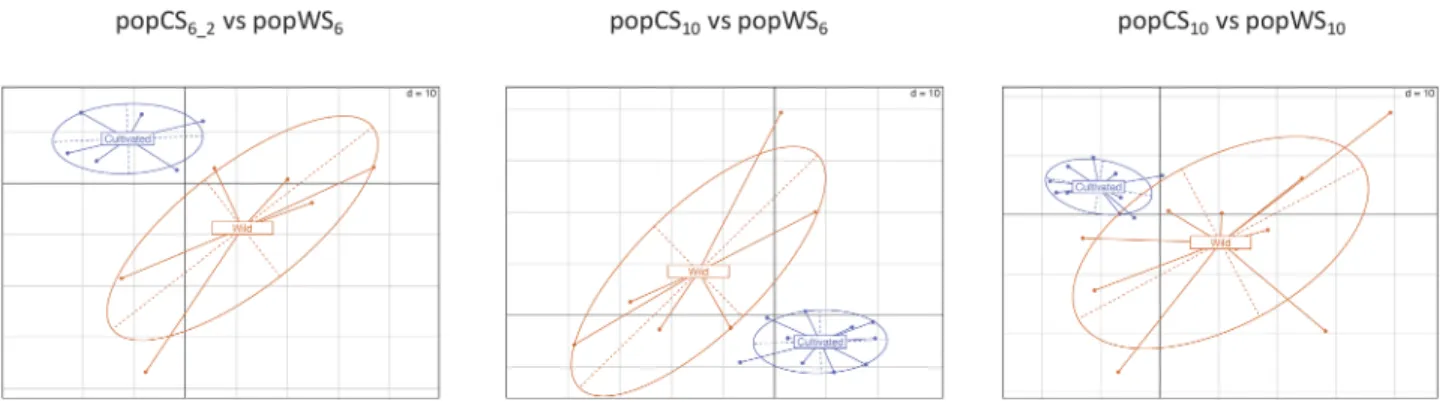
multidimensional space. The usual Principal Component Analysis (PCA) can then be used to project these accessions/points in a lower dimensional space while preserving most of the orig-inal variance. The projection obtained on the two first axis of the PCA analysis are provided in
Fig 3where cultivated accessions group together in a much more compact group than the wild individuals. Note also that, in the three PCA projections displayed inFig 3, the two axes used for the projection explain more than 30% of the original variance.
Genes with contrasted e
T-ratios distribution in wild and cultivated
sorghum
Genes with contrasted eT-ratio variability between the cultivated and wild compartments are
potentially related to the domestication syndrome. To identify such genes, we were looking for genes having an interquartile range which differs between both populations by at least 0.2,i.e.
genes such as |iqr(CS)—iqr(WS)| > 0.2. We found about twice as many genes with a higher
interquartile range in wild compartments compared to the cultivated ones, than the opposite way around (Fig 4). All identified genes are interesting as such contrasts of eT-ratio, whatever
their orientation, may reveal genes that have been affected by domestication.
A total of 59 genes were identified when comparing popCS6_2and popWS6(Fig 4), among
which nineteen are consistently recovered by the three population comparisons we focus on. Twelve out of these nineteen genes are annotated by specific GO terms. To find out if some GO terms are over represented in this set of 12 genes with respect to the set of 921 annotated genes common to the three population comparisons, we relied on the AgriGO webserver (http://bioinfo.cau.edu.cn/agriGO/analysis.php). This enrichment analysis was done using Singular Enrichment Analysis (SEA) with hypergeometric test, p-value threshold at 0.05 and Bonferroni correction for multiple testing. A single annotation is found to be over-represented by this test (p-value 0.00042), the GO term ‘regulation of biological quality’ (GO:0065008). This GO term has a frequency of 0.42 (5/12) in our subset versus a frequency of 0.04 (40/921) in the subset of annotated genes common to the 3 population comparisons. The five genes
Fig 3. Cultivated and wild type sorghum sample 2D projection using a PCA of their eT-ratios. Each sorghum accession, associated
with eT-ratios, can be seen as a point in a high dimensional space. This figure displays the projection of these points on the two first PCA axes using orange /blue dots to represent wild /cultivated individuals. The two first axes explain more than 30% of the original variability in all three cases.
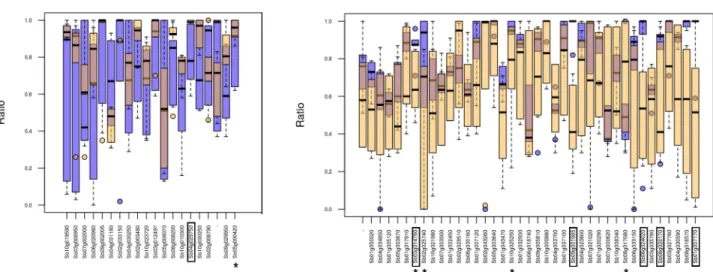
annotated by this GO term are Sb02g025740, Sb03g014780, Sb05g000420, Sb08g017080, and Sb10g025250 (marked by a star inFig 4).
Finally, we were looking for genes having an eT-ratio (isoform expression balance) that
strongly differs in wild and cultivated population. More precisely, we were searching for genes with a difference of eT-ratio median value in cultivated and wild compartments greater than
0.2. For this filter, we added the constraint that the median difference should also be superior to the average intrapopulation eT-ratio spread, leading to the following filter formulation: |
medr(CS)- medr(WS)| > max(0.2, (iqr(CS) + iqr(WS))/2). This provides us with genes that
have a difference in eT-ratio between the two compartments (cultivated / wild) that exceed
dif-ferences observed within compartments (Fig 5). A total of 47 genes were identified when com-paring popCS6_2and popWS6, among which fifteen were common to the three population
comparisons we are focusing on, but this time, we found no over represented GO-term among these genes.
Six genes are common to both comparisons and are contrasted between the cultivated and wild compartments for both eT-ratio interquartile and median: Sb01g007170, Sb08g020170,
Sb03g014780, Sb06g024020, Sb09g001985 and Sb04g029750. These genes are framed in Figs4
and5.
We then tried to estimate the potential impact of the AS events for those genes, by compar-ing the ‘alternative’ protein to the canonic one predicted accordcompar-ing to the annotation of each gene in the sorghum genome version Sbi1.4 (cf. M&M section). The AS events were classified into 4 categories. In the first category, the start codon of the canonic form is not present any-more (no translation prediction is made). In the second category, a stop codon appeared very early (in the first 20% of canonical protein), often due to an early frame shift. In these two cases we can speculate that the AS event may be deleterious (although it can have a role in mRNA degradation). In the third category, the alternative protein is slightly different from the canonical one (i.e. either with indels affecting less than ten percent of the protein, or identical
on more than 50% of the protein but with an equivalent length, or with an identical sequence on a minimum length of 500 amino acids). In the last category the two proteins are 100%
Fig 4. Genes with a contrasted eT-ratio interquartile in cultivated (popCS6_2) and wild (popWS6) samples. Box plot representations of
the eT-ratio in the cultivated (blue) and wild (orange) samples, for genes with an eT-ratio more variable in cultivated (left) or wild (right) samples. The genes marked by a star are annotated by the GO term ‘regulation of biological quality’. The framed genes are common to
Fig 5.
identical (i.e. the AS event concerned only UTR). We can speculate that the alternative protein
isoform is functional in these two last categories and that the equilibrium between both mRNA isoforms may have a biological significance (either regulation of amounts of protein, or different roles of the protein themselves).Table 5provides the distribution, in the 4 above mentioned categories, of the genes having a contrasted eT-ratio interquartile in cultivated and
wild compartments (genes detailed inFig 4).
Finally, in order to go further with the interpretation of our results, we were trying to deter-mine the function of the genes identified as having a contrasted eT-ratio distribution, and, in
particular, to look for genes potentially involved in traits related to the domestication syndrome.
As mentioned above, Sb03g014780 belongs to the GO term ‘regulation of biological quality’ which was over-represented in the gene-set presenting the highest eT-ratio interquartile
con-trast (Fig 4). This gene is also identified as having a high eT-ratio median difference between
the wild and the cultivated compartment (Fig 5, framed). The protein predicted for this gene presents 96% of identity with the protein accession Q7G8Y3.2 encoded by the rice gene Os01g0367900. This protein corresponds to a probable chromatin-remodeling complex ATPase chain also known as ISW2 (Imitation Switch Protein 2) which is involved in coordi-nating transcriptional repression in saccharomyces cerevisiae [56]. The alternative isoform is lacking 28 amino acids, located in a region where three nucleotide binding sites are detected. The deletion is located precisely between the two last nucleotide binding sites, resulting in the merging of those sites. Consequently, in the alternative protein isoform only two nucleotide
Fig 5. Genes with a contrasted eT-ratio median in cultivated (popCS6_2) and wild (popWS6) samples. Box plot representations of the
eT-ratio in the cultivated (blue) and wild (orange) sample. The framed genes are common toFig 4.
https://doi.org/10.1371/journal.pone.0183454.g005
Table 5. Distribution of genes with contrasted eT-ratio interquartile in cultivated and wild compartments (Fig 4) according to the potential func-tional impact of the alternative isoform.
Genes with larger eT-ratio interquartile in Identical protein Potentially functional protein Total ‘functional’ ‘Non functional’ protein No protein identified Total ‘deleterious’
Cultivated (Fig 4left) 8 10 18 (95%) 0 1 1 (5%)
Wild (Fig 4right) 10 10 20 (53%) 2 16 18 (47%)
binding sites are detected. Experimental data would be needed to investigate if its efficiency is affected as it can be predicted from the in silico analysis.
Two other genes annotated by the above-mentioned GO term ‘regulation of biological qual-ity’ and having contrasted eT-ratio interquartile, are homologous to genes identified in
selec-tion scan studies or genome wide associaselec-tion studies (GWAS) in other species, underlying their putative impact on plant phenotype.
The first one is Sb02g025740. The protein predicted from this gene presents 69% identity with the protein accession Q8LCQ4.1 which is encoded by the LHCA6_ARATH locus from
Arabidopis thaliana (At1g19150). This protein corresponds to a Photosystem I light harvesting
chlorophyll a/b also known as Light Harvesting Complex. These proteins, through their inter-actions with the core complexes of both photosystems, are involved in the enhancement and regulation of light-harvesting, the transfer of light energy to the photosynthetic reaction cen-ters and also provide protection against photo-oxidative stress [57]. Photosystem Light har-vesting chlorophyll a/b proteins have been identified through genome wide association studies as being involved in the photochemical reflectance index in Soybean [58] and to several agro-nomical traits (height, spike length, number of grains per spike, thousand grain weight, flag leaf area and leaf color) in barley [59]. The alternative splicing event identified for this gene is showing an insertion of only one amino acid in position 16, the rest of the protein is 100% identical to the canonic form.
The second gene is Sb10g025250. Its derived protein presents 73% identity with the protein accession Q949Y3 encoded by At5g34850. This protein corresponds to a bifunctional purple acid phosphatase. Purple acid phosphatases are known to be involved in phosphate acquisition and play a role in phosphate deficiency adaptations [60,61]. In a recent study on soybean, the geneGmACP1 was identified as playing a significant role in soybean tolerance to low
phospho-rus [62]. In addition, inHelianthus annuus, evidence of selective sweeps combined with higher
than expected Fst values were also identified for a purple acid phosphatase [63].
The last gene identified with a high eT-ratio interquartile difference (Fig 4) and for which a
function can be predicted is Sb04g030590. This gene codes for a protein showing 93% identity with a soluble inorganic pyrophosphatase (Q0DYB1) encoded by the rice gene Os02g0704900. This protein catalyzes the irreversible hydrolysis of pyrophosphate [64]. In apple, one locus showing signature of selection between wild and domesticated apples was located in a gene coding for an inorganic pyrophosphatase, and this function is described as associated with sugar metabolism and acidity [65]. Indeed, Fruit quality traits have played critical roles in domestication of the apple [65].
Finally, among genes for which a high difference of eT-ratio median value is observed
between the wild and cultivated sample (Fig 5), the gene Sb1g007850 is potentially involved in ‘the flowering pathway’, another trait of agronomic interest which is often mentioned as a tar-get of the domestication process. Indeed this gene presents more than 90% of amino acid iden-tity with the photoreceptor phytochromes C, from several grass species including rice, maize andBrachypodium dystachion. In the temperate model grass Brachypodium dystachion,
phyto-chromes C has been shown to be an essential light receptor involved in photoperiodic flower-ing [66]. In pearl millet, natural variations at the phytochrome C locus are linked to flowering time and morphological variations [67]. The alternative isoform detected with our RNAseq data does not comprise the start codon of the canonical form. Only one copy of phytochrome C is identified in sorghum and it is tempting to speculate that the alternative isoform may be deleterious. The eT-ratio between both forms is clearly different between the wild and the
culti-vated compartment (Fig 5). However, drawing conclusions about a potential selective effect at this locus, linked to domestication would require additional investigations.
Discussion
Domestication has been shown to impact phenotypic traits, genetic diversity, and gene expres-sion and to be associated with selective effects on a wide number of loci. One study comparing AS profiles in domesticated maize and its wild relative teosinte, has recently been published [39]. To our knowledge, this is the sole publication comparing AS between wild and cultivated plants, and nothing at all has been published so far regarding the impact of domestication on the relative expression of gene isoforms or, more generally, on the diversity of AS expression levels. Here we relied on available RNAseq data to document AS expression variability between wild and cultivated sorghum.
Strict filters are needed to focus on ‘non-erratic’ AS events
The biological meaning of the complex splicing landscape is still not totally understood. Within the population of mRNA molecules, some variants are issued from random splicing errors and can be assimilated to background noise. Those erratic AS events are not supposed to be present in high frequency. They can therefore be eliminated, or at least strongly mini-mized, by increasing the sequencing coverage threshold used to assert the presence of iso-forms. The remaining AS events may be qualified as ‘non-erratic’ AS events and may have a positive, neutral or negative impact on the organism. They are, somehow, controlled and induced by genetic and/or environmental factors and should be, at least partially, heritable. As such, they are expected to be consistently found in a given genotype, and potentially in other genotypes of the same species, provided that sequencing and environmental conditions are similar.
Our analyses rely on a subset of genes expressing exactly two isoforms. We applied several filters to remove as many as possible of the erratic AS isoformsi.e. a minimum coverage
(depth of sequencing) over the whole transcript and isoform presence in at least two individu-als (one cultivated and one wild). According to the high level of expression of the genes we selected in our dataset, and the observed consistency among wild and cultivated compart-ments, we are quite confident that the AS events we were focusing on are not background noise of splicing machinery.
The domestication bottleneck is most likely the cause of the global
reduction of e
T-ratio variability in domesticated sorghum
A strong and significant loss of variability of eT-ratio (i.e. balance of the two isoforms resulting
from AS) is observed between wild and cultivated compartments (Tables3and4,Fig 2). This result is observed irrespective of the accession samplings considered for each compartment and thus extremely reliable. If domestication has been shown to substantially reduce nucleo-tide diversity in a vast range of species, including sorghum [45,49], we show here, for the first time, that domestication also impacts the regulation of the alternative splicing process itself.
AS regulation appears extremely complex and sensitive to environmental stimuli [24]. In this study, the mRNA extraction conditions were—as much as possible—homogenous for all genotypes, we assume that the variability observed is mainly reflecting the genotypic variabil-ity. A parallel can be drawn between our results and the results obtained in beans for which a very clear decrease of gene expression variability (18%) was also detected in domesticated beans as compared to their wild counterparts [36]. This loss of expression variability was inter-preted as a direct consequence of the strong loss of genetic diversity observed during common bean domestication (almost 50% in coding sequences) affecting DNA regions involved in tran-scription regulation. Here we assume that the significant loss in AS variability we observe in
sorghum is also due to nucleotide variability loss during domestication, in particular in regions where bothtrans and cis elements controlling AS are located. Two additional elements
rein-force this hypothesis. First, in maize, the diversity ofcis regulatory elements has been shown to
be reduced by domestication and thecis element themselves have been suggested to be targets
of selection during domestication [68]. Second, in humans, several studies show that AS is, at least partially, controlled by nucleotide diversity present in genomic regions which are more or less close to the target gene [69,70,71]. A reduction of nucleotide variability in these regions, whatever their exact distance to the targeted genes, is expected to impact AS variabil-ity. Genome wide association mapping on AS variability using either wild or domesticated plants could help to further document these interactions.
The global loss of eT-ratio variability, observed between the cultivated and the wild
sor-ghum compartments, is most likely due to the loss of nucleotide diversity induced by the strong demographic bottleneck caused by domestication. Under this neutral, genetic drift related, assumption, the balance between isoforms is expected to have a minute effect for most genes. However, the cumulative effect over the genome might be an important component of the genetic load incurred by domestication. Results fromTable 5tend to confirm this hypothesis.
Indeed, AS events are approximately equally distributed between ‘functional’ and ‘deleteri-ous’ in genes for which the eT-ratio interquartile is higher in the wild compartment, in
agree-ment with the neutral hypothesis of this expression diversity reduction. Note that, though the global trend of AS annotation provided inTable 5may be informative, each individual AS annotation should not be taken for granted. The assignation of a specific AS event as leading to either a functional or non-functional protein needs to be empirically confirmed. Indeed, although an early stop codon is a gage of loss of protein functionality, the effect of the other mutations is not as easily predictable.
The e
T-ratios may provide valuable insight for a better understanding of
the domestication syndrome
The extent of the nucleotide diversity loss due to domestication is used to characterize the strength of the demographic bottleneck occurring during the domestication process itself [30]. In sorghum, the strength of the bottleneck has been documented to be around 25% (θπ) and
38% (θW) at the whole genome level [49]. When only genic regions are considered the strength
of the bottleneck is estimated around 39% (θπ) and 34% (θW) [49]. The slopes of the linear
regressions between wild and cultivated eT-ratio are between 0.52 and 0.63 for eT-ratio
vari-ance and between 0.47 and 0.60 for eT-ratio inter-quartile range (Tables3and4). These values
could be seen as another insight of the intensity of the bottleneck but are much higher than those derived from nucleotide polymorphism studies. Although it is hazardous to compare these values (different methods and slightly different datasets) we can conclude that the impact of domestication on AS is strong. It is also possible that the nucleotide diversity reduction impacted some loci with pleiotropic effects on AS regulation. The impacts of domestication on AS would deserve to be explored in other species in order to determine whether such a large impact is specific to sorghum or if it is a general trend among domesticated species.
After having discussed the fact that the global decrease of eT-ratio variability in the
domesti-cated compartment can be interpreted as a consequence of demographic bottlenecks, we now ask whether this result is entirely neutral (affected by demographic events only), or if it could also result from selective effects. In other words, may a given isoform, or ratio between two iso-forms, have increased in frequency in the cultivated compartment because it procures an advantage in the domesticated context, as found for key genes controlling the domestication
syndrome [30,31]. At the genome scale, domestication tends to reduce diversity, however, a gain of diversity can be locally associated with the post domestication diversification especially for loci responsible for interesting traits. This possibility is supported by the results provided inTable 5. Indeed, most AS events identified in genes for which the eT-ratio interquartile is
higher in cultivated compartments corresponds to potentially ‘functional’ events (whereas AS events found in genes where eT-ratio interquartile is lower in cultivated compartments are
almost equally distributed between functional and non-functional).
To further confirm this hypothesis we looked closer at the genes showing the most extreme changes in eT-ratio median value or interquartile. We found that the ‘regulation of biological
quality’ GO annotation was over-represented among the genes for which the eT-ratio
inter-quartile in cultivated vs wild sorghum differs the most. Most genes showing the strongest AS eT-ratio differences (outliers) are highly homologous to genes of other species shown to be
involved in the genetic control of phenotypic traits related to the domestication syndrome. It could be worth to conduct a deeper functional analysis of the few remaining unannotated out-lier genes. We are convinced that such AS eT-ratio signatures could reveal domestication genes
otherwise missed by more traditional methods of selection footprint detection or quantitative genetic approaches (QTL/GWAS).
Finally, in the same way that nucleotide diversity is a mutation reservoir on which natural selection acts, AS can be seen as a leverage on which selection may act too. It should also be kept in mind that AS is a mechanism which can be mobilized to respond to environmental stresses (recently reviewed in [23,24,25]). The loss of AS variability caused by domestication is contributing to the domestication load, and probably affects the adaptability potential of crops. This result also underlines the key importance of the conservation and management of the wild compartment to ensure its mobilization in the breeding process of cultivated genotypes.
Supporting information
S1 Table. Isoforms list. In this table are listed, for each isoform, 1) the locus (‘gene_id’), 2) the
cufflink_id, 3) the origin of the isoform (described in the publically available annotation or new identified isoform by ‘cufflink’), 4) the predicted protein (when possible), 5) the length of the protein and 6) the identifier of the mRNA under which the sequence is named in the fasta file (S1 File). Note that for some alternative isoforms the start codon of the canonical isoform (given in the publically available annotation) is not present anymore in the alternative mRNA, making protein prediction hazardous, and is then noted ‘start_codon_not_found’.
(XLSX)
S1 File. Fasta file containing the mRNA sequences of the 2794 isoforms.
(FASTA)
Acknowledgments
The authors are very grateful to the ARCAD project (Agropolis Resource Center for Crop Conservation, Adaptation and Diversity), a flagship project of the Agropolis Fondation which gave them the opportunity to study AS in the context of sorghum domestication. They also want to thank ICRISAT Gene bank for providing the cultivated and wild sorghum seeds with a IS prefix and the Center for Biological tropical Resources of Montpellier (CRB Tropicales de Montpellier) for providing the cultivated accessions with a SSM prefix.
Author Contributions
Conceptualization: Vincent Ranwez, Nathalie Chantret. Data curation: Audrey Serra.
Formal analysis: Audrey Serra.
Funding acquisition: Nathalie Chantret.
Investigation: Vincent Ranwez, Nathalie Chantret.
Methodology: Vincent Ranwez, Audrey Serra, Nathalie Chantret. Project administration: Vincent Ranwez, Nathalie Chantret. Resources: David Pot.
Software: Vincent Ranwez, Audrey Serra. Supervision: Vincent Ranwez, Nathalie Chantret.
Validation: Vincent Ranwez, David Pot, Nathalie Chantret. Visualization: Vincent Ranwez, Nathalie Chantret.
Writing – original draft: Vincent Ranwez, Nathalie Chantret.
Writing – review & editing: Vincent Ranwez, David Pot, Nathalie Chantret.
References
1. Nilsen TW, Graveley BR. Expansion of the eukaryotic proteome by alternative splicing. Nature. 2010; 463(7280):457–63.https://doi.org/10.1038/nature08909PMID:20110989.
2. Modrek B, Lee C. A genomic view of alternative splicing. Nature genetics. 2002; 30(1):13–9.https://doi. org/10.1038/ng0102-13PMID:11753382.
3. Barbosa-Morais NL, Irimia M, Pan Q, Xiong HY, Gueroussov S, Lee LJ, et al. The evolutionary land-scape of alternative splicing in vertebrate species. Science. 2012; 338(6114):1587–93.https://doi.org/ 10.1126/science.1230612PMID:23258890.
4. Kornblihtt AR, Schor IE, Allo M, Dujardin G, Petrillo E, Munoz MJ. Alternative splicing: a pivotal step between eukaryotic transcription and translation. Nat Rev Mol Cell Biol. 2013; 14(3):153–65.https://doi. org/10.1038/nrm3525PMID:23385723.
5. Lopez-Diez R, Rastrojo A, Villate O, Aguado B. Complex tissue-specific patterns and distribution of mul-tiple RAGE splice variants in different mammals. Genome Biol Evol. 2013; 5(12):2420–35.https://doi. org/10.1093/gbe/evt188PMID:24273313.
6. Chen M, Manley JL. Mechanisms of alternative splicing regulation: insights from molecular and geno-mics approaches. Nat Rev Mol Cell Biol. 2009; 10(11):741–54.https://doi.org/10.1038/nrm2777PMID:
19773805.
7. Caceres JF, Kornblihtt AR. Alternative splicing: multiple control mechanisms and involvement in human disease. Trends Genet. 2002; 18(4):186–93. PMID:11932019.
8. Cieply B, Carstens RP. Functional roles of alternative splicing factors in human disease. Wiley Interdis-cip Rev RNA. 2015; 6(3):311–26.https://doi.org/10.1002/wrna.1276PMID:25630614.
9. Kazan K. Alternative splicing and proteome diversity in plants: the tip of the iceberg has just emerged. Trends Plant Sci. 2003; 8(10):468–71.https://doi.org/10.1016/j.tplants.2003.09.001PMID:14557042.
10. Lu T, Lu G, Fan D, Zhu C, Li W, Zhao Q, et al. Function annotation of the rice transcriptome at single-nucleotide resolution by RNA-seq. Genome research. 2010; 20(9):1238–49.https://doi.org/10.1101/gr. 106120.110PMID:20627892.
11. Marquez Y, Brown JW, Simpson C, Barta A, Kalyna M. Transcriptome survey reveals increased com-plexity of the alternative splicing landscape in Arabidopsis. Genome research. 2012; 22(6):1184–95.
https://doi.org/10.1101/gr.134106.111PMID:22391557.
12. Trapnell C, Roberts A, Goff L, Pertea G, Kim D, Kelley DR, et al. Differential gene and transcript expres-sion analysis of RNA-seq experiments with TopHat and Cufflinks. Nat Protoc. 2012; 7(3):562–78.
13. Walters B, Lum G, Sablok G, Min XJ. Genome-wide landscape of alternative splicing events in Brachy-podium distachyon. DNA research: an international journal for rapid publication of reports on genes and genomes. 2013; 20(2):163–71.https://doi.org/10.1093/dnares/dss041PMID:23297300.
14. Potenza E, Racchi ML, Sterck L, Coller E, Asquini E, Tosatto SC, et al. Exploration of alternative splic-ing events in ten different grapevine cultivars. BMC genomics. 2015; 16(1):706.https://doi.org/10.1186/ s12864-015-1922-5PMID:26380971.
15. Panahi B, Mohammadi SA, Ebrahimi Khaksefidi R, Fallah Mehrabadi J, Ebrahimie E. Genome-wide analysis of alternative splicing events in Hordeum vulgare: Highlighting retention of intron-based splic-ing and its possible function through network analysis. FEBS Lett. 2015; 589(23):3564–75.https://doi. org/10.1016/j.febslet.2015.09.023PMID:26454178.
16. Sun Y, Xiao H. Identification of alternative splicing events by RNA sequencing in early growth tomato fruits. BMC genomics. 2015; 16(1):948.https://doi.org/10.1186/s12864-015-2128-6PMID:26573826.
17. Panahi B, Abbaszadeh B, Taghizadeghan M, Ebrahimie E. Genome-wide survey of Alternative Splicing in Sorghum Bicolor. Physiol Mol Biol Plants. 2014; 20(3):323–9. https://doi.org/10.1007/s12298-014-0245-3PMID:25049459.
18. Chuang TJ, Yang MY, Lin CC, Hsieh PH, Hung LY. Comparative genomics of grass EST libraries reveals previously uncharacterized splicing events in crop plants. BMC Plant Biol. 2015; 15:39.https:// doi.org/10.1186/s12870-015-0431-7PMID:25652661.
19. Ezkurdia I, del Pozo A, Frankish A, Rodriguez JM, Harrow J, Ashman K, et al. Comparative proteomics reveals a significant bias toward alternative protein isoforms with conserved structure and function. Mol Biol Evol. 2012; 29(9):2265–83.https://doi.org/10.1093/molbev/mss100PMID:22446687.
20. Severing EI, van Dijk AD, Stiekema WJ, van Ham RC. Comparative analysis indicates that alternative splicing in plants has a limited role in functional expansion of the proteome. BMC genomics. 2009; 10:154.https://doi.org/10.1186/1471-2164-10-154PMID:19358722.
21. Lewis BP, Green RE, Brenner SE. Evidence for the widespread coupling of alternative splicing and non-sense-mediated mRNA decay in humans. Proc Natl Acad Sci U S A. 2003; 100(1):189–92.https://doi. org/10.1073/pnas.0136770100PMID:12502788.
22. McGlincy NJ, Smith CWJ. Alternative splicing resulting in nonsense-mediated mRNA decay: what is the meaning of nonsense? Trends in Biochemical Sciences. 2008; 33(8):385–93.https://doi.org/10.1016/j. tibs.2008.06.001PMID:18621535
23. Staiger D, Brown JW. Alternative splicing at the intersection of biological timing, development, and stress responses. Plant Cell. 2013; 25(10):3640–56.https://doi.org/10.1105/tpc.113.113803PMID:
24179132.
24. Filichkin S, Priest HD, Megraw M, Mockler TC. Alternative splicing in plants: directing traffic at the cross-roads of adaptation and environmental stress. Current opinion in plant biology. 2015; 24:125–35.
https://doi.org/10.1016/j.pbi.2015.02.008PMID:25835141.
25. Ding F, Cui P, Wang Z, Zhang S, Ali S, Xiong L. Genome-wide analysis of alternative splicing of pre-mRNA under salt stress in Arabidopsis. BMC genomics. 2014; 15:431. https://doi.org/10.1186/1471-2164-15-431PMID:24897929.
26. Feng J, Li J, Gao Z, Lu Y, Yu J, Zheng Q, et al. SKIP Confers Osmotic Tolerance during Salt Stress by Controlling Alternative Gene Splicing in Arabidopsis. Mol Plant. 2015; 8(7):1038–52.https://doi.org/10. 1016/j.molp.2015.01.011PMID:25617718.
27. Thatcher SR, Danilevskaya ON, Meng X, Beatty M, Zastrow-Hayes G, Harris C, et al. Genome-Wide Analysis of Alternative Splicing during Development and Drought Stress in Maize. Plant Physiol. 2016; 170(1):586–99.https://doi.org/10.1104/pp.15.01267PMID:26582726.
28. Yang S, Tang F, Zhu H. Alternative splicing in plant immunity. Int J Mol Sci. 2014; 15(6):10424–45.
https://doi.org/10.3390/ijms150610424PMID:24918296.
29. Meyer RS, DuVal AE, Jensen HR. Patterns and processes in crop domestication: an historical review and quantitative analysis of 203 global food crops. New Phytol. 2012; 196(1):29–48.https://doi.org/10. 1111/j.1469-8137.2012.04253.xPMID:22889076.
30. Glemin S, Bataillon T. A comparative view of the evolution of grasses under domestication. New Phytol. 2009; 183(2):273–90.https://doi.org/10.1111/j.1469-8137.2009.02884.xPMID:19515223.
31. Olsen KM, Wendel JF. Crop plants as models for understanding plant adaptation and diversification. Front Plant Sci. 2013; 4:290.https://doi.org/10.3389/fpls.2013.00290PMID:23914199.
32. Hufford MB, Xu X, van Heerwaarden J, Pyhajarvi T, Chia JM, Cartwright RA, et al. Comparative popula-tion genomics of maize domesticapopula-tion and improvement. Nature genetics. 2012; 44(7):808–11.https:// doi.org/10.1038/ng.2309PMID:22660546.
33. Swanson-Wagner R, Briskine R, Schaefer R, Hufford MB, Ross-Ibarra J, Myers CL, et al. Reshaping of the maize transcriptome by domestication. Proc Natl Acad Sci U S A. 2012; 109(29):11878–83.https:// doi.org/10.1073/pnas.1201961109PMID:22753482.
34. Bao Y, Hu G, Flagel LE, Salmon A, Bezanilla M, Paterson AH, et al. Parallel up-regulation of the profilin gene family following independent domestication of diploid and allopolyploid cotton (Gossypium). Proc Natl Acad Sci U S A. 2011; 108(52):21152–7.https://doi.org/10.1073/pnas.1115926109PMID:
22160709.
35. Koenig D, Jimenez-Gomez JM, Kimura S, Fulop D, Chitwood DH, Headland LR, et al. Comparative transcriptomics reveals patterns of selection in domesticated and wild tomato. Proc Natl Acad Sci U S A. 2013; 110(28):E2655–62.https://doi.org/10.1073/pnas.1309606110PMID:23803858.
36. Bellucci E, Bitocchi E, Ferrarini A, Benazzo A, Biagetti E, Klie S, et al. Decreased Nucleotide and Expression Diversity and Modified Coexpression Patterns Characterize Domestication in the Common Bean. Plant Cell. 2014; 26(5):1901–12.https://doi.org/10.1105/tpc.114.124040PMID:24850850.
37. Zou H, Tzarfati R, Hubner S, Krugman T, Fahima T, Abbo S, et al. Transcriptome profiling of wheat glumes in wild emmer, hulled landraces and modern cultivars. BMC genomics. 2015; 16:777.https:// doi.org/10.1186/s12864-015-1996-0PMID:26462652.
38. Rapp RA, Haigler CH, Flagel L, Hovav RH, Udall JA, Wendel JF. Gene expression in developing fibres of Upland cotton (Gossypium hirsutum L.) was massively altered by domestication. BMC Biol. 2010; 8:139.https://doi.org/10.1186/1741-7007-8-139PMID:21078138.
39. Huang J, Gao Y, Jia H, Liu L, Zhang D, Zhang Z. Comparative transcriptomics uncovers alternative splicing changes and signatures of selection from maize improvement. BMC genomics. 2015; 16:363.
https://doi.org/10.1186/s12864-015-1582-5PMID:25952680.
40. Frere CH, Prentis PJ, Gilding EK, Mudge AM, Cruickshank A, Godwin ID. Lack of low frequency vari-ants masks patterns of non-neutral evolution following domestication. PLoS One. 2011; 6(8):e23041.
https://doi.org/10.1371/journal.pone.0023041PMID:21853065.
41. Paterson AH, Bowers JE, Bruggmann R, Dubchak I, Grimwood J, Gundlach H, et al. The Sorghum bicolor genome and the diversification of grasses. Nature. 2009; 457(7229):551–6.https://doi.org/10. 1038/nature07723PMID:19189423.
42. Muraya MM, Mutegi E, Geiger HH, de Villiers SM, Sagnard F, Kanyenji BM, et al. Wild sorghum from dif-ferent eco-geographic regions of Kenya display a mixed mating system. Theor Appl Genet. 2011; 122 (8):1631–9.https://doi.org/10.1007/s00122-011-1560-5PMID:21360157.
43. Mutegi E, Sagnard F, Labuschagne M, Herselman L, Semagn K, Deu M, et al. Local scale patterns of gene flow and genetic diversity in a crop-wild-weedy complex of sorghum (Sorghum bicolor (L.) Moench) under traditional agricultural field conditions in Kenya. CONSERVATION GENETICS. 2012; 13(4):1059–71.https://doi.org/10.1007/s10592-012-0353-y
44. Sagnard F, Deu M, Dembele D, Leblois R, Toure L, Diakite M, et al. Genetic diversity, structure, gene flow and evolutionary relationships within the Sorghum bicolor wild-weedy-crop complex in a western African region. Theor Appl Genet. 2011; 123(7):1231–46.https://doi.org/10.1007/s00122-011-1662-0
PMID:21811819.
45. Mutegi E, Sagnard F, Muraya M, Kanyenji B, Rono B, Mwongera C, et al. Ecogeographical distribution of wild, weedy and cultivated Sorghum bicolor (L.) Moench in Kenya: implications for conservation and crop-to-wild gene flow. Genetic Resources and Crop Evolution. 2010; 57(2):243–53.
46. Lin Z, Li X, Shannon LM, Yeh CT, Wang ML, Bai G, et al. Parallel domestication of the Shattering1 genes in cereals. Nature genetics. 2012; 44(6):720–4.https://doi.org/10.1038/ng.2281PMID:
22581231.
47. Barro-Kondombo C, Sagnard F, Chantereau J, Deu M, Vom Brocke K, Durand P, et al. Genetic struc-ture among sorghum landraces as revealed by morphological variation and microsatellite markers in three agroclimatic regions of Burkina Faso. Theor Appl Genet. 2010; 120(8):1511–23.https://doi.org/ 10.1007/s00122-010-1272-2PMID:20180097.
48. Hamblin MT, Casa AM, Sun H, Murray SC, Paterson AH, Aquadro CF, et al. Challenges of detecting directional selection after a bottleneck: lessons from Sorghum bicolor. Genetics. 2006; 173(2):953–64.
https://doi.org/10.1534/genetics.105.054312PMID:16547110.
49. Mace ES, Tai S, Gilding EK, Li Y, Prentis PJ, Bian L, et al. Whole-genome sequencing reveals untapped genetic potential in Africa’s indigenous cereal crop sorghum. Nat Commun. 2013; 4:2320.https://doi. org/10.1038/ncomms3320PMID:23982223.
50. Sarah G, Homa F, Pointet S, Contreras S, Sabot F, Nabholz B, et al. A large set of 26 new reference transcriptomes dedicated to comparative population genomics in crops and wild relatives. Mol Ecol Resour. 2016.https://doi.org/10.1111/1755-0998.12587PMID:27487989.