Continuous improvement of occupational safety performance in
aerospace production systems through collaborative automation
by
Guillermo Pamanes Castillo
B.S. Mechanical Engineering, Instituto Tecnologico y de estudios superiores de Monterrey, 2010
Submitted to the Department of Mechanical Engineering and the MIT Sloan School of Management in partial fulfillment of the requirements for the degrees of Master of Science in Mechanical Engineering and Master of Business Administration in conjunction with the Leaders
for Global Operations Program at the
MASSACHUSETTS INSTITUTE OF TECHNOLOGY June 2016
C 2016 Guillermo Pamanes. All rights reserved.
The author herby grants MIT permission to reproduce and to distribute publicly copies of this thesis document in whole or in part in any medium now know or hereafter created.
Signature redacted
A u th o r ...
... ...
Department of Mechanical Engineering and the MIT Sloan School of Management , . en. May 8, 2016 Certified by...
Signature redacted
...
Alberto Rodriguez, Thesis Reader Assistant Professor, Department o#Nechanical Engi/eering
Certified by...Signature
redacted...
Certified
Approve
b.
Julj|'A. Shah, Thesis Supervisor
Assistant Professor, Department of Aeronautics and Astronautics Comnuter-p&nce and Artificial Intellieence Laboratory
Signature redacted
y...
...
Thomas Roemer, Thesis Supervisor Senior Lecturer, MIT Sloan School of Management and Executive Director Leaders for Global Operations Program
dby...Signature
redacted
Approved by... MA TEJUN
022016
-Lu
.&han Abeyaratne Chairman, Committ e on Graduate StudentsSignature redacted
U Maura Herson
Director of MBA Program MIT Sloan School of Management
Continuous improvement of occupational safety performance in
aerospace production systems through collaborative automation
by
Guillermo Pamanes Castillo
Submitted to the Department of Mechanical Engineering and the MIT Sloan School of Management on May 8, 2016 in partial fulfillment of the requirements for the degrees of Master
of Science in Mechanical Engineering and Master of Business Administration
Abstract
Employee health and safety are a top priority in aerospace manufacturing. As companies increase their production systems capacity in preparation for upcoming rate targets, new opportunities for continuous improvement start becoming evident and time critical. A strong collaboration of Health and Safety, Quality, Manufacturing and Research and Technology groups is paramount to ensure that adequate technologies are developed and deployed in the right stages of the manufacturing system in a way that is compliant with both technology readiness and the business needs.
The integration of collaborative automation on ergo-motivated continuous improvement projects pose two major challenges in this aerospace manufacturing process. Firstly, the availability of resources to measure the current state, i.e. the identification and prioritization of the sub-steps and specific tasks in the process that require technological intervention. Secondly, the potential incompatibility of production systems, continuous improvement and technology development road maps that limit the speed at which new technologies flow to the shop floor.
By leveraging the existence of historical safety performance and labor-tracking data, the proposed methodology offers an immediate approximation of occupational risk of the current state. This allows a "first gate" deliverable for any given continuous improvement project for the Occupational Health and Safety group with minimal use of resources, a framework for the R&D organizations to create and prioritize ergonomically-driven projects and ultimately complement business cases to propel technologies towards final deployment.
The methodology results in a statistical risk profile that highlights the manual sub-steps of a product line that show better candidacy for collaborative automation. Continuous improvement and conventional Lean/Six Sigma tools where furthermore applied to demonstrate process capability and move a collaborative robot through the production system implementation roadmap in record timing.
Thesis Supervisor: Julie A. Shah
Title: Assistant Professor Department of Aeronautics and Astronautics Computer Science and Artificial Intelligence Laboratory
Thesis Supervisor: Thomas Roemer
Title: Senior Lecturer, MIT Sloan School of Management and Executive Director, Leaders for Global Operations Program.
Acknowledgments
I would first like to thank The Boeing Company for their sponsorship and support of this project as well as their dedication to the LGO program. I would also like to thank everyone at Boeing Aerostructures Australia infinitely for hosting my internship and providing support every day. Special thanks to Mike Dickinson and Mike Suveges for their mentorship and guidance, Paul Watson, David Pook, Dominic Wierzbicki, Vlado Tasevski, Kelly Yung, Kenneth Robinson, Jeanette Collier, Andrew McConville, Tim Allen, Clyde Wright and everyone else I approached for help, thank you all for your patience, commitment and generosity. I would also like to thank my MIT faculty advisors, Professors Thomas Roemer and Julie Shah for sharing their wisdom and providing guidance on this thesis.
I would also like to take this opportunity to dedicate this work to my family: Maricela I. Castillo,
Guillermo E. Pdmanes and Natalia Pimanes, for their unconditional love and support
Table of contents
Abstract...3
Acknow ledgm ents ... 5
Table of contents ... 6
Chapter 1: Introduction...11
1.1 A brief w alk through the history of airplane m anufacturing... 11
1.2 Airframe manufacturing forecasts and strategies in the 21st Century...14
1.3 Boeing Aerostructures Australia... 16
1.4 Productivity and Safety in the W orkplace... 19
1.5 Identifying the problem : safety perform ance baseline ... 22
1.6 Overview of H ypotheses, A pproach and M ethodology ... 23
1.7
Sum m ary ... 251.8
Chapter1
references ... 26Chapter 2: Literature review on economics, ergonomics and risk assessment tools ... 29
2.1 Occupational health and safety in the aerospace industry ... 29
2.2 Finding the economic optimal point and the importance of risk assessments ... 31
2.3 H um an body as a m achine-biom echanical m odels... 36
2.4 Risk assessm ent form s...37
2.5 Chapter 2 sum m ary ... 41
2.6 Chapter 2 appendix ... 43
2.7 Chapter 2 references ... 44
Chapter 3: Rough order of magnitude risk profile for manual tasks in wingbox assembly...46
3.1 Epidem iological study approach... 46
3.2 Composite wingbox manufacturing for flight control elements...48
3.3 Benchmarking the Rough Order of Magnitude Budget Estimate for model acceptability .55 3.4 Rough O rder of M agnitude Risk Profile... 56
3.5 Creation and evolution of the m odel ... 61
3.6 Data analysis...65
3.7 Confidence intervals by production line and by activity ... 75
3.8 Conclusions...81
3.9 Recom m endations...84
Chapter 4: Continuous im provem ent and collaborative robots... 86
4.1 The history of autom ation and collaborative robots... 86
4.2 Capabilities and lim itations of collaborative robots ... 89
4.3 The importance of continuous improvement for commercial aerospace manufacturers.... 91
4.4 Penetration of robotics in aircraft m anufacturing ... 93
4.5 Continuous im provem ent...96
4.6 Sum m ary ... 97
4.7 Chapter 4 references ... 97
Chapter 5: PDCA using a collaborative robot...101
5.1 Continuous im provem ent in aerospace...101
5.2 Continuous improvement roadmaps in the aerospace industry ... 103
5.3 Identifying the problem and studying the current situation...106
5.4 Finding the root causes and choosing the solution...108
5.5 Developing the action plan...108
5.6 Fundamentals of stem machining analysis and requirements development (Step 1) ... 109
5.7 Blind fastener input height variability ... 113
5.8 Input-Process-Output energy diagram for machining with a collaborative robot (Step 3) ... 1 1 5 5.9 Design of experim ents (Step 4) ... 116
5.10 Experim ent...119
5.11 Experim ent results ... 120
5.12 Process m odel (Step 5)...124
5.13 Param eter optim ization (Step 6) ... 125
5.14 Param eter optim ization and Cpk Calculation (Step 7)...126
5.15 Checking results...133
5.16 Chapter 5 appendix ... 135
5.17 Chapter 5 references ... 136
Chapter 6: Implementation and sustaining performance for collaborative robot...139
6.1 Establishing reliable m ethods ... 139
6.2 Continuously im proving products and processes ... 140
6.3 Further continuous im provem ent on ergonom ics ... 143
6.4 Conclusions...145
List of figures
Figure 1-1: Com m ercial aviation dem and forecast [15]... 15
Figure 1-2: M arket-share by com pany [16] [17]... 15
Figure 1-3: Price sum m ary [18], [19]... 15
Figure 1-4: Orders by com pany [17] [16]... 16
Figure 1-5 787 m oveable trailing edge ... 17
Figure 1-6: 777 elevator and rudder ... 18
Figure 1-7: 737 ailerons...18
Figure 1-8: 747 m oveable leading edge... 18
Figure 1-9: Boeing deliveries and employment forecasted for 2022[16] [24]...19
Figure 1-10: Estim ated productivity to m aintain m arket share... 19
Figure 1-11 [25]: TCR Aerospace vs. M anufacturing sector ... 20
Figure 2-1: Comparison of TCR for aircraft assembly companies and aircraft parts fabrication [1] ... 3 0 Figure 2-2: TCR comparison of the commercial aircraft supply chain and the manufacturing sector in the US [1]...30
Figure 2-3: Optim al level of autom ation [10]... 33
Figure 2-4: OSH A w orskite analysis plan... 39
Figure 2-5: Probability and severity ranks [23]...40
Figure 2-6: European OSH A Risk Assessm ent [23]...41
Figure 3-1: Cohort study [2]...47
Figure 3-2: Risk factors classification in epidem iological studies [4] ... 47
Figure 3-3: Ailerons...49
Figure 3-4: Rudder location ... 49
Figure 3-5: Elevator location...50
Figure 3-6: Flaps [9]...50
Figure 3-7: W ingbox elem ents [10]... 51
Figure 3-8: Planned labor-hours for flight control elem ents assem bly ... 51
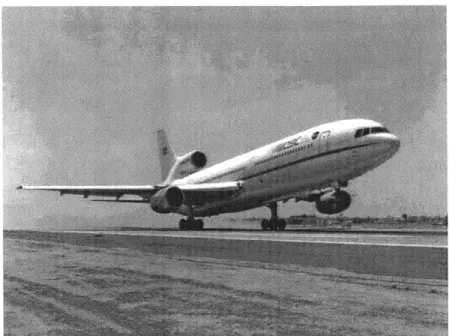
Figure 3-9: Lockheed L-1011 [11]...52
Figure 3-10 [12] Aileron assem bly ... 53
Figure 3-11: Process flow diagram ... 53
Figure 3-12 Com posite aileron cost sum mary [12]... 55
Figure 3-13: Incidents by root-cause... 56
Figure 3-14 NCR vs incident reports ... 57
Figure 3-15: Labor data extract...58
Figure 3-16: Equation 3.1 applied across em ployee IDs ... 59
Figure 3-17: TAR calculated across activities ... 60
Figure 3-18: Linear regression...60
Figure 3-19 Non-linear m odel regression... 61
Figure 3-20: Em ployee labor tracking variability ... 62
Figure 3-21: Daily average of labor-hours reported per em ployee... 63
Figure 3-23: Confidence interval for daily average... 64
Figure 3-24: Labor-hours extract...65
Figure 3-25: Venn diagram ... 66
Figure 3-26 Activity category allocation... 67
Figure 3-27: M odel regression input array ... 67
Figure 3-28: First m odel (m=11, i=133, 1=2) ... 69
Figure 3-29: Param eter screening...70
Figure 3-30: Regression m odel ( m =11, i=30, 1=1) ... 70
Figure 3-31: Regression model after screening non-significant parameters...71
Figure 3-32: Regression m odel w ith screened param eters... 71
Figure 3-33: Multilinear regression with 85 samples (j=85, 1=4, mi=1 7)... 72
Figure 3-34: M odel test...73
Figure 3-35: 85-sam ple m odel com parison... 74
Figure 3-36: M ulti-linear regression using 96 sam ples. ... 74
Figure 3-37: Confidence interval for TRR ... 75
Figure 3-38: RO M risk profile for production line A ... 76
Figure 3-39: N om inal ROM for production line A ... 77
Figure 3-40: Activities raked by risk rate... 77
Figure 3-41: N om inal RO M for production line B...78
Figure 3-42: Production Line D risk profile... 79
Figure 3-43: N om inal RO M risk profile for production line D ... 80
Figure 3-44: Activities raked by risk rate... 81
Figure 3-45: Example of ROM risk assessment for current state applied to the workstation level ... 8 2 Figure 3-46: RO M reduction of TRR...83
Figure 3-47: Confidence intervals for each category ... 84
Figure 4-1: W orldw ide sales of industrial robots[33]... 94
Figure 4-2: Industrial robots: estimated operational stock by continent... 94
Figure 4-3 : Estim ated annual supply of industrial robots... 95
Figure 5-1: Theoretical breakthrough im provem ent...102
Figure 5-2: Real trend after a breakthrough im provem ent [...103
Figure 5-3: The PDCA Cycle...103
Figure 5-4 [4]: Figure 1.0.1 from Dl-9000...104
Figure 5-5: Figure 1.0.1.2 from D1-9000 Basic Problem-Solving Flow...105
Figure 5-6: RO M statistical risk profile for Production Line A ... 106
Figure 5-7: Stage 3 ROM ... 107
Figure 5-8:: Future state...107
Figure 5-9: Figure 1.0.2.3 from D1-9000 ... 109
Figure 5-10: Flush fasteners ... 110
Figure 5-11: Blind fasteners ... 110
Figure 5-12: Installation of blind fasteners ... 111
Figure 5-13: Steam break...111
Figure 5-14: H orizontal slab m illing...111
Figure 5-15: Stem height run chart ... 113
Figure 5-16: N orm al probability plot ... 114
Figure 5-17: X-bar chart for stem heights w ith sam ple size 4...114
Figure 5-19: IPO diagram for stem m achining...116
Figure 5-20: D esign of Experim ents...116
Figure 5-21: Test coupon ... 117
Figure 5-22: Stem height comparison between production part and coupon ... 117
Figure 5-23: D istribution of stem heights ... 118
Figure 5-24: D istribution of stem heights ... 118
Figure 5-25: Test sequence...120
Figure 5-26: Flushness results...120
Figure 5-27: H istogram s for Test Blocks 1.1 and 1.2 ... 122
Figure 5-28: M edian test for tool shift ... 122
Figure 5-29: M edian test...123
Figure 5-30: Regression m odel
1
... 124Figure 5-31: Regression m odel for linear m aterial rem oval...125
Figure 5-32: Regression m odel for variance ... 126
Figure 5-33: First sim ulation...127
Figure 5-34: Cutting tool analysis ... 128
Fig 5-35: Tool w ear...129
Fig 5-36: Cut tim e vs chip thickness ... 129
Fig 5-37: Cum ulative sum s for 144 runs ... 131
Fig 5-38: M aterial rem oval trend (effect) per test setting ... 131
Fig 5-39: Sim ulation 2...132
Fig 5-40: Sim ulation run 3...133
Figure 5-41: Final sim ulation...133
Figure 6-1: A ccuracy to tolerance ratio for inspection tools...139
Figure 6-2: D efect concentration diagram ... 140
Figure 6-3: Risk A nalysis tem plate ... 141
Chapter 1: Introduction
The following thesis has the objective of helping to improve ergonomics with the use of collaborative automation. A brief walk through the main checkpoints in the history of airplane manufacturing will reveal the political, social, technological antecedents that gave birth to the current state of commercial aircraft factory architecture and operation modes. Reviewing this history is also crucial to understand the challenges regarding occupational safety and deployment of automation faced by the airplane manufacturers. This thesis proposes an innovative approach to identify ergonomic risks and implement collaborative automation. In a broader sense, it helps to demonstrate how breakthrough technologies can be implemented using continuous improvement roadmaps to sustain performance in a world-class production system.
1.1 A brief walk through the history of airplane manufacturing
The Machine that Changed the World outlines how the assembly lines designed by Henry Ford achieved the standardization of work and implementation of moving lines resulting in unprecedented productivity performance[l]. However, as it will be described in Chapter 2 of this thesis, standard work and task dilution may increase ergonomic risk due to repetitive motions performed in extended periods of time. Although standard work helps to unveil root causes for quality defects, it also causes ergonomically risky tasks to worsen because of the increase in repetition. While quality defects can be reworked, injuries shall not be tolerated and must be prevented.
Airplanes and automobiles are common in that the first concepts were not engineered to be mass produced. Most of the funding for the earliest models was consumed to build functional prototypes that only intended to meet functional requirements. Such was the case for the first piloted unit assembled by the Wright Brothers in 1903 [1] and all automobiles before the Model T. The Wright Brothers Company provided the first Model A to the army at a price of $25,000 for several years. At that time, the Wright Brothers only faced competition from Curtiss Aeroplane Company who were capable of offering an airplane that traveled at a speed record of 47 miles per hour. The price-tag for this aircraft was only $5,000, which lead Curtis to become the largest aircraft producer in the US by 1914 [2].
Aircraft design and production soared to above 200,000 units for the first time in WWI [3]. It was not until then when in California, under the name of the Glenn A. Martin Company, a third major competitor emerged. Although the primary focus in airplane development was targeted to military applications including fighting scouts, night bombing, night fighting and ground attack, non-military applications existed as well and the public had the possibility of buying the airplanes they saw at racing events [2].
While there is limited information that describes the detailed conditions the employees worked in at these 3 companies, it should not be hard to imagine that although very limited amount of technologies were in place to make the production systems more efficient, there must have been extraordinary efforts to put assembly lines in place to transit from the 49 total airplanes delivered
By 1917 the demand for aircraft produced in the US was already of the order of thousands. Evidence of that is provided in in the cable received during the war by President Wilson Woodrow, where tens of thousands of units were being requested by the French Government [4]. In these times the aerospace industry was.just emerging and airplane designs were not yet suited for mass production, it is easy to picture that building airplanes was craftsmanship-reliant. To mitigate the craftsmanship dependency Britain introduced a system of "dilution" as the war itself demanded for growing production volumes. This marks the beginning of the simplification of tasks that were more suitable for unskilled workers [4].
Another example of early attempts to ramp up aircraft production is the Aeronautical Mission led by Major Raynal in 1917. The main objective was to study European airplane designs to see which ones could be adopted and produced in the US in cooperation with the European manufacturers, since the European air forces counted for only a few hundred units at that time [5]. The final recommendation made by Raynal was to support the Allied manufacturers with raw materials, instead of launching a huge program in the US which would have been costly to ramp up. The recommendation also included a handful of specific European aircraft designs that could have been built in the US. The only model that was successfully delivered by the US following this premise was the DH-4 [5]. An important note is that the objectives of this program drove President Wilson Woodrow's administration to question if planes could be mass produced as cars or bicycles. A big caveat was that the mass production systems pioneered by Hendry Ford relied on standardized product configurations [4].
During WWI, the airframe production in Europe was already outnumbering the engine manufacturing, mainly because airframe production emerged before the need of improved reconnaissance operations during WWI. The Rumpler Taube Monoplane was the first military aircraft that was mass produced [6] and was equipped with a piston power plant ranging from 70 to 120 hp, 2 seats and steel frame fuselage; about 500 units of this model were produced in Germany[6].
Towards WWII the US engaged in one of the biggest industrial efforts in history. Aircraft manufacturing passed from being in the 41st place to lead the chart of industries in the US in less than 5 years. By 1939, the total of military aircraft production barely reached 3,000 units, by the end of the war the US had produced 300,000 [7].
The P51 Mustang is a valuable case study from WWII for the purpose of this thesis. The Royal Airforce (RAF) approached to Curtis, that had merged in 1929 with the Wright Company, with the request to build 300 P-40 Warhawks. Curtis originally turned the request down because of the lack of factory capacity. The British turned to North American Aviation, whose company president made an innovative counter-proposal: to design and deliver an entirely new airplane using cutting edge technologies, since they knew that the P-40 fell short in maneuverability. This came with the implication of putting a whole new production system in place. Astonishingly
North America Aviation provided the first prototype in less than 120 days [8].
Another example to consider is the B-24 heavy bomber program for which the Ford Motor Company had created a production line that closely resembled those used for cars. The Willow
adaptation from an automotive environment to airframe assembly operations, but it was always remarkable for their high production rates [9].
To satisfy the demand of aircraft during WWII, factories were running 24 hours 7 days a week, employing a total of 2.1 million workers, female representation was in order of tens of thousands. The Ford Motor Company delivered more than 5,400 B-24 bombers produced in their Michigan factory. The Douglass Aircraft company was producing C-47s every 5 hours. In total by 1944 there were 15 airframe manufacturers producing 23 different types of combat airplanes in the US. To achieve this, automobile manufacturers were brought into play through licenses and sub-contracts. The most innovative stage of airframe manufacturing happened in this period of time where "job shops" were transformed into full production lines requiring less skilled workforce. This demanded a great standardization of parts and processes to overcome the complexity of the
products. To provide an example, the nose section of the Boeing B-29 by itself bomber required
more than 50,000 rivets and 8,000 different parts brought in from more than 1500 suppliers [10]. The war defined the basis of the 21st century major aircraft manufacturers, that would be focusing primarily on airplane development, major assemblies and systems integration [10].
The military technologies developed during WWII permeated the aircraft developed and built on the eve of the Cold War era, built in lower volumes, but unprecedented complexity of systems integration. Boeing focused its resources on building long-range strategic bombers such as the B-47 (produced 2,000 units) and large commercial aircraft, such as the B-52 and the 707 (total of 878 units produced) on a tight competition with the DC-8. These technologies also prompted the specialization of companies on specific technologies such as the turbojet engine. Aircraft manufacturers focused on developing airframes for higher speeds and altitudes to be coupled with major advancements such as turbojet propulsion [11].
Airbus was born in the late 1960s and thrived to become a competitor to the major US commercial manufacturers: Boeing, McDonell Douglass and LockheedThe 1950s and 1960s set a foundation to the product portfolio that exists nowadays, giving birth to the 737, DC-9 and the new wide bodies like the 747, the DC-10 and L-1011 Tristar [11].
The beginning of the decade of the 1970s witnessed a substantial decrease in demand caused in great part by the Gulf oil crisis. The total volume of aircraft production did not surpass 400 units per annum. In fact, the average units shipped per years according to the Bureau of Labor Statistics struggled to surpass the 1500 units within the period of 1972 to 1991 [12]. However, this is a long term average that hides years where orders peaked.
By the beginning of the 1980s air travel was forecasted to grow at a rate of 6.6% per year and record orders for commercial air carriers was achieved in 1978 [12]. Boeing approached the Japanese manufacturing systems on a study mission performed by John Black in an effort to streamline their manufacturing capabilities and ensure that these order records would be fulfilled on time and on budget [13].
John Black describes the aerospace industry to be in an upward-slope, while Boeing was beginning the longstanding efforts to improve the quality of their products, productivity and quality of work life. A result of this effort were the innovative employee involvement initiatives
implemented in 1978, referred to as "Productivity Circles", which set the foundations and the means to ensure a successful journey towards a just-in-time production system. The 757 program is evidence of the benefits that resulted from these Productivity Circles that Black describes in Lean Production "Implementing a World Class System". The 757 not only achieved its maiden flight on time and on budget during in 1982, but furthermore pioneered the introduction of statistical process control, lean manufacturing and continuous improvement. [12].
A study made by the Bureau of Labor Statistics shows that the aircraft production productivity in the US increased 3.8 percent annually from 1973 to 1979 and just 0.3 percent annually from 1979 to 1990 [14]. The study itself describes the conditions of aircraft factories during these years being not so different from what can be seen today: "power drills, wrenches, flashlights, screwdrivers.. .workers standing on scaffolds, crouching under, sitting inside the aircraft.. .etc." The decrease in productivity of the later period was mainly because demand decreased unexpectedly while labour in this industry posed risks to be downsized. This report also remarks: "One of the ironies about the aircraft industry is that while it makes a high-tech product, it does not rely heavily on high technologi for aircraft assembly" [14].
Attempts to invest in automation can be found since the early 1980s, but even for the most repetitive tasks, the business cases were hindered by the low volumes, uncertainty of demand, complexity and the levels of customization the customers demanded on top of the high costs of automation. In consequence, the technological options to reduce labor in aircraft assembly were limited world-wide. Since 1990, wing drilling and riveting, and milling in some fabricated components were some of the applications that benefited from certain levels of automation, such as numerically controlled machines [13]. Nevertheless, manual tools operated by highly skilled workforce has been an on-going element of the aerospace production systems.
In summary, the most evident periods of productivity increase in the aircraft industry are the war years and the 1980s, and the main takeaways regarding airframe production systems design and performance improvement are:
1) There were consistent efforts to approach the American automobile industry to facilitate capacity increase in aircraft assembly factories during the war periods
2) The Japanese manufacturing cultures were consulted to benchmark methodologies for productivity improvement
3) The search for opportunities to use robots to reduce labour began during the 1980s and 1990s. 1.2 Airframe manufacturing forecasts and strategies in the 21st Century
Section 1.1 provided general information on production volumes and workforce throughout the history of airframe manufacturing. This section summarizes the same information for the commercial aviation segment in the upcoming decades.
The passenger airlines are split into four categories according to the US department of Transportation. The biggest airplane category in revenue is the "international" category that employs small, medium and large wide body airplanes with more than 130 seats. Companies in
I
is then "national", utilizing small single aisle airplanes that can accomirimodate between 100 and 150 passengers providing revenues that range from 100 million to 1 billion USD. Thirdly the "regional" segment that cover short-haul flights with regional jets with less than $100 million of revenue per year.
In line with these classifications, the forecasted demand for new airplanes is provided by size for the next 20 years in Figure 1-1.
Figure 1-1: Commercial aviation demand forecast [15] Demand by size 2015 to 2034
New Airplanes Value ($B)
Large widebody 540 230 Medium widebody 3,520 1,220 Small widebody 4,770 1,250 Single aisle 26,730 2,770 Regional jets 2,490 100 Total 38,050 5,570
Figure 1-2 depicts the panorama of the com petition of the two companies Boeing and Airbus.
Figure 1-2: Market-share by company [16] [17]
Market Share by Company
90%111 10% 40% B.' ICI II. 'U Ii. 0.' XU RR IN' al
w112
U' U' U. U.' Clw
U-0 ClM;i
z Cl ClI
C'jdominating the market,
CI '-4 Cl Cl
8
ClC
Cl I.) I.' In% Share Air bus 0 %Share Boeing
Although Airbus market share has been declining and Boeing has been leading deliveries in the last few years, the commercial airliners price summary (Fig. 1-3) reveals that Airbus prices are more competitive than Boeing in comparable models. The differences in list prices and current order backlog orders (Figure 1-4) creates incentives for Boeing to reduce its cost structure.
15
-w-Ia
X
W
Figure 1-3: Price summary [15], [16]
List
prices by model
450 15)1-400 150 100 50 ModelFigure 1-4: Orders by com pany [17] [181 Orders by c('nsptny
A common strategy for both companies is the transition to become more vertically integrated[19]. The National Bureau of Economic Research explains that the relationship between downstream producers and suppliers is more likely to be vertically integrated when the industry is technologically intensive, and the effect is stronger when the suppliers represent large fractions of the producer's costs. This is the business environment under which Boeing Aerostructures Australia existed and where the research activities for this thesis took place.
1.3 Boeing Aerostructures Australia
Australia has played a key role in aerospace manufacturing since the early 20, century. In 1936 the Commonwealth Aircraft Corporation (CAC) was created to focus on the first mass produced aircraft in Australia, the NA-16 general purpose and trainer. This airplane was engineered by
ECORENrn . m _-1000mm
North American Aviation and shared with CAC through a license agreement for 755 units to support the allied fleets. The agreement permitted CAC to modify the engineering design of the NA-16 to meet RAF requirements but furthermore conceived the aerospace industry first industrial establishment in Australia. This aircraft was named the Wirraway, which translates to "challenge" in aboriginal language. The airplane was used for tactical reconnaissance, target marking, supply dropping, dive bombing, army support and, on occasions, as an interceptor fighter [201.
Commonwealth Aircraft Corporation (CAC), which had been in partnership with North American Aviation since the years following the Second World War, was acquired in 1986 by Hawker de Havilland Australia.
Also, Government Aircraft Factories (GAF) established operations during the Second World War (originally as the Department of Aircraft Production) to assemble Bristol Beauforts and Beaufighters. GAF eventually became AeroSpace Technologies of Australia (ASTA) in 1987; this event marks an acknowledgeable root of Boeing's footprint in Australia [20].
In 1996 Boeing acquired North American and ASTA. In 2000 Boeing also acquired Hawker de Havilland and merged Australian entities under this name. Boeing renamed this subsidiary to Boeing Aerostructures Australia to emphasize the importance of its role in Boeing's Vertical Integration strategy in 2009. Up until then, BAA was a major exporter of components for Boeing,
Airbus, Lockheed Martin, Bombardier and other Airplane manufacturers [201.
Boeing Aerostructures Australia (BAA) became the largest manufacturing footprint of The Boeing Company outside of the United States and specializes in designing, developing, testing and manufacturing flight control surfaces [221. As for 2015, BAA has in-house capabilities of design and analysis, materials and process technology, testing, structural bonding, resin infusion, non-destructive testing, automated assembly and paint [21] to deliver the following set of products to Boeing Commercial Airplane Programs:
787 Moveable trailing edge components (Inboard Flap, Flaperon, Outboard Flap and Ailerons):
Figure 1-5: 787 Moveable trailing edge
787 Movable trailing edge
NJARD FLAP FLAPERON
* 777 Rudders, elevators and cove lip doors:
* 737 Ailerons
Figure 1-6: 777 elevator and rudder
777 Elevator and Rudder
Cove Lip DoorsRudder
Elevators
Figure 1-7: 737 ailerons [22]
Ailerons
* 747 Moveable leading edges
Figure 1-8: 747 Moveable leading edge [23]
747 Moveable leading edge
The site employs approximately 1200 people and has received significant investments in the last few years to increase capacity to meet production targets for the 787 Dream liner and will remain playing an important role as a subsidiary for sustaining the 777, 747 and 737 programs with their
BAA has demonstrated both organizational and operational capabilities to support the rate targets established by Commercial Airplanes, their main internal customer. Starting from delivering 5 ship sets of moveable trailing edges per month for the Dreamliner program, they have successfully reached the 12 ship sets per month line and expect to continue doing so to deliver 14 a month by 2020 [24]. In addition, the 737 line will be ramping up production from delivering 42 airplanes per month to 52 by 2018.[241
BAA combines design engineering, research and manufacturing to provide an exceptional environment for continuous improvement. Here researchers, engineers and front line workforce contribute organically to help place the Australian manufacturing industry to play key strategic roles in Boeing's global supply chain.
1.4 Productivity and Safety in the Workplace
Considering the increasing demand for new airplanes in the next 20 years (Figure 1-1) and assuming that Boeing's market share of 56% is kept (as of November-2015), a forecast for deliveries can be plotted as shown in Figure 1-5. Additionally, assuming an 11% decrease in employment for aerospace technicians as projected by US Bureau of Labor Statistics in 2022 [25],
a theoretical productivity ratio can be calculated for the upcoming years as shown in Fig 1-9. Figure 1-9: Boeing deliveries and employment forecasted for 2022[18] [25]
Boeing deliveries and emiployemni forecast
Forecast 1200 1400 120 6(0 2W0 (1
- Total employment aiicraft, engines and parts
-Boeing Deliveries
-IMarket share=56%
Figure 1-10: Estimated productivity to maintain market share Productivity
-4 Forecast
041
.. ..............
The productivity estimations based on the current forecasts suggest that all companies in the supply chain will have to produce more with the same workforce. As mentioned earlier, this need for productivity increase should signal the companies to mobilize industrial engineering innovation, automation and reinforce safety and ergonomic improvement programs.
With respect to safety and ergonomics Fig 1- 7 compares the performance of occupational health and safety in aerospace manufacturing in the US with the broader manufacturing sector. The Total Case Rate refers to the total injury reports of a given site, company or industry standardized in a basis of 100 full time employees. According to the reports from the Occupational Health and Safety Administration the TCR decreased by approximately 50% in the last 10 years for airframe manufacturers who have been also performing better than the manufacturing sector overall. Opportunities for improvement will have to be fostered as airframe manufacturers push the current threshold to a 0 case rate [261 while simultaneously increasing the size of production schedules. Improvements have to be made to bring the current production systems from the current occupational health and safety performance metrics to lower values while increasing productivity. Ergonomics and Productivity could become inversely proportional with inadequate implementation of standard work and moving lines.
Figure 1-11: TCR Aerospace vs. Manufacturing sector [26]:
TCR Aerospace vs Manufacuring
setor
The 757 productivity program is an example of the early efforts to increase production rates [13]
and reduce cycle times though the design and implementation of moving lines. These
manufacturing improvements are characterized by standardizing the statement of work for employees in the shop floor, moving them from performing several different tasks in parallel, to perform less tasks in a series of workstations. The tasks are designed based on the fundamental principle of standard work: performing simpler tasks, and mastering them with repetition to
increase productivity.
One of the immediate benefits of moving and pulsing lines is that quality defects become evident. As an employee performs the task more times in a day, problems become evident faster since more defects will be produced. Action teams are created and improvement plans are defined to tackle the root cause of defects.
Quality is not the only aspect impacted by moving lines. As mentioned previously occupational health and safety metrics are also affected the same way. If an employee on the previous example performs a task that is risky or that poses some degree of discomfort, there should be a concern that the increased repetition of the same tasks will yield more injuries in the moving line than in the previous manufacturing cells operating mode.
Every continuous improvement effort, for productivity, quality, or ergonomics starts with a quantitative measure of performance of the current state as recommended by the PDCA (Plan-Do-Check-Act cycle) methodology suggested from William E. Deming as the foundation of the kaizen culture [27]. Similarly, and according to experts in ergonomics, the first step for a
comprehensive ergonomic improvement program is to identify and measure ergonomic risk
across the operation and then to prioritize the channelling of resources towards safety improvement projects [28], [29], [30]. Having a prioritization method ensures that resources for improvement are applied efficiently.
1.5 Identifying the problem: safety performance baseline
As it will be described in Chapter 2 of this thesis, the study of the human body itself is a vast topic
of research, not only for the industry sector but also for athletes and consumer goods [31] [32].
Different tools are used to study the dynamic behaviour of the human body under different load conditions and postures. For example, using biomechanical modelling approaches using muscle fatigue models, musculoskeletal fatigue formulas would require vast expertise At the other end, simplified risk assessment forms and surveys, while easy to use for non-ergonomists, are prone to subjectivity and extensive and detailed observation of the entire manufacturing processes, tools and tasks [33].
To comply with company strategies that foster cost reduction, projects are created to increase productivity by standardizing statements of work, simplifying work schedules, implementing automation and pushing manufacturability into the airframe design. The Occupational Health and Safety departments hold a crucial stake in these project portfolios since they represent the interests of the shop floor employees. In order to make ergonomic improvements in the manufacturing environment, resources have to be prioritized to improve tools and processes. The most common framework to prioritize ergonomic improvement projects is observational risk assessments. These workplace risk assessments require exhaustive observation of the manufacturing process and often times are requested to be delivered with tight lead times. While biomechanical models could be perceived as better option against observational risk assessments, they require to bring in highly specialized professionals. Two main needs are identified therefore for a quick prioritization of ergonomic improvements in the workplace:
1) A methodology for calculating a risk baseline to prioritize ergonomic improvement projects
2) A quantitative evaluation framework that facilitates the quick measurement of risk at early stages of projects that are not targeted to improve ergonomics, but that would impact the statement of work of the technicians.
With limited resources to map out the current state of an entire manufacturing process, the proposed approach then is to measure risk on an aggregated and historical basis. This means providing a statistical approximation of risk, leveraging the similitudes of product architectures and hence the commonality of the assembly process for flight control elements, labor tracking datasets and injury/incident reports. This methodology would not only be helpful to prioritize ergonomic improvement projects, but would also serve to evaluate the ergonomic benefit of any change to the production system, as a function of labor.
Once opportunities are identified and prioritized, the PDCA methodology will be suggested to engage in continuous improvement. A continuous improvement project will be executed with the use of collaborative automation as the pivotal point for the second part of this thesis.
With statements of work transiting from craftsmanship to standard work, motion repetition increases, creating more automation-inclusive environments. Collaborative robotics is a novel category of robotics that emerged in the last decade [34]. This type of technology has been approached by several industries, but has not found an easy way into aerospace assembly, mainly
due to the disadvantageous precision capabilities compared to the robotic technologies in place nowadays for airframe assembly operations like match-drilling.
An additional hurdle that is commonplace for technology intervention is economies of scale. Due to the relatively low volumes of aircraft shipments, the investments are hard to justify financially. Examples throughout this thesis will show that there is a significant amount of repetition in assembly and verification operations that, if measured at the appropriate level, create a sound business case for technology intervention. It is difficult to envision automation in an industry that barely delivered above 500 units a year in peak production year (Figure 1-1), but it is easier to envision automation when considering that a single airplane is composed of more than 3 million individual parts [35].
Although many airframe assembly tasks require a high degree of handcraft expertise or high precision automation, this project reveals opportunities for collaborative robotics where repetition and time of exposure represent a risk for the operators and that do not require the level of precision that is mistakenly associated with all operations in the aerospace environment.
1.6 Overview of Hypotheses, Approach and Methodology
Chapter 2 addresses the need for an immediate and practical risk profile to help prioritize occupational-safety motivated projects. It provides an extensive overview of standardized risk assessments from different countries where the main aerospace manufacturers and stakeholders of this project are based in. The main takeaways from this chapter are:
1) In order to make a comprehensive identification and quantification of risk for prioritization purposes, all activities need to be risk-assessed
2) Timeliness and resource planning required to effectively utilize these risk assessment forms across a factory slows down implementation of projects that are critical not only for safety motivated projects, but for productivity and competitiveness driven improvements 3) Risk assessment forms and alternative methods are always prone to subjectivity, especially if the fact that both the assessments and surveys are performed by different individuals.
Based on this analysis, Chapter 3 develops the hypothesis that the risk of injury increases with the increase of labour for a particular task in airframe manufacturing in proportion to historical injury and incidents reported for that and or similar tasks within the same factory. By leveraging the positive correlation of labor and injuries, a risk profile can be obtained with shorter lead time than an observational risk assessment by using currently available datasets of labour per task and injuries per employee. The methodology for creating the data sets, defining the translation of tasks into effect variables and construction of the model through linear regression is presented. The benefits and potential applications of the resulting risk profile are also discussed, as well as its limitations. Chapter 3 finalizes with the recommended next steps for complementing and maintaining the model accuracy and thus to ensure its utility for further continuous improvement projects and new production system design.
Chapter 4 leaps into the overview of collaborative automation, its current availability, capabilities and limitations as well as their applicability for continuous improvement. This results in the
identification of the intersection of total automation cost and total industrial safety costs. A blind fastener stem machining was then selected to be a pilot for implementing a collaborative robot following the PDCA methodology.
This chapter describes the time, scope and resource differences between conducting a full production system design and a continuous improvement project, as well as the surrounding productive environment to which the robot will be coupled, in order for the reader to understand the requirements and the constraints within which the development of this solution has to land. Chapter 4 touches also on the challenges of integrating these technologies for continuous improvement driven projects that are prioritized and decided upon tighter budgets and timelines than the ones characterizing new airplanes and new production systems development.
Chapter 4 continues with proposing a methodology for the implementation of the collaborative robot following a continuous improvement roadmap, rather than a full technology development project.
To support this objective, Chapter 5 begins with describing the foundations and history of continuous improvement and how it should be executed according to aerospace standards. Following existing continuous improvement roadmaps in the aerospace context, the execution of a continuous improvement project using a collaborative robot coupled with the Plan-Do-Check-Act (PDCA) methodology is described.
As indicated by the PDCA basic problem solving flow, the first step was to identify the problem. The Rough Order of Magnitude Risk Profile developed in Chapter 3 was used to evaluate a flight
control element assembly line and find the tasks that seem prone to ergonomic risk.
Once a blind fastener stem machining process in the assembly line was selected for improvement, the manufacturing requirements were gathered and cross matched with the available collaborative robot capabilities. The "current situation assessment" was done by summarizing cycle time, conformance requirements, quality performance and ergonomic risk level for the current condition.
After the problem was identified and assessed to establish a baseline for improvement, an action plan was developed to cover the "Do" portion of the problem solving flow chart:
1) Study the fundamental physics of the machining process to understand the deterministic sources of variation
2) Measure the input variability, i.e. state of the parts flowing into the process 3) Hypothesize effects of the process control variables in the collaborative robot 4) Design and conduct experiment to test the effect of the control variables
5) Model the process based on the significant effects of the control variables 6) Determine optimal process settings
7) Simulate process with optimal settings 8) Calculate theoretical process capability
process output. The study was made to understand the condition of the material entering to the blind fastener machining station, the output of the process and the variables to perform hypothesis testing on.
In the second step, a variability study was done for the blind fastener stem conditions prior to machining. Non-random effects were suspected to be present due to the architecture of the flight control element and the effect of this deterministic offsets on the flight control element final surface flushness is discussed.
To assess the robot capability of taking over the machining task, and based on the outcome of the first step, force, speed and cutting tool shift were defined as the study variables, as defined by the third step of the action plan. The experimental hypotheses is presented as: "The effects of TCP down-force and TCP speed in a collaborative robot are significant to the process capability (Cpk) for stem machining of blind fasteners". An initial approximation is provided using deterministic
approaches (Material Removal Rate formulas) for the control variables (force and speed) to be used in the preliminary experimental runs.
To understand the effect of these three variables, a full factorial experiment was designed and conducted using a collaborative robot and a coupon. Robot, hardware, test setting and measuring instruments are also addressed in this step.
For step five, surface flushness measurements were taken from the coupon. Step six describes the data post-processing methodology that lead to the construction of a linear optimization model and furthermore simulate the robot process capability in steps seven and eight. This optimization exercise was performed to determine the optimal settings for the control variables needed to estimate the robot process capability Cpk through a simulation of the stem machining process using observed variability of the key parameters
Chapter 6 finally discusses the last steps of the PDCA problem solving roadmap (establish reliable methods and continuously improve processes) as well as the main observations and key learnings from the process capability simulations. The key topics discussed in this chapter
1) The effect of different inspection devices 2) The effect of uncontrolled variables
3) Other sources of variability that are significant to meeting key product characteristics 4) Recommended next steps for further benefits that could be gained by establishing a statistical
process control as suggested per ARP9013 (aerospace recommended practice). 1.7 Summary
Application of kaizen and lean/six sigma to airframe production systems is not new, history shows that many successful attempts have been made from implementing lean principles, to building airplanes in automobile factories to meet ambitious production rates. What is different today, is the width of the gaps in the production systems and the good fit of currently available technologies in terms of cost and capability to fill those gaps along with the objective of becoming an injury-free industry.
Improving ergonomic conditions of the workstations must start with the prioritization of projects based in a standard risk measurement tool. The conventional risk assessment methodologies while adept for non-specialized ergonomist to produce acceptable data is both time and resource consuming and prone to subjectivity. The end result demonstrates that it is possible to measure risk using existing data.
Considering the aforementioned incentives that exist to reduce costs, investment in continuous improvement becomes both non-trivial and time critical. The channels that are in place for technology to be integrated from the lab to the shopfloor are not flexible enough to fit different levels of complexity. This results in unnecessarily exhaustive roadmaps for off-the-shelf
technologies to be integrated and implemented. Through the adequate coupling of
experimentation and PDCA roadmaps, it is provable that new technologies can flow to the shopfloor in matter of months and not years.
Continuous improvement using cutting edge technology needs to and can be achieved at a fast pace even in an arduously regulated environment such as the aerospace industry. This project demonstrates that through the strong collaboration of the of EHS (Environment, Health and Safety), Quality, Production Systems Engineering and Research and Technology the adequate technologies can be developed and deployed in the right stages of the manufacturing systems in a way that is compliant with both technology readiness and the business needs. For the success of this project, strong involvement was required from every stakeholder from the front line employees to top management levels.
1.8 Chapter 1 references
[11
j.
P. Womack, D. T. Jones, and D. Roos, The machine that changed the world : how Japan's secret weapon in the global auto wars will revolutionize Western industry. New York, NY: HarperPerennial, 1991., 1991.[2] "How The Wright Brothers Blew It -Forbes." [Online]. Available:
http://www.forbes.com/2003/11/19/1119aviation.html. [Accessed: 06-Feb-2016]. [3] "Flying Wings: An Anthology: Igo Etrich (1879 - 1967)." [Online]. Available:
http://www.ctie.monash.edu.au/hargrave/etrichtaube.htm. [Accessed: 07-Feb-2016]. [4] "The Great War Society: Relevance Archive." [Online]. Available:
http://www.worldwarl.com/tgws/relairprod.htm. [Accessed: 07-Feb-2016].
[5] "World War I: The Definitive Encyclopedia and Document Collection," Ref. User Serv.
Q.,
vol. 54, no. 4, pp. 85-85, Summer 2015.[6] "Flying Wings: An Anthology: Igo Etrich (1879 - 1967)." [Online]. Available:
http://www.ctie.monash.edu.au/hargrave/etrichtaube.htm. [Accessed: 07-Feb-2016].
[7] B. & Noble, "Freedom's Forge: How American Business Produced Victory in World War II," Barnes & Noble. [Online]. Available: http://www.barnesandnoble.com/w/freedoms-forge-arthur-herman/1106725548. [Accessed: 07-Feb-2016].
[8] A. Haggerty and R. Wood, "The P-51 Mustang: A Case Study in Defense Acquisition,"
Def. AR J., vol. 17, no. 4, pp. 508-519, Oct. 2010.
[10] "The History of the Aerospace Industry." [Online]. Available:
https://eh.net/encyclopedia/the-history-of-the-aerospace-industry/. [Accessed: 06-Feb-2016].
[11] H. W. Lawrence, Aviation and the Role of Government. Kendall Hunt, 2004.
[12] "Aerospace Engineering and Operations Technicians: Occupational Outlook Handbook::
U.S. Bureau of Labor Statistics." [Online]. Available:
http://www.bls.gov/ooh/architecture-and-engineering/aerospace-engineering-and-operations-technicians.htm#tab-6. [Accessed: 27-Nov-2015].
[13] J. R. Black, Lean Production: Inplementing a World-class System. Industrial Press Inc., 2008.
[14] A BLS reader on productivity. U.S. Department of Labor, Bureau of Labor Statistics, 1996.
[15] "Airbus aircraft -prices 2015 1 Statistic," Statista. [Online]. Available:
http://www.statista.com/statistics/273962/prices-of-airbus-aircraft-by-type/. [Accessed: 07-Feb-2016].
[16] "Boeing aircraft -average prices 2015
I
Statistic," Statista. [Online]. Available: http://www.statista.com/statistics/273941/prices-of-boeing-aircraft-by-type/. [Accessed: 07-Feb-2016].[17] "Orders & deliveries
I
Airbus, a leading aircraft manufacturer," airbus. [Online].Available: http://www.airbus.com/company/market/orders-deliveries/. [Accessed: 07-Feb-2016].
[18] "Boeing 737 Orders and Deliveries," The Boeing 737 Technical Site. [Online]. Available:
http://www.b737.org.uk/sales.htm. [Accessed: 26-Nov-2015].
[19] "The Industry Handbook: The Airline Industry," Investopedia. [Online]. Available:
http://www.investopedia.com/features/industryhandbook/ airline.asp. [Accessed: 26-Nov-2015].
[20] "Boeing: history." [Online]. Available: http://www.boeing.com.au/boeing-in-australia/history.page. [Accessed: 07-Feb-2016].
[21] "Boeing: Boeing Australia -Boeing Aerostructures Australia (BAA)." [Online]. Available: http://www.boeing.com.au/boeing-in-australia/subsidiaries/boeing-aerostructures-australia.page. [Accessed: 07-Feb-2016].
[22] "Boeing 737 Primary Flight Controls -DutchOps.com powered..." [Online]. Available: http://www.dutchops.com/Portfolio Marcel/Articles/Flight%20Controls/B737_Flight Controls/ B737_PrimaryFlightControls.html. [Accessed: 02-May-2016].
[23] "Boeing 747-400 3D Model Download
I
3D CAD Browser." [Online]. Available:http://www.3dcadbrowser.com/download.aspx?3dmodel=3631. [Accessed: 02-May-2016].
[24] "Boeing strengthens commitment to Australian manufacturing." [Online]. Available:
http:
/ /
www.smh.com.au/ business/boeing-strengthens-commitment-to-australian-manufacturing-20150616-ghpb6d.html. [Accessed: 07-Feb-2016]. [25] "Databases, Tables & Calculators by Subject." [Online]. Available:
http://www.bls.gov/data/#employment. [Accessed: 07-Feb-2016].
[26] "Establishment Specific Injury and Illness Data (OSHA Data Initiative)." [Online].
Available: https://www.osha.gov/pls/odi/establishmentsearch.html. [Accessed: 01-Dec-2015].
[27] "THE PLAN, DO, STUDY, ACT (PDSA) CYCLE." [Online]. Available:
https://www.deming.org/theman/theories/pdsacycle. [Accessed: 07-Feb-2016].
[28] "How to Develop an Ergonomic Opportunity List & Prioritize Jobs for Improvement,"
[29] "Safety and Health Topics
I
Ergonomics -Identify Problems." [Online]. Available: https://www.osha.gov/SLTC/ergonomics/identifyprobs.html. [Accessed: 07-Feb-2016].[30] C. C. for 0. H. and S. Government of Canada, "Job Safety Analysis: OSH Answers,"
05-Feb-2016. [Online]. Available: https://www.ccohs.ca/oshanswers/hsprograms/job-haz.html. [Accessed: 07-Feb-2016].
[31] "Ergonomics in Sport and Physical Activity -Thomas Reilly," Iiman-kinetics,
18-Aug-2009. [Online]. Available: http://www.humankinetics.com/products/all-products/ergonomics-in-sport-and-physical-activity. [Accessed: 07-Feb-2016].
[32] D. 0. N. Diban and L. A. Gontijo, "The Complexity of Ergonomic in Product Design
Requirements," Procedia Manuf., vol. 3, pp. 6169-6174, Jan. 2015.
[33] F. Redmill and T. Anderson, Developments in risk-based approaches to safety: proceedings of
the
fourteenth
Safely-critical Systems Symposium, Bristol, UK, 7-9 February 2006. London: Springer, c2006., 2006.[34] M. B6langer-Barrette, "What Does Collaborative Robot Mean ?" [Online]. Available:
http:/ /blog.robotiq.com/what-does-collaborative-robot-mean. [Accessed: 07-Feb-2016].
[35] "How Many Fasteners in a Boeing 777? -Global Fastener News." [Online]. Available:
http://globalfastenemews.com/main.asp?SectionlD=26&SubSectionlD=39&ArticleID=l 0822. [Accessed: 07-Feb-2016].
Chapter 2: Literature review on economics, ergonomics and risk
assessment tools
This chapter describes the fundamental relationship of workplace safety with ergonomics and economics, as well as the intersection of these two sciences. Establishing a risk baseline is described as the first recommended step for every occupational health and safety improvement program. Biomechanical models are reviewed first to understand their temporal incompatibility with continuous improvement programs. Conventional risk assessment forms are also discussed as a more convenient option for identifying and measuring risk in the workplace without specialized biomechanical expertise. Both alternatives come, however, with the restriction of being observation-dependent and thus resource-consuming. A common trade-off, accuracy vs. complexity, is found when deciding between these 2 alternatives for gaging risk in the workplace. The more robust or accurate a model or a risk assessment form is, the more data it requires, and thus more observation and resources generally need to be allocated.
2.1 Occupational health and safety in the aerospace industry
OHSA provides data collected since 1996 to measure and compare companies' safety performance. One of the indicators used for this matter is the Incident Rate, which provides the number of recordable incidents that resulted in "days away from work". This figure is standardized per 100 full-time employees in a given time frame. The datasets were gathered through the OSHA Data Initiative [36].
The formula through which OSHA computes incident rates is then:
Incident rate= Number of injuries and illnesses X 200,000 / employee hours worked [1]
The 200,000 labor-hours base rate comes from assuming 100 employees, working 40 hours per week, 50 weeks per year.
The Total Case Rate (TCR) is a similar indicator that includes all cases recorded on the OSHA Form 300, including those that did not result in "days away from work".
The summary of the TCR for the aerospace industry, the entire manufacturing sector and the aerospace component fabrication companies is summarized in Fig 2-1. The TCR for airframe manufacturers and the aerospace component manufacturers (including suppliers) decrease very similarly.
Figure 2-1: Comparison of TCR for aircraft assembly companies and aircraft parts fabrication [1]
TCR of aircraft assembly and aircraft
parts
-12 10 8 4-0 * C' C'~ ~~C'
' -t C'C C ' n-- n-- - Parts TCR Aircraft 'TCRFigure 2-2 shows how The Boeing Company TCR has been similar to the commercial aircraft production sector in the US, including parts suppliers, and generally better than the entire manufacturing sector in the US as mentioned in Chapter 1.
Figure 2-2: TCR comparison of the commercial aircraft supply chain and the manufacturing sector in the US [1].
T'CR [o3er"I, 'Xirktt n. ply chain Unct' 1urinl >ctc r
11

![Figure 1-11: TCR Aerospace vs. Manufacturing sector [26]:](https://thumb-eu.123doks.com/thumbv2/123doknet/14471193.522372/21.918.187.701.130.429/figure-tcr-aerospace-vs-manufacturing-sector.webp)
![Figure 2-1: Comparison of TCR for aircraft assembly companies and aircraft parts fabrication [1]](https://thumb-eu.123doks.com/thumbv2/123doknet/14471193.522372/30.918.153.686.267.542/figure-comparison-aircraft-assembly-companies-aircraft-parts-fabrication.webp)

![Figure 3-6: Flaps [9]](https://thumb-eu.123doks.com/thumbv2/123doknet/14471193.522372/50.918.235.657.525.827/figure-flaps.webp)

![Figure 3-10: Aileron assembly [12]](https://thumb-eu.123doks.com/thumbv2/123doknet/14471193.522372/53.918.174.707.141.470/figure-aileron-assembly.webp)


