arXiv:1212.1842v1 [hep-ex] 8 Dec 2012
Measurement of the combined rapidity and p
Tdependence of dijet azimuthal
decorrelations in p ¯
p
collisions at
√
s
= 1.96 TeV
V.M. Abazov,32 B. Abbott,68 B.S. Acharya,26M. Adams,46 T. Adams,44 G.D. Alexeev,32 G. Alkhazov,36 A. Altona,57 A. Askew,44 S. Atkins,55 K. Augsten,7 C. Avila,5 F. Badaud,10 L. Bagby,45 B. Baldin,45 D.V. Bandurin,44S. Banerjee,26 E. Barberis,56 P. Baringer,53 J.F. Bartlett,45 U. Bassler,15V. Bazterra,46 A. Bean,53 M. Begalli,2L. Bellantoni,45S.B. Beri,24 G. Bernardi,14 R. Bernhard,19I. Bertram,39 M. Besan¸con,15 R. Beuselinck,40P.C. Bhat,45S. Bhatia,59V. Bhatnagar,24G. Blazey,47S. Blessing,44 K. Bloom,60 A. Boehnlein,45 D. Boline,65E.E. Boos,34G. Borissov,39A. Brandt,71O. Brandt,20R. Brock,58A. Bross,45 D. Brown,14J. Brown,14
X.B. Bu,45 M. Buehler,45 V. Buescher,21 V. Bunichev,34 S. Burdinb,39 C.P. Buszello,38E. Camacho-P´erez,29 B.C.K. Casey,45 H. Castilla-Valdez,29S. Caughron,58 S. Chakrabarti,65 D. Chakraborty,47K. Chakravarthula,55
K.M. Chan,51 A. Chandra,73 E. Chapon,15G. Chen,53 S.W. Cho,28 S. Choi,28 B. Choudhary,25 S. Cihangir,45 D. Claes,60 J. Clutter,53 M. Cooke,45W.E. Cooper,45 M. Corcoran,73 F. Couderc,15M.-C. Cousinou,12 D. Cutts,70
A. Das,42 G. Davies,40 S.J. de Jong,30, 31 E. De La Cruz-Burelo,29 F. D´eliot,15 R. Demina,64 D. Denisov,45 S.P. Denisov,35 S. Desai,45 C. Deterred,20 K. DeVaughan,60 H.T. Diehl,45 M. Diesburg,45 P.F. Ding,41 A. Dominguez,60 A. Dubey,25 L.V. Dudko,34 D. Duggan,61A. Duperrin,12 S. Dutt,24 A. Dyshkant,47 M. Eads,47
D. Edmunds,58 J. Ellison,43 V.D. Elvira,45 Y. Enari,14H. Evans,49 V.N. Evdokimov,35 G. Facini,56 L. Feng,47 T. Ferbel,64 F. Fiedler,21 F. Filthaut,30, 31 W. Fisher,58 H.E. Fisk,45 M. Fortner,47 H. Fox,39 S. Fuess,45 A. Garcia-Bellido,64J.A. Garc´ıa-Gonz´alez,29G.A. Garc´ıa-Guerrac,29 V. Gavrilov,33 W. Geng,12, 58 C.E. Gerber,46
Y. Gershtein,61 G. Ginther,45, 64 G. Golovanov,32P.D. Grannis,65 S. Greder,16 H. Greenlee,45G. Grenier,17 Ph. Gris,10 J.-F. Grivaz,13A. Grohsjeand,15 S. Gr¨unendahl,45 M.W. Gr¨unewald,27T. Guillemin,13 G. Gutierrez,45
P. Gutierrez,68 J. Haley,56 L. Han,4 K. Harder,41A. Harel,64 J.M. Hauptman,52 J. Hays,40 T. Head,41 T. Hebbeker,18D. Hedin,47 H. Hegab,69 A.P. Heinson,43U. Heintz,70 C. Hensel,20 I. Heredia-De La Cruz,29 K. Herner,57 G. Heskethf,41M.D. Hildreth,51 R. Hirosky,74T. Hoang,44J.D. Hobbs,65B. Hoeneisen,9 J. Hogan,73
M. Hohlfeld,21 I. Howley,71 Z. Hubacek,7, 15 V. Hynek,7 I. Iashvili,63 Y. Ilchenko,72R. Illingworth,45 A.S. Ito,45 S. Jabeen,70 M. Jaffr´e,13 A. Jayasinghe,68 M.S. Jeong,28 R. Jesik,40 P. Jiang,4 K. Johns,42 E. Johnson,58 M. Johnson,45A. Jonckheere,45P. Jonsson,40J. Joshi,43 A.W. Jung,45A. Juste,37 E. Kajfasz,12D. Karmanov,34
P.A. Kasper,45I. Katsanos,60R. Kehoe,72 S. Kermiche,12 N. Khalatyan,45A. Khanov,69 A. Kharchilava,63 Y.N. Kharzheev,32I. Kiselevich,33J.M. Kohli,24 A.V. Kozelov,35J. Kraus,59A. Kumar,63A. Kupco,8T. Kurˇca,17
V.A. Kuzmin,34 S. Lammers,49G. Landsberg,70 P. Lebrun,17 H.S. Lee,28 S.W. Lee,52 W.M. Lee,44 X. Lei,42 J. Lellouch,14 D. Li,14H. Li,74L. Li,43 Q.Z. Li,45 J.K. Lim,28 D. Lincoln,45 J. Linnemann,58 V.V. Lipaev,35 R. Lipton,45 H. Liu,72 Y. Liu,4 A. Lobodenko,36 M. Lokajicek,8 R. Lopes de Sa,65 R. Luna-Garciag,29 A.L. Lyon,45
A.K.A. Maciel,1 R. Maga˜na-Villalba,29 S. Malik,60V.L. Malyshev,32 Y. Maravin,54 J. Mart´ınez-Ortega,29 R. McCarthy,65 C.L. McGivern,41 M.M. Meijer,30, 31 A. Melnitchouk,45 D. Menezes,47 P.G. Mercadante,3 M. Merkin,34 A. Meyer,18 J. Meyer,20 F. Miconi,16 N.K. Mondal,26 M. Mulhearn,74 E. Nagy,12 M. Naimuddin,25
M. Narain,70 R. Nayyar,42 H.A. Neal,57 J.P. Negret,5 P. Neustroev,36 H.T. Nguyen,74 T. Nunnemann,22 J. Orduna,73 N. Osman,12 J. Osta,51 M. Padilla,43A. Pal,71 N. Parashar,50 V. Parihar,70 S.K. Park,28 R. Partridgee,70 N. Parua,49A. Patwa,66B. Penning,45M. Perfilov,34 Y. Peters,20 K. Petridis,41G. Petrillo,64 P. P´etroff,13M.-A. Pleier,66P.L.M. Podesta-Lermah,29V.M. Podstavkov,45A.V. Popov,35 M. Prewitt,73D. Price,49
N. Prokopenko,35J. Qian,57A. Quadt,20B. Quinn,59 M.S. Rangel,1K. Ranjan,25P.N. Ratoff,39I. Razumov,35 P. Renkel,72 I. Ripp-Baudot,16 F. Rizatdinova,69 M. Rominsky,45A. Ross,39C. Royon,15P. Rubinov,45 R. Ruchti,51
G. Sajot,11P. Salcido,47A. S´anchez-Hern´andez,29M.P. Sanders,22A.S. Santosi,1 G. Savage,45 L. Sawyer,55 T. Scanlon,40 R.D. Schamberger,65 Y. Scheglov,36 H. Schellman,48 C. Schwanenberger,41 R. Schwienhorst,58 J. Sekaric,53 H. Severini,68 E. Shabalina,20V. Shary,15S. Shaw,58A.A. Shchukin,35R.K. Shivpuri,25 V. Simak,7 P. Skubic,68 P. Slattery,64 D. Smirnov,51K.J. Smith,63 G.R. Snow,60 J. Snow,67 S. Snyder,66 S. S¨oldner-Rembold,41
L. Sonnenschein,18 K. Soustruznik,6 J. Stark,11 D.A. Stoyanova,35M. Strauss,68 L. Suter,41 P. Svoisky,68 M. Titov,15 V.V. Tokmenin,32Y.-T. Tsai,64 D. Tsybychev,65 B. Tuchming,15 C. Tully,62 L. Uvarov,36 S. Uvarov,36
S. Uzunyan,47 R. Van Kooten,49W.M. van Leeuwen,30N. Varelas,46E.W. Varnes,42I.A. Vasilyev,35 P. Verdier,17 A.Y. Verkheev,32 L.S. Vertogradov,32M. Verzocchi,45 M. Vesterinen,41 D. Vilanova,15P. Vokac,7 H.D. Wahl,44
M.H.L.S. Wang,45 J. Warchol,51 G. Watts,75 M. Wayne,51 J. Weichert,21 L. Welty-Rieger,48 A. White,71 D. Wicke,23 M.R.J. Williams,39 G.W. Wilson,53 M. Wobisch,55 D.R. Wood,56 T.R. Wyatt,41 Y. Xie,45 R. Yamada,45S. Yang,4 T. Yasuda,45 Y.A. Yatsunenko,32W. Ye,65 Z. Ye,45H. Yin,45 K. Yip,66 S.W. Youn,45 J.M. Yu,57 J. Zennamo,63 T.G. Zhao,41B. Zhou,57J. Zhu,57 M. Zielinski,64 D. Zieminska,49 and L. Zivkovic14
(The D0 Collaboration∗)
1LAFEX, Centro Brasileiro de Pesquisas F´ısicas, Rio de Janeiro, Brazil 2Universidade do Estado do Rio de Janeiro, Rio de Janeiro, Brazil
3Universidade Federal do ABC, Santo Andr´e, Brazil
4University of Science and Technology of China, Hefei, People’s Republic of China 5Universidad de los Andes, Bogot´a, Colombia
6Charles University, Faculty of Mathematics and Physics,
Center for Particle Physics, Prague, Czech Republic
7Czech Technical University in Prague, Prague, Czech Republic 8Center for Particle Physics, Institute of Physics,
Academy of Sciences of the Czech Republic, Prague, Czech Republic
9Universidad San Francisco de Quito, Quito, Ecuador 10LPC, Universit´e Blaise Pascal, CNRS/IN2P3, Clermont, France
11LPSC, Universit´e Joseph Fourier Grenoble 1, CNRS/IN2P3,
Institut National Polytechnique de Grenoble, Grenoble, France
12CPPM, Aix-Marseille Universit´e, CNRS/IN2P3, Marseille, France 13LAL, Universit´e Paris-Sud, CNRS/IN2P3, Orsay, France 14LPNHE, Universit´es Paris VI and VII, CNRS/IN2P3, Paris, France
15CEA, Irfu, SPP, Saclay, France
16IPHC, Universit´e de Strasbourg, CNRS/IN2P3, Strasbourg, France
17IPNL, Universit´e Lyon 1, CNRS/IN2P3, Villeurbanne, France and Universit´e de Lyon, Lyon, France 18III. Physikalisches Institut A, RWTH Aachen University, Aachen, Germany
19Physikalisches Institut, Universit¨at Freiburg, Freiburg, Germany
20II. Physikalisches Institut, Georg-August-Universit¨at G¨ottingen, G¨ottingen, Germany 21Institut f¨ur Physik, Universit¨at Mainz, Mainz, Germany
22Ludwig-Maximilians-Universit¨at M¨unchen, M¨unchen, Germany 23Fachbereich Physik, Bergische Universit¨at Wuppertal, Wuppertal, Germany
24Panjab University, Chandigarh, India 25Delhi University, Delhi, India
26Tata Institute of Fundamental Research, Mumbai, India 27University College Dublin, Dublin, Ireland
28Korea Detector Laboratory, Korea University, Seoul, Korea 29CINVESTAV, Mexico City, Mexico
30Nikhef, Science Park, Amsterdam, the Netherlands 31Radboud University Nijmegen, Nijmegen, the Netherlands
32Joint Institute for Nuclear Research, Dubna, Russia 33Institute for Theoretical and Experimental Physics, Moscow, Russia
34Moscow State University, Moscow, Russia 35Institute for High Energy Physics, Protvino, Russia 36Petersburg Nuclear Physics Institute, St. Petersburg, Russia
37Instituci´o Catalana de Recerca i Estudis Avan¸cats (ICREA) and Institut de F´ısica d’Altes Energies (IFAE), Barcelona, Spain 38Uppsala University, Uppsala, Sweden
39Lancaster University, Lancaster LA1 4YB, United Kingdom 40Imperial College London, London SW7 2AZ, United Kingdom 41The University of Manchester, Manchester M13 9PL, United Kingdom
42University of Arizona, Tucson, Arizona 85721, USA 43University of California Riverside, Riverside, California 92521, USA
44Florida State University, Tallahassee, Florida 32306, USA 45Fermi National Accelerator Laboratory, Batavia, Illinois 60510, USA
46University of Illinois at Chicago, Chicago, Illinois 60607, USA 47Northern Illinois University, DeKalb, Illinois 60115, USA
48Northwestern University, Evanston, Illinois 60208, USA 49Indiana University, Bloomington, Indiana 47405, USA 50Purdue University Calumet, Hammond, Indiana 46323, USA 51University of Notre Dame, Notre Dame, Indiana 46556, USA
52Iowa State University, Ames, Iowa 50011, USA 53University of Kansas, Lawrence, Kansas 66045, USA 54Kansas State University, Manhattan, Kansas 66506, USA
55Louisiana Tech University, Ruston, Louisiana 71272, USA 56Northeastern University, Boston, Massachusetts 02115, USA
57University of Michigan, Ann Arbor, Michigan 48109, USA 58Michigan State University, East Lansing, Michigan 48824, USA
59University of Mississippi, University, Mississippi 38677, USA 60University of Nebraska, Lincoln, Nebraska 68588, USA 61Rutgers University, Piscataway, New Jersey 08855, USA 62Princeton University, Princeton, New Jersey 08544, USA 63State University of New York, Buffalo, New York 14260, USA
64University of Rochester, Rochester, New York 14627, USA 65State University of New York, Stony Brook, New York 11794, USA
66Brookhaven National Laboratory, Upton, New York 11973, USA 67Langston University, Langston, Oklahoma 73050, USA 68University of Oklahoma, Norman, Oklahoma 73019, USA 69Oklahoma State University, Stillwater, Oklahoma 74078, USA
70Brown University, Providence, Rhode Island 02912, USA 71University of Texas, Arlington, Texas 76019, USA 72Southern Methodist University, Dallas, Texas 75275, USA
73Rice University, Houston, Texas 77005, USA 74University of Virginia, Charlottesville, Virginia 22904, USA
75University of Washington, Seattle, Washington 98195, USA
(Dated: December 8, 2012)
We present the first combined measurement of the rapidity and transverse momentum dependence of dijet azimuthal decorrelations, using the recently proposed quantity R∆φ. The variable R∆φ
measures the fraction of the inclusive dijet events in which the azimuthal separation of the two jets with the highest transverse momenta is less than a specified value for the parameter ∆φmax.
The quantity R∆φis measured in p¯p collisions at√s = 1.96 TeV, as a function of the dijet rapidity
interval, the total scalar transverse momentum, and ∆φmax. The measurement uses an event sample
corresponding to an integrated luminosity of 0.7 fb−1collected with the D0 detector at the Fermilab
Tevatron Collider. The results are compared to predictions of a perturbative QCD calculation at next-to-leading order in the strong coupling with corrections for non-perturbative effects. The theory predictions describe the data, except in the kinematic region of large dijet rapidity intervals and large ∆φmax.
PACS numbers: 13.87.Ce, 12.38.Qk
In high-energy collisions of hadrons, the production rates of particle jets with large transverse momentum with respect to the beam direction, pT, are predicted by perturbative Quantum Chromodynamics (pQCD). At second order in the strong coupling constant, αs, pQCD predicts only the production of dijet final states. In the absence of higher-order radiative effects, the jet direc-tions are correlated in the azimuthal plane and their rel-ative azimuthal angle ∆φdijet = |φjet1− φjet2| is equal to π. Deviations from π (hereafter referred to as “az-imuthal decorrelations”) are caused by radiative pro-cesses in which additional jets are produced. The amount of the decorrelation is directly related to the multiplicity and the pT carried by the additional jets. The
tran-∗with visitors from aAugustana College, Sioux Falls, SD, USA, bThe University of Liverpool, Liverpool, UK,cUPIITA-IPN,
Mex-ico City, MexMex-ico, dDESY, Hamburg, Germany, eSLAC, Menlo
Park, CA, USA,fUniversity College London, London, UK,gCentro de Investigacion en Computacion - IPN, Mexico City, Mexico,
hECFM, Universidad Autonoma de Sinaloa, Culiac´an, Mexico and iUniversidade Estadual Paulista, S˜ao Paulo, Brazil.
sition from soft to hard higher-order pQCD processes can be studied by examining the corresponding range of azimuthal decorrelations from small to large values. This makes measurements of dijet azimuthal decorrela-tions an ideal testing ground for pQCD predicdecorrela-tions of multijet production processes. In pQCD, dijet azimuthal decorrelations are predicted to depend not only on the transverse momentum of the jets, but also on the ra-pidity y∗ = |y
jet1− yjet2|/2, obtained from the rapidity difference of the two leading pT jets in an event [1]. In a previous analysis of dijet azimuthal decorrelations, we measured the dijet differential cross section as a function of ∆φdijet, integrated over a fixed jet rapidity range and normalized by the inclusive dijet cross section, for dif-ferent requirements on the leading jet pT [2]. The same methodology was later used in analyses of pp collision data at√s = 7 TeV from the CERN Large Hadron Col-lider [3, 4]. In all cases, dijet azimuthal decorrelations have been observed to decrease with increasing pT; how-ever, the combined rapidity and pT dependence has not yet been measured.
In this Letter, we perform a measurement of the ra-pidity and the pT dependence of dijet azimuthal
decor-relations. The analysis is based on a new quantity, R∆φ, which was recently proposed in Ref. [5] as
R∆φ(HT, y∗, ∆φmax) = d2σ
dijet(∆φdijet<∆φmax) dHTdy∗ d2σdijet(inclusive)
dHTdy∗
. (1)
The quantity R∆φ is defined as the fraction of the inclu-sive dijet cross section with a decorrelation of ∆φdijet< ∆φmax, where ∆φmaxis a parameter and σdijet(inclusive) is the inclusive dijet cross section without a ∆φdijet re-quirement. It is measured as a function of ∆φmax, y∗, and of the total transverse momentum HT in the event, computed as the scalar pT sum from all jets i with pT i > pTmin and |yi − yboost| < ymax∗ where yboost = (yjet1+ yjet2)/2, pTmin = 30 GeV, and y∗max = 2, where jet1 and jet2 are the jets with the largest pT in the event. For ∆φmax≈ π, R∆φis sensitive to soft QCD radiation, while it becomes sensitive to hard higher-order QCD pro-cesses for smaller values of ∆φmax. The phase space re-gion ∆φmax< 2π/3 is dominated by final states with four or more jets. Since R∆φis defined as a ratio of cross sec-tions, several experimental and theoretical uncertainties cancel. In pQCD, R∆φis computed as a ratio of three-jet and dijet cross sections which is (at leading order, LO) proportional to αs. While dependencies on parton distri-bution functions (PDFs) largely cancel, R∆φ is sensitive to the pQCD matrix elements and to αs.
The measurement is performed in p¯p collisions at √
s = 1.96 TeV, for an inclusive dijet event sample de-fined by the Run II midpoint cone jet algorithm [6] with a cone of radius Rcone = 0.7 in y and φ. The dijet phase space is defined by the requirements pT1> HT/3, pT2 > pTmin, y∗ < ymax∗ , and |yboost| < 0.5. Follow-ing the proposal in Ref. [5], R∆φ is measured over the HT range of 180–900 GeV, in three rapidity regions of 0 < y∗ < 0.5, 0.5 < y∗ < 1, and 1 < y∗ < 2; and for ∆φmax = 7π/8, 5π/6, and 3π/4. The ranges in y∗ and yboost, and the value of pTminensure that all jets are al-ways within |y| < 2.5 at pT values where the jet energy calibration and jet pT resolutions are known with high precision. The requirement pT1> HT/3 provides a lower boundary for the leading jet pT in each HT bin, which (together with |y| < 2.5) ensures that the jet triggers are efficient. The data are corrected for experimental effects and are presented at the “particle level,” which includes all stable particles as defined in Ref. [7].
A detailed description of the D0 detector is provided in Ref. [8]. The event triggering and selection, jet re-construction, and jet energy and momentum correction are identical to those used in recent D0 multijet mea-surements [9–13]. Jets are reconstructed in the finely segmented liquid-argon sampling calorimeters that cover most of the solid angle. The central calorimeter cov-ers polar angles in the range 37–143◦ and the two end-cap calorimeters extend this coverage to within 1.7◦ of the nominal beamline [8]. The transition regions
be-tween the central and the endcap calorimeters contain scintillator-based detectors to improve the energy sam-pling. The jet transverse momenta are calculated using only calorimeter information and the location of the p¯p collision. The position of the p¯p interaction is determined from the tracks reconstructed based on data from the sil-icon detector and scintillating fiber tracker located inside a 2 T solenoidal magnet [8]. The position is required to be within 50 cm of the detector center in the coordinate along the beam axis, with at least three tracks pointing to it. These requirements discard (7–9)% of the events, depending on the trigger used. For this measurement, events are triggered by inclusive jet triggers. Trigger ef-ficiencies are studied as a function of HT by comparing the inclusive dijet cross section in data sets obtained by triggers with different pT thresholds in regions where the trigger with lower threshold is fully efficient. The trigger with lowest pT threshold is shown to be fully efficient by studying an event sample obtained independently with a muon trigger. In each inclusive jet HT bin, events are used from a single trigger which has an efficiency higher than 98%. Requirements on the characteristics of the calorimeter clusters shower shapes are used to suppress the background due to electrons, photons, and detector noise that would otherwise mimic jets. The efficiency for the shower shape requirements is above 97.5%. Contribu-tions from cosmic ray events are suppressed by requiring the missing transverse momentum in an event to be less than 70% (50%) of the leading jet pT (before the jet en-ergy calibration is applied) if the latter is below (above) 100 GeV. The efficiency of this requirement for signal is found to be > 99.5% [14, 15]. After all selection require-ments, the fraction of background events is below 0.1% for all HT, as determined from distributions in signal and in background-enriched event samples.
The jet four-momenta reconstructed from calorimeter energy depositions are then corrected, on average, for the response of the calorimeter, the net energy flow through the jet cone, additional energy from previous beam cross-ings, and multiple p¯p interactions in the same event, but not for the presence of muons and neutrinos [14, 15]. These corrections adjust the reconstructed jet energy to the energy of the stable particles that enter the calorime-ter except for muons and neutrinos. The absolute energy calibration is determined from Z → e+e−events and the pT imbalance in γ + jet events in the region |y| < 0.4. The extension to larger rapidities is derived from dijet events using a similar data-driven method. In addition, corrections in the range (2–4)% are applied that take into account the difference in calorimeter response due to the difference in the fractional contributions of quark and gluon-initiated jets in the dijet and the γ + jet event samples. These corrections are determined using jets simulated with the pythia event generator [16] that have been passed through a geant-based detector simu-lation [17]. The total corrections of the jet four-momenta
10 -2 10 -1 1
R
∆φ(H
T, y*,
∆φ
max)
0.2 0.4 0.8H
T(TeV)
0.2 0.4 0.8 0.2 0.4 0.8DØ
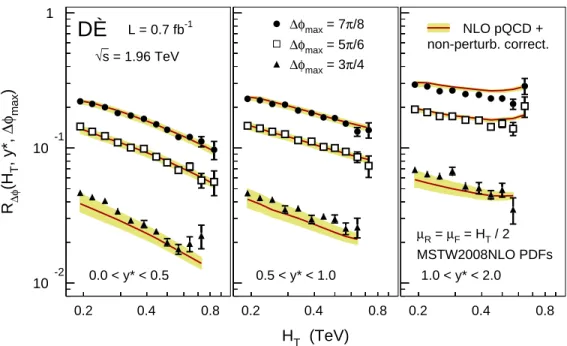
L = 0.7 fb-1 √s = 1.96 TeV 0.0 < y* < 0.5 0.5 < y* < 1.0 1.0 < y* < 2.0 ∆φmax = 7π/8 ∆φmax = 5π/6 ∆φmax = 3π/4 NLO pQCD + non-perturb. correct. µR = µF = HT / 2 MSTW2008NLO PDFsFIG. 1: (Color online.) The results for R∆φas a function of HT in three different regions of y∗and for three different ∆φmax
requirements. The error bars indicate the statistical and systematic uncertainties summed in quadrature. The theoretical predictions are shown with their uncertainties.
vary between 50% and 20% for jet pT between 50 and 400 GeV. An additional correction is applied for system-atic shifts in rapidity due to detector effects [14, 15].
The procedure that corrects the distributions R∆φ(HT, y∗, ∆φmax) for experimental effects uses particle-level events, generated with sherpa 1.1.3 [18] with MSTW2008LO PDFs [19] and with pythia 6.419 [16] with CTEQ6.6 PDFs [20] and tune QW [21]. The jets from these events are processed by a simulation of the detector response which is based on parametriza-tions of jet pT resolutions and jet reconstruction efficiencies determined from data and of resolutions of the polar and azimuthal angles of jets, obtained from a detailed simulation of the detector using geant.
The pT resolution for jets is about 15% at 40 GeV, decreasing to less than 10% at 400 GeV. To use the sim-ulation to correct for experimental effects, the simsim-ulation must describe all relevant distributions, including the pT and |y| distributions of the three leading pT jets, and the ∆φdijet distribution. To achieve this, the generated events, which are used in the correction procedure, are weighted, based on the properties of the generated jets, to match these distributions in data. The bin sizes in the HT distributions are chosen to be approximately twice the HT resolution. The bin purity, defined as the frac-tion of all reconstructed events that were generated in the same bin, is above 50% for all bins, and only weakly de-pendent on HT. We then use the simulation to determine correction factors for experimental effects for all bins. The correction factors are computed bin-by-bin as the ratio of R∆φwithout and with simulation of the detector
response. These also include corrections for the energies of unreconstructed muons and neutrinos inside the jets. The total correction factors for R∆φ using the weighted pythia and sherpa simulations agree typically within 1% for ∆φmax = 7π/8 and 5π/6 and between 1–4% for ∆φmax = 3π/4. The total correction factors, defined as the average values from pythia and sherpa, are 0.98– 1.0 for ∆φmax= 7π/8, 0.95–0.99 for ∆φmax= 5π/6, and 0.81–0.91 for ∆φmax = 3π/4, with little y∗ dependence. The difference between the average and the individual corrections is taken into account as the uncertainty at-tributed to the model dependence.
In total, 69 independent sources of experimental sys-tematic uncertainties are identified, mostly related to jet energy calibration and jet pT resolution. The effects of each source are taken as fully correlated between all data points. The dominant uncertainties for the R∆φ dis-tributions are due to the jet energy calibration (2–5)%, and the model dependence of the correction factors (1– 4)%. Smaller contributions come from the jet φ resolu-tion (0.5–2)%, from the uncertainties in systematic shifts in y (< 2%), and the jet pT resolution (< 1%). All other sources are negligible. The systematic uncertain-ties are 2–3% for ∆φmax= 7π/8 and 5π/6 and 3–5% for ∆φmax= 3π/4. A detailed documentation of the results, including the individual contributions to the uncertain-ties, is provided in the supplementary material [22].
The results for R∆φ(HT, y∗, ∆φmax) are listed in Ta-bles I–III and displayed in Fig. 1 as a function of HT, in different regions of y∗ and for different ∆φ
max. A subset of the data points from selected HT regions are
10-2 10 -1 1
R
∆φ(H
T, y*,
∆φ
max)
0 1 2 0 1 2 0 1 2 0 1 2y* = |y
1−
y
2| / 2
DØ
L = 0.7 fb-1 √s = 1.96 TeVHT: 180 − 205 GeV 270 − 310 GeV 415 − 470 GeV 600 − 680 GeV
∆φmax = 7π/8 ∆φmax = 5π/6 ∆φmax = 3π/4 NLO pQCD + non-perturb. corrections µR = µF = HT / 2 MSTW2008NLO
FIG. 2: (Color online.) The results for R∆φas a function of y∗ in four different regions of HT and for three different ∆φmax
requirements. The error bars indicate the statistical and systematic uncertainties summed in quadrature. The theoretical predictions are shown with their uncertainties.
also shown in Fig. 2, where R∆φ is displayed as a func-tion of y∗ for different choices of ∆φmax. The values of HT and y∗ at which the data points are presented cor-respond to the arithmetic centers of the bins. Figure 1 shows that for all choices of ∆φmaxand in all y∗ regions, R∆φdecreases with HT. In all y∗regions, the HT depen-dence increases towards lower ∆φmax, and for all ∆φmax requirements the HT dependence becomes stronger for smaller y∗. This implies that the y∗ dependence of R
∆φ increases with increasing HT, as shown in Fig. 2.
The theoretical predictions for R∆φare obtained from a pQCD calculation in next-to-leading order (NLO), in αs, with corrections for non-perturbative effects. The latter include contributions from hadronization and the underlying event. The non-perturbative corrections are determined using pythia 6.426 with tunes AMBT1 [23] and DW [21] which use different parton shower and un-derlying event models. The hadronization correction is obtained from the ratio of R∆φ on the parton level af-ter the parton shower and the particle level including all stable particles, both without the underlying event. The underlying-event correction is computed from the ratio of R∆φ computed at the particle level with and with-out underlying event. The total correction is given by the product of the two individual correction factors for hadronization and the underlying event. The total cor-rections vary between +1% and −1% for tune AMBT1 and between +1% and −3% for tune DW. The results ob-tained with the two tunes agree typically within 1% and always within 3% [5]. The central results are taken to be the average values, and the uncertainty is taken to be half
of the difference. As a cross-check, the non-perturbative corrections are also derived with herwig 6.520 [24, 25], using default settings. The herwig and pythia results agree typically within 0.5%, and always within 1% (3%) for ∆φmax= 7π/8 and 5π/6 (for ∆φmax= 3π/4) [5].
The NLO (LO) pQCD prediction for R∆φ is com-puted as the ratio of the NLO (LO) predictions for the numerator and the denominator. The NLO prediction for the numerator (denominator) is obtained from an O(α4
s) (O(α3s)) cross section calculation. These results are computed using fastnlo [26, 27] based on nlo-jet++ [28, 29], in the MS scheme [30] for five active quark flavors. The calculations use the next-to-leading logarithmic (two-loop) approximation of the renormal-ization group equation and αs(MZ) = 0.118 in the ma-trix elements and the PDFs, which is close to the cur-rent world average value of 0.1184 ± 0.0007 [31]. The MSTW2008NLO PDFs [19] are used, and the central choice µ0for the renormalization and factorization scales is µR= µF = µ0= HT/2, which is identical to µ0= pT for inclusive jet and dijet production at LO. The the-oretical predictions are overlaid on the data in Figs. 1 and 2, and some properties are displayed in Fig. 3. The PDF uncertainties are computed using the up and down variations of the 20 orthogonal PDF uncertainty eigen-vectors, corresponding to the 68% C.L., as provided by MSTW2008NLO. The PDF uncertainties are typically 1%, and never larger than 2%. The R∆φ results ob-tained with the CT10 [32] and NNPDFv2.1 [33] PDF parametrizations agree with those for MSTW2008NLO within 2%. The theoretical uncertainties are dominated
1 1.5 2 1 1.5 2
Data / (NLO pQCD + non-pert. correct.)
1 1.5 2 0.2 0.4 0.8 HT (TeV) 0.2 0.4 0.8 0.2 0.4 0.8
DØ
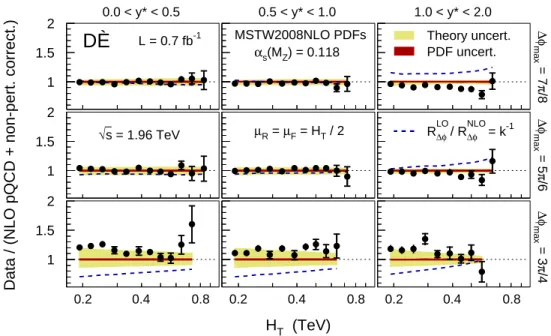
L = 0.7 fb-1 √s = 1.96 TeV 0.0 < y* < 0.5 0.5 < y* < 1.0 1.0 < y* < 2.0 ∆φ max = 7 π /8 ∆φ max = 5 π /6 ∆φ max = 3 π /4 MSTW2008NLO PDFs αs(MZ) = 0.118 µR = µF = HT / 2 Theory uncert. PDF uncert. RLO∆φ / RNLO∆φ = k-1FIG. 3: (Color online.) Ratios of the results of R∆φand the theoretical predictions obtained for MSTW2008NLO PDFs and
αs(MZ) = 0.118. The ratios are shown as a function of HT in different regions of y∗ and for different ∆φmax. The inner
error bars indicate the statistical uncertainties, and the outer error bars the statistical and systematic uncertainties summed in quadrature. The theoretical uncertainty is the PDF and scale uncertainty summed in quadrature. Also shown is the ratio of the LO and NLO pQCD predictions which is the inverse of the NLO k-factor.
by the uncertainties of the pQCD calculations due to the µRand µF dependencies. These are computed as the rel-ative changes of the results due to independent variations of both scales between µ0/2 and 2µ0, with the restriction of 0.5 ≤ µR/µF ≤ 2.0. The uncertainties from the scale dependence are 4–6% for ∆φmax = 7π/8 and 5π/6, and 6–20% for ∆φmax= 3π/4, decreasing with HT. In addi-tion to the scale dependence, the NLO k-factors provide additional information on the convergence of the pertur-bative expansion, and therefore on the possible size of missing higher order contributions. The NLO k-factors are computed as the ratio of the NLO and the LO pre-dictions for R∆φ (k = R∆φNLO/RLO∆φ). Figure 3 shows the inverse of the NLO k-factors and their dependence on y∗ and ∆φmax.
Ratios of data and the theoretical predictions are dis-played in Fig. 3 as a function of HT in all regions of y∗ and ∆φmax. To quantify the agreement, χ2 values are determined that compare data and theory, taking into account the correlations between all uncertainties. The χ2 definition is the same that was used in our recent α
s determinations [12, 34]. Table IV displays the χ2 values for all HT bins within each of the nine kinematic regions in y∗ and ∆φ
max. The results are shown for three dif-ferent choices of µRand µF, including the central choice µR = µF = HT/2 and the combined lower and upper variations, HT/4 and HT. The following discussion dis-tinguishes between the three different kinematic regions, which are given by ∆φmax = 3π/4, by y∗ > 1, and by y∗< 1 with ∆φ
max= 7π/8 or 5π/6.
The region of large azimuthal decorrelations, ∆φmax = 3π/4, is challenging for the theoretical predictions, since it receives large contributions from four-jet final states. These are only modeled at LO by the O(α4
s) calculation for the numerator of R∆φ, which causes the large NLO k-factors (up to 1.5) and the large scale dependence (up to 21%), seen in Fig. 3. In this kinematic region, the central theoretical predictions are consistently below the data (often by 15–25%). Within the large scale uncer-tainty, however, they agree with the data, as the χ2 val-ues for the lower scale choice HT/4 are all consistent with the expectations based on the number of degrees of free-dom (Ndof, which corresponds here to the number of data points), of χ2= N
dof±√2 Ndof.
In the kinematic region y∗> 1, the theoretical predic-tions exhibit a different HT dependence as compared to lower y∗, as seen in Fig. 1. While at lower y∗ the pre-dicted HT dependence of the R∆φdistributions is mono-tonically decreasing, the HT distributions for y∗ > 1 have a local minimum around ≈ 0.5 TeV above which R∆φ increases. For ∆φmax = 5π/6, the theoretical pre-dictions give an adequate description of the data. For ∆φmax = 7π/8, however, the predicted HT dependence differs from that of the measured R∆φ distribution, as quantified by the large χ2 regardless of the scale choice. This is the only kinematic region in (∆φmax, y∗) for which the NLO k-factor is consistently below unity (0.89–0.81) over the entire HT range. This may indicate a poor con-vergence of the perturbative expansion.
kine-TABLE I: The results for R∆φwith their relative uncertainties
for ∆φmax= 7π/8.
HT y∗ R∆φ Stat. uncert. Syst. uncert.
(GeV) (percent) (percent) 180–205 0.0–0.5 2.216 × 10⁻¹ ±0.9 +2.8 −3.0 205–235 0.0–0.5 2.116 × 10⁻¹ ±1.1 +2.6 −2.6 235–270 0.0–0.5 2.000 × 10⁻¹ ±1.5 +2.5 −2.3 270–310 0.0–0.5 1.811 × 10⁻¹ ±2.2 +2.2 −2.2 310–360 0.0–0.5 1.731 × 10⁻¹ ±1.5 +2.0 −2.1 360–415 0.0–0.5 1.641 × 10⁻¹ ±2.4 +1.9 −1.9 415–470 0.0–0.5 1.491 × 10⁻¹ ±1.5 +1.9 −1.9 470–530 0.0–0.5 1.359 × 10⁻¹ ±2.4 +1.9 −1.9 530–600 0.0–0.5 1.206 × 10⁻¹ ±3.2 +2.0 −2.0 600–680 0.0–0.5 1.204 × 10⁻¹ ±5.0 +2.2 −2.1 680–770 0.0–0.5 1.114 × 10⁻¹ ±8.8 +2.4 −2.3 770–900 0.0–0.5 9.699 × 10⁻² ±15.4 +2.5 −2.3 180–205 0.5–1.0 2.311 × 10⁻¹ ±0.9 +2.9 −3.3 205–235 0.5–1.0 2.252 × 10⁻¹ ±1.2 +2.8 −2.9 235–270 0.5–1.0 2.115 × 10⁻¹ ±1.6 +2.6 −2.5 270–310 0.5–1.0 2.085 × 10⁻¹ ±2.3 +2.4 −2.3 310–360 0.5–1.0 1.888 × 10⁻¹ ±1.7 +2.2 −2.2 360–415 0.5–1.0 1.808 × 10⁻¹ ±2.8 +2.1 −2.1 415–470 0.5–1.0 1.686 × 10⁻¹ ±1.8 +2.1 −2.0 470–530 0.5–1.0 1.662 × 10⁻¹ ±2.8 +2.1 −2.1 530–600 0.5–1.0 1.517 × 10⁻¹ ±3.9 +2.2 −2.1 600–680 0.5–1.0 1.318 × 10⁻¹ ±7.3 +2.4 −2.1 680–770 0.5–1.0 1.356 × 10⁻¹ ±13.0 +2.5 −2.2 180–205 1.0–2.0 2.934 × 10⁻¹ ±1.0 +3.8 −4.4 205–235 1.0–2.0 2.850 × 10⁻¹ ±1.3 +3.7 −4.0 235–270 1.0–2.0 2.634 × 10⁻¹ ±2.0 +3.6 −3.4 270–310 1.0–2.0 2.667 × 10⁻¹ ±2.9 +3.3 −2.9 310–360 1.0–2.0 2.502 × 10⁻¹ ±2.3 +3.1 −2.6 360–415 1.0–2.0 2.468 × 10⁻¹ ±4.0 +3.1 −2.6 415–470 1.0–2.0 2.317 × 10⁻¹ ±3.0 +3.1 −2.7 470–530 1.0–2.0 2.320 × 10⁻¹ ±5.2 +3.0 −2.7 530–600 1.0–2.0 2.116 × 10⁻¹ ±8.6 +2.8 −2.8 600–680 1.0–2.0 2.875 × 10⁻¹ ±13.7 +2.7 −2.8
matic regions of 0 < y∗< 0.5 and 0.5 < y∗< 1.0, where the scale dependence is small (< 6%) and the NLO k-factors are above unity but small (1.00 < k < 1.06). In all of those regions, the theoretical predictions give a good description of the data.
In summary, the first measurement of the combined rapidity and pT dependence of dijet azimuthal decorre-lations is presented. The measurement is based on the recently proposed quantity R∆φ, which probes dijet az-imuthal decorrelations in a novel way. It is measured in p¯p collisions at √s = 1.96 TeV as a function of the total transverse momentum HT, the rapidity y∗, and the parameter ∆φmax. For all values of ∆φmax and at fixed HT, dijet azimuthal decorrelations increase with y∗, while they decrease with HT over most of the HT range at fixed y∗. Predictions of NLO pQCD, corrected for non-perturbative effects, give a good description of the data, except in the kinematic region of large dijet rapidity in-tervals y∗> 1 and small decorrelations ∆φ
max= 7π/8.
TABLE II: The results for R∆φwith their relative
uncertain-ties for ∆φmax= 5π/6.
HT y∗ R∆φ Stat. uncert. Syst. uncert.
(GeV) (percent) (percent) 180–205 0.0–0.5 1.439 × 10⁻¹ ±1.1 +2.8 −2.6 205–235 0.0–0.5 1.325 × 10⁻¹ ±1.4 +2.5 −2.5 235–270 0.0–0.5 1.223 × 10⁻¹ ±2.0 +2.3 −2.3 270–310 0.0–0.5 1.097 × 10⁻¹ ±3.0 +2.1 −2.1 310–360 0.0–0.5 1.007 × 10⁻¹ ±2.1 +2.0 −2.0 360–415 0.0–0.5 9.851 × 10⁻² ±3.3 +2.0 −1.9 415–470 0.0–0.5 8.635 × 10⁻² ±2.1 +2.0 −2.0 470–530 0.0–0.5 7.821 × 10⁻² ±3.2 +2.0 −2.0 530–600 0.0–0.5 6.832 × 10⁻² ±4.3 +2.1 −2.1 600–680 0.0–0.5 7.262 × 10⁻² ±6.6 +2.2 −2.3 680–770 0.0–0.5 5.760 × 10⁻² ±12.5 +2.3 −2.4 770–900 0.0–0.5 5.600 × 10⁻² ±20.7 +2.6 −2.7 180–205 0.5–1.0 1.463 × 10⁻¹ ±1.4 +3.2 −2.9 205–235 0.5–1.0 1.396 × 10⁻¹ ±1.6 +2.6 −2.6 235–270 0.5–1.0 1.317 × 10⁻¹ ±2.2 +2.4 −2.5 270–310 0.5–1.0 1.263 × 10⁻¹ ±3.1 +2.2 −2.3 310–360 0.5–1.0 1.139 × 10⁻¹ ±2.3 +2.2 −2.2 360–415 0.5–1.0 1.117 × 10⁻¹ ±3.6 +2.1 −2.1 415–470 0.5–1.0 1.016 × 10⁻¹ ±2.4 +2.1 −2.1 470–530 0.5–1.0 9.993 × 10⁻² ±3.8 +2.1 −2.1 530–600 0.5–1.0 9.414 × 10⁻² ±5.1 +2.2 −2.2 600–680 0.5–1.0 8.566 × 10⁻² ±9.2 +2.2 −2.3 680–770 0.5–1.0 7.369 × 10⁻² ±18.2 +2.3 −2.5 180–205 1.0–2.0 1.926 × 10⁻¹ ±1.3 +4.0 −3.5 205–235 1.0–2.0 1.840 × 10⁻¹ ±1.8 +3.7 −3.5 235–270 1.0–2.0 1.709 × 10⁻¹ ±2.6 +3.3 −3.4 270–310 1.0–2.0 1.716 × 10⁻¹ ±3.9 +3.0 −3.2 310–360 1.0–2.0 1.611 × 10⁻¹ ±3.0 +3.0 −3.1 360–415 1.0–2.0 1.600 × 10⁻¹ ±5.2 +3.0 −3.1 415–470 1.0–2.0 1.436 × 10⁻¹ ±4.0 +3.0 −3.0 470–530 1.0–2.0 1.518 × 10⁻¹ ±6.7 +2.9 −3.1 530–600 1.0–2.0 1.391 × 10⁻¹ ±11.0 +2.8 −3.1 600–680 1.0–2.0 2.034 × 10⁻¹ ±17.2 +2.9 −3.2
We thank the staffs at Fermilab and collaborating in-stitutions, and acknowledge support from the DOE and NSF (USA); CEA and CNRS/IN2P3 (France); MON, NRC KI and RFBR (Russia); CNPq, FAPERJ, FAPESP and FUNDUNESP (Brazil); DAE and DST (India); Col-ciencias (Colombia); CONACyT (Mexico); NRF (Ko-rea); FOM (The Netherlands); STFC and the Royal So-ciety (United Kingdom); MSMT and GACR (Czech Re-public); BMBF and DFG (Germany); SFI (Ireland); The Swedish Research Council (Sweden); and CAS and CNSF (China).
[1] Rapidity y is related to the polar scattering angle θ with respect to the proton beam direction by y =
1
2ln [(1 + β cos θ)/(1 − β cos θ)], where β is defined as
the ratio of the magnitude of momentum and energy, β = |~p|/E. In 2 → 2 processes, the variable y∗
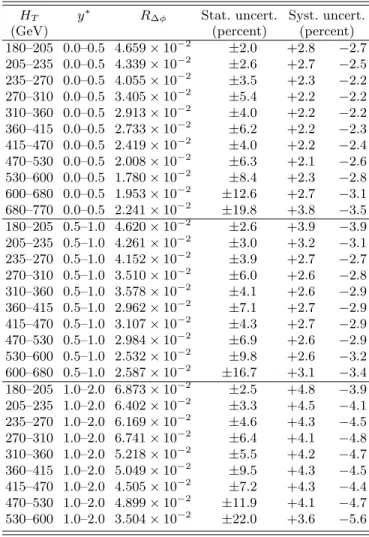
corre-TABLE III: The results for R∆φwith their relative
uncertain-ties for ∆φmax= 3π/4.
HT y∗ R∆φ Stat. uncert. Syst. uncert.
(GeV) (percent) (percent) 180–205 0.0–0.5 4.659 × 10⁻² ±2.0 +2.8 −2.7 205–235 0.0–0.5 4.339 × 10⁻² ±2.6 +2.7 −2.5 235–270 0.0–0.5 4.055 × 10⁻² ±3.5 +2.3 −2.2 270–310 0.0–0.5 3.405 × 10⁻² ±5.4 +2.2 −2.2 310–360 0.0–0.5 2.913 × 10⁻² ±4.0 +2.2 −2.2 360–415 0.0–0.5 2.733 × 10⁻² ±6.2 +2.2 −2.3 415–470 0.0–0.5 2.419 × 10⁻² ±4.0 +2.2 −2.4 470–530 0.0–0.5 2.008 × 10⁻² ±6.3 +2.1 −2.6 530–600 0.0–0.5 1.780 × 10⁻² ±8.4 +2.3 −2.8 600–680 0.0–0.5 1.953 × 10⁻² ±12.6 +2.7 −3.1 680–770 0.0–0.5 2.241 × 10⁻² ±19.8 +3.8 −3.5 180–205 0.5–1.0 4.620 × 10⁻² ±2.6 +3.9 −3.9 205–235 0.5–1.0 4.261 × 10⁻² ±3.0 +3.2 −3.1 235–270 0.5–1.0 4.152 × 10⁻² ±3.9 +2.7 −2.7 270–310 0.5–1.0 3.510 × 10⁻² ±6.0 +2.6 −2.8 310–360 0.5–1.0 3.578 × 10⁻² ±4.1 +2.6 −2.9 360–415 0.5–1.0 2.962 × 10⁻² ±7.1 +2.7 −2.9 415–470 0.5–1.0 3.107 × 10⁻² ±4.3 +2.7 −2.9 470–530 0.5–1.0 2.984 × 10⁻² ±6.9 +2.6 −2.9 530–600 0.5–1.0 2.532 × 10⁻² ±9.8 +2.6 −3.2 600–680 0.5–1.0 2.587 × 10⁻² ±16.7 +3.1 −3.4 180–205 1.0–2.0 6.873 × 10⁻² ±2.5 +4.8 −3.9 205–235 1.0–2.0 6.402 × 10⁻² ±3.3 +4.5 −4.1 235–270 1.0–2.0 6.169 × 10⁻² ±4.6 +4.3 −4.5 270–310 1.0–2.0 6.741 × 10⁻² ±6.4 +4.1 −4.8 310–360 1.0–2.0 5.218 × 10⁻² ±5.5 +4.2 −4.7 360–415 1.0–2.0 5.049 × 10⁻² ±9.5 +4.3 −4.5 415–470 1.0–2.0 4.505 × 10⁻² ±7.2 +4.3 −4.4 470–530 1.0–2.0 4.899 × 10⁻² ±11.9 +4.1 −4.7 530–600 1.0–2.0 3.504 × 10⁻² ±22.0 +3.6 −5.6
sponds to the absolute value of the rapidities of the two jets in the dijet center-of-mass frame frame (see Ref. [5]). [2] V. M. Abazov et al., D0 Collaboration, Phys. Rev. Lett.
94, 221801 (2005).
[3] V. Khachatryan et al., CMS Collaboration, Phys. Rev. Lett. 106, 122003 (2011).
[4] G. Aad et al., ATLAS Collaboration, Phys. Rev. Lett. 106, 172002 (2011).
[5] M. Wobisch et al., submitted to J. High Energy Phys., arXiv:1211.6773 [hep-ph].
[6] G. C. Blazey et al., in: U. Baur, R. K. Ellis, and D. Zeppenfeld (Eds.), Proceedings of the Workshop: QCD
and Weak Boson Physics in Run II, Fermilab-Pub-00/297 (2000).
[7] C. Buttar et al., in: G. Belanger et al. (Eds.), Les
Houches 2007, Physics at TeV colliders, arXiv:0803.0678 [hep-ph], section 9.
[8] V. M. Abazov et al., D0 Collaboration, Nucl. Instrum. Methods Phys. Res. A 565, 463 (2006).
[9] V. M. Abazov et al., D0 Collaboration, Phys. Rev. Lett. 103, 191803 (2009).
[10] V. M. Abazov et al., D0 Collaboration, Phys. Lett. B 693, 531 (2010).
[11] V. M. Abazov et al., D0 Collaboration, Phys. Lett. B 704, 434 (2011).
[12] V. M. Abazov et al., D0 Collaboration, Phys. Lett. B 718, 56 (2012).
[13] V. M. Abazov et al., D0 Collaboration, Submitted to Phys. Lett. B, arXiv:1209.1140 [hep-ex].
[14] V. M. Abazov et al., D0 Collaboration, Phys. Rev. Lett. 101, 062001 (2008).
[15] V. M. Abazov et al., D0 Collaboration, Phys. Rev. D 85, 052006 (2012).
[16] T. Sj¨ostrand et al., Comput. Phys. Commun. 135, 238 (2001).
[17] R. Brun and F. Carminati, CERN Program Library Long Writeup W5013, 1993.
[18] T. Gleisberg et al., J. High Energy Phys. 02, 007 (2009). [19] A. D. Martin et al., Eur. Phys. J. C 63, 189 (2009). [20] P. M. Nadolsky et al., Phys. Rev. D 78, 013004 (2008). [21] M. G. Albrow et al., TeV4LHC QCD Working Group,
hep-ph/0610012.
[22] Supplementary material is available in the online version of this Letter available at doi:10.1016/j.physletb.YYYY.MM.AAA.
[23] G. Brandt in: M. Diehl, J. Haller, T. Sch¨orner-Sadenius and G. Steinbr¨uck (Eds.), in 5th Conference: Physics at
the LHC 2010, DESY-PROC-2010-01 (2010).
[24] G. Corcella et al., J. High Energy Phys. 01, 010 (2001). [25] G. Corcella et al., hep-ph/0210213.
[26] T. Kluge, K. Rabbertz, and M. Wobisch, hep-ph/0609285.
[27] M. Wobisch et al., fastNLO Collaboration, arXiv:1109.1310 [hep-ph].
[28] Z. Nagy, Phys. Rev. D 68, 094002 (2003). [29] Z. Nagy, Phys. Rev. Lett. 88, 122003 (2002).
[30] W. A. Bardeen, A. J. Buras, D. W. Duke, and T. Muta, Phys. Rev. D 18, 3998 (1978).
[31] J. Beringer et al. (Particle Data Group), Phys. Rev. D 86, 010001 (2012).
[32] H. L. Lai et al., Phys. Rev. D 82, 074024 (2010). [33] R. D. Ball et al., Nucl. Phys. B 849, 296 (2011). [34] V. M. Abazov et al., D0 Collaboration, Phys. Rev. D 80,
111107 (2009).
TABLE IV: The χ2
values between data and theory for MSTW2008PDFs and αs(MZ) = 0.118 and for different
choices of µR and µF. The results are shown for each of
the nine kinematic regions, defined by the y∗and ∆φmax
re-quirements, combining all HT bins inside those regions.
y∗ ∆φ max Ndof χ 2 for µR= µF = range HT/4 HT/2 HT 0.0–0.5 7π/8 12 15.1 7.1 12.7 0.0–0.5 5π/6 12 15.7 10.9 20.9 0.0–0.5 3π/4 11 13.1 44.2 104.5 0.5–1.0 7π/8 11 11.8 6.9 8.6 0.5–1.0 5π/6 11 5.6 4.0 12.6 0.5–1.0 3π/4 10 15.4 26.9 60.2 1.0–2.0 7π/8 10 29.7 24.4 19.8 1.0–2.0 5π/6 10 9.3 10.8 10.7 1.0–2.0 3π/4 9 10.3 23.1 45.5