HAL Id: hal-02980872
https://hal.archives-ouvertes.fr/hal-02980872
Submitted on 7 Jun 2021
HAL is a multi-disciplinary open access
archive for the deposit and dissemination of
sci-entific research documents, whether they are
pub-lished or not. The documents may come from
teaching and research institutions in France or
abroad, or from public or private research centers.
L’archive ouverte pluridisciplinaire HAL, est
destinée au dépôt et à la diffusion de documents
scientifiques de niveau recherche, publiés ou non,
émanant des établissements d’enseignement et de
recherche français ou étrangers, des laboratoires
publics ou privés.
for Pre-spaceflight Muscle Conditioning : a Systematic
Review and Meta-Analysis
Grant Ralston, Lon Kilgore, Frank Wyatt, Frédéric Dutheil, Patrick Jaekel,
Duncan Buchan, Julien Steven Baker
To cite this version:
Grant Ralston, Lon Kilgore, Frank Wyatt, Frédéric Dutheil, Patrick Jaekel, et al.. Re-examination
of 1- vs. 3-Sets of Resistance Exercise for Pre-spaceflight Muscle Conditioning : a Systematic Review
and Meta-Analysis. Frontiers in Physiology, Frontiers, 2019, 10, 864/25 p. �10.3389/fphys.2019.00864�.
�hal-02980872�
SYSTEMATIC REVIEW published: 24 July 2019 doi: 10.3389/fphys.2019.00864
Frontiers in Physiology | www.frontiersin.org 1 July 2019 | Volume 10 | Article 864
Edited by: Richard D. Boyle, National Aeronautics and Space Administration (NASA), United States Reviewed by: Satoshi Iwase, Aichi Medical University, Japan Sonia Julia-Sanchez, Ministerio de Educación Cultura y Deporte, Spain *Correspondence: Grant W. Ralston [email protected]
Specialty section: This article was submitted to Environmental, Aviation and Space Physiology, a section of the journal Frontiers in Physiology Received: 30 January 2019 Accepted: 20 June 2019 Published: 24 July 2019 Citation: Ralston GW, Kilgore L, Wyatt FB, Dutheil F, Jaekel P, Buchan DS and Baker JS (2019) Re-examination of 1-vs. 3-Sets of Resistance Exercise for Pre-spaceflight Muscle Conditioning: A Systematic Review and Meta-Analysis. Front. Physiol. 10:864. doi: 10.3389/fphys.2019.00864
Re-examination of 1- vs. 3-Sets of
Resistance Exercise for
Pre-spaceflight Muscle Conditioning:
A Systematic Review and
Meta-Analysis
Grant W. Ralston1*, Lon Kilgore2, Frank B. Wyatt3, Frédéric Dutheil4,5, Patrick Jaekel6,7, Duncan S. Buchan1and Julien S. Baker1
1Applied Physiology Research Laboratory, School of Science and Sport, Institute of Clinical Exercise and Health Sciences,
University of the West of Scotland, Hamilton, Scotland,2Kilgore Academy, Azle, TX, United States,3Department of Athletic
Training and Exercise Physiology, Midwestern State University, Wichita Falls, TX, United States,4Université Clermont
Auvergne, CNRS, LaPSCo, Physiological and Psychosocial Stress, University Hospital of Clermont–Ferrand, CHU Clermont–Ferrand, Preventive and Occupational Medicine, WittyFit, Clermont–Ferrand, France,5Faculty of Health, School of
Exercise Science, Australian Catholic University, Melbourne, VIC, Australia,6Space Medicine Team, European Astronaut
Centre (EAC), European Space Agency, Cologne, Germany,7KBR, Cologne, Germany
Background: Recommendations on resistance training (RT) set-volume protocols in preparation for spaceflight muscular strength conditioning remains equivocal. A meta-analysis was performed on the effects of single-set (S), or three-set (M3) RT on muscular strength per exercise for different body segments and joint types (multi-joint and single-joint).
Methods: Computerized searches were performed on PubMed, MEDLINE and SPORTDiscusTM. Twelve studies were considered appropriate according to pre-set eligibility criteria. Outcomes analyzed were pre-to-post-muscular strength change on; multi-joint and single-joint combined; upper body only; lower body only; multi-joint exercises only; single-joint exercises only.
Results: Upper body exercise analysis on combined subjects and untrained subjects only reported greater but not significant strength gains with M3 (ES 0.37; 95% CI 0.09–0.82; P = 0.11 and ES 0.35; 95% CI−0.49 to 1.19; P = 0.42). Trained only subjects reported superior strength gains with M3 (ES 0.63; 95% CI 0.34–0.92; P = <0.0001). Lower body exercise on combined subjects and untrained subjects only reported superior strength gains with M3 (ES 0.35; 95% CI 0.10–0.60; P = 0.006 and ES 0.49; 95% CI 0.14–0.83; P = 0.005). Trained subjects only observed greater but not significant strength gains with M3 (ES 0.18; 95% CI −0.23 to 0.58; P = 0.39). Multi-joint exercise on combined subjects reported greater strength gains with M3 (ES 0.83; 95% CI 0.14–1.51; P =0.02). Trained only subjects reported greater strength gains with M3 (ES 0.52; 95% CI 0.10–0.94; P = 0.02). Single-joint exercise on combined subjects and untrained only observed greater strength gains for M3 (ES 0.49; 95% CI 0.26–0.72; P = <0.0001 and ES 0.56; 95% CI 0.21–0.91; P = 0.002). Trained only subjects reported greater but not significant strength gains with M3 (ES 0.37; 95% CI −0.01 to 0.75; P = 0.06).
Conclusion: For astronauts in space-flight preparation, the findings suggest that M3 training appears to be preferable over S for developing muscular strength. Nevertheless, depending on the physical conditioning of the crew member or tight pre-flight scheduling, S is still able to provide a positive strength training stimulus.
Keywords: resistance training and muscular strength, resistance training and training volume, single vs.multiple-sets, one vs.multiple-sets and muscular strength, one vs.three-sets and muscular strength
INTRODUCTION
Recent advances in space technology, space medicine and collaboration among international space agencies, have contributed significantly toward sending humans deeper into interplanetary space. It is predicted that future crewed missions will focused on deeper space transit; however, at present, this has not transpired due to the significant demands placed on the human body. Governments and space agencies, however, are determined to achieve long duration space exploration and for this to be achieved the astronauts in-flight physical conditioning must be optimal for mission functionality. Astronauts, as part of pre-flight preparation, follow appropriate resistance training (RT) protocols that prepare them for microgravity (µG) environments. Currently, astronauts live and work in extreme environments but significant differences between low-earth orbit operations and exploring interplanetary space exist. Astronauts presently perform low-earth orbit operations in extreme environments including µG, confinement, radiation exposure, and social isolation. These extreme conditions significantly alter the physiological demands experienced by International Space Station (ISS) astronauts relative to terrestrial dwelling. Spaceflight poses unique physiological deconditioning and maladaptation due to prolonged exposure to µG, including significant muscle degradation and impaired skeletal functioning (Convertino, 1990; Stein, 2013; Bloomberg et al., 2016).
Exposure to a µG environment has been shown to have significant adverse effects on skeletal muscle tissue including changes in expression of structural, metabolic, and contractile proteins that adjust the function of tissue (LeBlanc et al., 1996; Fitts et al., 2001; Trappe et al., 2001; Adams et al., 2003; Carpenter et al., 2010). A reduction in muscle strength also leads to a reduction in applied mechanical forces to bones that may intensify the loss of bone mineral content that occurs due to the lack of ground reaction forces in a µG environment. As a result, astronauts will be physically weaker with bones more fragile when they land. These extreme effects of µG on muscle
Abbreviations:ACSM, American College of Sports Medicine; Chi2, Chi-square; CI, 95% confidence intervals; d.f., Degrees of freedom; ES, Effect size; I2,
I-squared index test; ISS, International Space Station; IV, Inverse variance; M, Mean; M3, Three-set; MVC, Maximum voluntary contraction; NASA, National Aeronautics and Space Administration; n, Sample size number; P, Probability; PEDro, Physiotherapy evidence database; PRISMA, Preferred reporting items for systematic reviews and meta-analyses; Q, Cochran Q; RAN, Randomized trials; RCTs, Randomized control trials; RevMan, Review manager; RT, Resistance training; S, One-set; SD, Standard deviation; SE, Standard error; SEM, Standard error of measurement; SMD, Standardized mean difference; Tau2, Tau-square; µG,
Microgravity; 1RM, One repetition maximum.
tissue in humans raised concerns by the National Aeronautics and Space Administration (NASA) about the structural and functional deconditioning in muscles that led to astronauts having; (1) loss of strength to perform emergency egress when landing in partial µG and; (2) the inability to perform and endure occupational activities in µG which vary in the magnitude of work-related loading and intensity (Adams et al., 2003).
Widrick et al. (1999) suggested that exposure to two and a half weeks of µG led to an overall eight per cent reduction in fiber diameter or up to 15% in the cross-sectional area of slow twitch muscle fibers of the human soleus.LeBlanc et al. (2000)reported that during a 17 day mission significant post-flight changes occurred in muscle volume of between three-to-ten per cent in all muscle regions except hamstrings compared to baseline. LeBlanc and colleagues also observed significant decreases in muscle volume of between 5 and 17% in all muscle groups except the neck during Mir missions of 16– 28 week durations. In addition, Trappe et al. (2009) reported losses of muscle strength and approximately two per cent muscle volume per month and five per cent in peak muscle power per month. Similarly,Gopalakrishnan et al. (2010)stated that up to four per cent loss of strength at the knee per month and a loss of approximately three per cent in elbow strength per month. This reduction in muscle activity during spaceflight compromises muscle mass and strength and could have significant consequences related to the success of long duration space exploration.
These decremental changes have driven the pursuit of adequate pre-spaceflight physical training protocols and suitable countermeasures, which has included electrical stimulation, artificial gravity, nutritional therapy, pharmacologic, and various forms of exercise interventions (Lang et al., 2017).Convertino and Sandler (1995) state that physical exercise is central to inhibit unloading-induced remodeling of the muscular and skeletal system. However, sustaining muscle and skeletal bone health remains a significant obstacle in human space exploration. Current pre-flight prescription of RT is primarily established from evidence-driven terrestrial RT and experience gained during previous missions. This has led to disparities in the physical conditioning of astronauts as no such established exercise prescription has been employed that would sustain in-flight muscle strength and functioning. Unfortunately, there does not appear to be a collectively accepted method regarding pre-flight RT prescription that all space agencies adhere too in preparation for space transit. With the daily set-volume, resistance loading, exercise type, and training frequency vary from the space agency to space agency.
Ralston et al. 1- vs. 3-Sets on Strength: A Meta-Analysis
The European Space Agency strategy for astronaut’s pre-flight preparation focus on individualized training approaches that incorporate three stages (Kozlovskaya et al., 1995); (1) adaptation phase that acquaints individuals with ISS exercise hardware; (2) main phase that counteracts physiological adaptation to µG and; (3) preparation for re-entry and terrestrial landing. The RT prescription comprises of both multi-joint and single-joint exercises (squats, deadlifts, bench press, crunches, and heel raises) altering from training session to training session (Hackney et al., 2015). The Japan Aerospace Exploration Agency implements a pre-flight programme that consists of individualized programmes that are related to the anticipated mission tasks that crew members would perform (Loehr et al., 2015). The Canadian Space Agency uses a three-block approach with each stage lasting 4 weeks with set-volume for strength between two-to-five sets (Loehr et al., 2015). NASA implement increased set-volume (MS) with astronauts performing both concentric and eccentric actions that are prescribed by the American College of Sports Medicine (Garber et al., 2011).
Garber et al. (2011)constructed the position statement that provides direction on the prescription of exercise for apparently healthy adults. In the 2011 position statement, multiple-sets are cited for experienced trainees and competitive athletes that are comparable to astronauts’ fitness status at the end of pre-flight conditioning. However, Stein (2013) argues that astronauts at their physical peak may have more to lose during in-flight unloading because of µG. Matsumoto et al. (2011)
reported that astronauts who performed walking as part of the pre-flight protocol lost less body weight than those that performed intense exercise protocols. It could be debated that if astronaut’s pre-flight physical conditioning is in an over-compensated state, they may experience more significant weight loss during spaceflight that may be detrimental. Consequentially, the set-volume training dose needed for astronauts to be in optimal condition requires further investigation. Daily RT set-volume has been an often-contested issue, established from different recommendations that support MS programming. However, in preparation for spaceflight with µG environments, it is perhaps more advantageous to implement S programming in which to develop functional strength that does not facilitate the same level of in-flight deconditioning and weight loss.
Published RT meta-analytical evidence is equivocal on what set-volume elicits superior strength improvements, with disparity existing in the recommendations (Table 1). Several meta-analytical studies have been performed that support the use of multiple-sets (MS) programmes compared to single-set (S) per exercise on untrained and trained subjects (Rhea et al., 2002b, 2003; Peterson et al., 2004; Wolfe et al., 2004; Krieger, 2009; Fröhlich et al., 2010). However, due to the absence of available studies, most meta-analytical evidence is drawn from S and MS (two-eight-sets per exercise) that does not fully quantify a dose-response relationship. Several meta-analyses that support increased set-volume (Rhea et al., 2002b, 2003; Peterson et al., 2004; Wolfe et al., 2004) include small ESs that potentially drifted toward greater set-volume. For example,Wolfe et al. (2004)inferred that athletes should perform
eight-sets per muscle group to develop strength. This was established from only six effect sizes (ES) and data obtained came from one study and any conclusions derived concerning the direct impact of eight-sets compared to any other number would be unreliable. Besides, none have provided a specific set number for strength development and have pooled findings from studies that have combined different exercise types to generate ES. This, unfortunately, produces issues with daily RT set-volume recommendations, as most meta-analytical evidence have pooled data from studies that have combined exercise types (multi-joint and single-(multi-joint exercises) from different population groups (untrained and trained) utilizing a broad age ranges (18–65).
Although meta-analyses regarding the effects of S vs. MS have been published (Rhea et al., 2002b, 2003; Peterson et al., 2004; Wolfe et al., 2004; Krieger, 2009; Fröhlich et al., 2010), with support given for the application of MS to develop strength or muscular hypertrophy. Disagreement remains regarding the need to perform additional sets for increasing muscular strength. Published critical reviews (Smith and Bruce-Low, 2004; Winett, 2004; Otto and Carpinelli, 2006; Carpinelli, 2012; Fisher, 2012), have examined the validity of published meta-analyses on set-volume, concluding that reported data do not fully support a dose-response relationship between the additional number of sets and strength gains. These reviews identified confounding factors including the presence of low-quality studies, variations in subject characteristics and inconsistencies in experimental designs that generate spurious inferences regarding muscular strength increases.
Currently, no meta-analytical evidence is available that examines the effect of daily set-volume on body segmentations (upper or lower body) or specific joint types (MJ and SJ) on muscle strength change. In the context of pre-flight RT, it is critical that the magnitude of daily RT set-volume is examined to prepare astronauts for space transit. The purpose of this review and meta-analysis, therefore, was four-fold: (1) to re-examine the effects of RT volume (S or M3) of ST on muscular strength per exercise; (2) to determine if specific set-volume (S vs. M3) produce different strength gains when multi-joint exercises are compared with single-joint exercises; (3) to investigate if the magnitude of strength gain differs between multi-joint and single-joint exercises by population group (trained vs. untrained) and body segmentations (upper vs. lower body). The final objective; (4) is to provide a perspective on developing muscular strength that provides recommendations on daily RT set-volume for pre-flight strength development. Based on previous evidence (Rhea et al., 2002b, 2003; Peterson et al., 2004; Wolfe et al., 2004; Krieger, 2009), we hypothesized that there would be superior pre-to-post-training strength gains with M3 RT compared to S.
METHODS
Literature Search
This meta-analysis was performed using the recommendations and criteria defined in the Preferred Reporting Items for Systematic Reviews and Meta-Analyses (PRISMA) statement (Liberati et al., 2009). Computer-aided searches were conducted using the following databases: MEDLINE (PubMed),
TABLE 1 | Summary of previous meta-analyses on set-volume and strength development.
References Study objective Exercise type Summary findings
Rhea et al., 2003 Identify a dose-response relationship for intensity, frequency, and volume of training
MJ and SJ comb Untrained and trained subjects should perform four-sets per muscle group.
Peterson et al., 2004 MJ and SJ comb Athletes should perform eight-sets per muscle group
for athletes. Peterson et al., 2005 Review of recent evidence on strength
development research
MJ and SJ comb Untrained subjects should perform four-sets per muscle group. Trained subjects should perform eight-sets per muscle group.
Wolfe et al., 2004 Examination of single-set vs. multiple-set on muscle strength
MJ and SJ comb MS (two-five sets) elicit superior strength gains for trained subjects. Untrained subjects should perform S initially.
Krieger, 2009 Comparison of the effects S-vs.-MS per
exercise have on strength
MJ and SJ comb Maximal strength gains are elicited with two-three-sets per exercise than S, in both untrained and untrained subjects. Fröhlich et al., 2010 Comparison of the effects of S-vs.-MS for
increasing maximal strength levels
MJ and SJ comb S regimes are equivalent to MS training for increasing strength in the initial period. MS training is superior overextended periods.
N, number; MJ, multi-joint; SJ, single-joint; comb, combined; MS, multiple-sets; S, single-joint.
SWETSWISE, EMBASE, and SPORTDiscusTM. The period of search history assessed was inclusive to August 2018. An extensive manual search and cross-referencing of journals, reference lists, was also performed with citations and abstracts from studies published in foreign language journals and scientific conferences were excluded. Descriptive terms and keywords that were used to retrieve studies included: “resistance training and muscular strength,” “resistance training and training volume,” “single vs. multiple-sets,” and “one vs. multiple-sets and muscular strength.” Boolean operators, including AND, OR, and NOT, were used to focus literature searches with literature searches reduced to studies involving humans only.
As a result of systematic computerized database searches, journals were retrieved from 1960 to August 2014 in where S vs. M3 were examined, from different population demographics (trained, untrained, male, and female subjects). After preliminary literature searching, reference lists of articles were screened for additional studies of relevance on muscular strength development. During the first selection round, appropriate study titles were screened for relevance with the inclusion of either resistance training or training volume. In the second selection round, GR, LK, and DB read the abstracts and then selected the article if resistance training for muscle strength was evaluated before and after a minimum RT intervention period of 4-weeks. This minimum time course was chosen due to reports of muscular adaptations in response to RT (Stock et al., 2016). In the third selection round, full articles were read.
Eligibility Criteria
Studies were deemed eligible in this review if they met the following conditions; (a) human subjects free from chronic disease, muscular, or orthopedic injuries, or physical limitations; (b) trained and untrained adult male or female subjects between 18 and 45 years; (c) subject’s descriptive characteristics included in the report (height, weight, training status, and training experience); (d) subjects training at least one primary muscle group-pectoralis major, deltoids (anterior, lateral, posterior); bicep brachii, or tricep brachii;
latissimus dorsi; quadriceps (vastus medialis, vastus intermedius, vastus lateralis, rectus femoris); hamstrings (bicep femoris, semitendinosus, semimembranosus; (e) at least one performed pre-to-post measure of muscular strength; (f) studies that compared S vs. M3 performing resistance exercise only (active control group); (g) training protocols lasting a minimum of 4-weeks; (h) and appropriate information to calculate training ES. This meta-analysis included both randomized trials (RAN) and randomized control trials (RCTs) that observed the intervention treatments using stratified resistance exercises with S vs. M3. RAN allocation ensures no systematic variances between the intervention groups; however, no control group may influence the assessment of outcomes (Schünemann et al., 2013). RCTs are a more specific method for defining a cause-effect relationship between treatments and outcomes.
Search Strategy
Titles and abstracts of retrieved journal articles were independently evaluated for content relevance by three reviewers (GR, LK, and DB). Abstracts that contained the necessary information regarding the pre-set inclusion and exclusion criteria were retrieved and independently evaluated for full-text eligibility. Potential studies that did not have descriptive data tables but presented pre- to post-primary strength data in the form of figures resulted in extraction using WebPlot-Digitiser (Web Plot WebPlot-Digitiser V.3.11. Texas, USA: AnkitRohatgi, 2017). Where differences between reviewers (GR, LK, and DB) occurred then additional dialogue and agreements were made by consensus. Ten randomly selected studies underwent post-hoc reassessment with the extracted results compared. For each reviewer coder drift was set at <10% in all cases, and inter-rater (GR and DB) reliability was >95%. Studies were read and individually coded for the following variables; (1) subject’s descriptive characteristics, including age, training experience, and sample size; (2) programme characteristics including training frequency, number of sets performed per exercise, the number of reps performed per exercise; (3) measurement of pre-post-strength outcome(s) and; (4) treatment effects of
Ralston et al. 1- vs. 3-Sets on Strength: A Meta-Analysis
mean (M) and SD values of changes in pre- and post-strength outcomes for RT intervention and control groups.
Assessment of Methodological Quality of
Studies
Internal validity of retrieved studies was evaluated using the Physiotherapy Evidence Database (PEDro) scale. The PEDro scale (Verhagen, 1998; Maher et al., 2003) has 11 measures, with a maximum score of ten. However, a maximum score from the PEDro scale, in this case, was eight, as the therapists, assessors and technicians conducting the interventions cannot be blinded.
Studies were included in this analysis if they had a PEDro score of ≥ four, as this was considered as having acceptable internal validity. Methodological quality was independently assessed by reviewers (GR, LK, and DB). Variances of judgement concerning the scoring of the journal articles were agreed between reviewers through consensus.
Calculation of Effect Size
Descriptive statistics were calculated to describe and summarize the results of the systematic review process. Data of individual study characteristics were entered into a spreadsheet (Microsoft, Redmond, WA, USA) to compare pre-post-strength outcomes
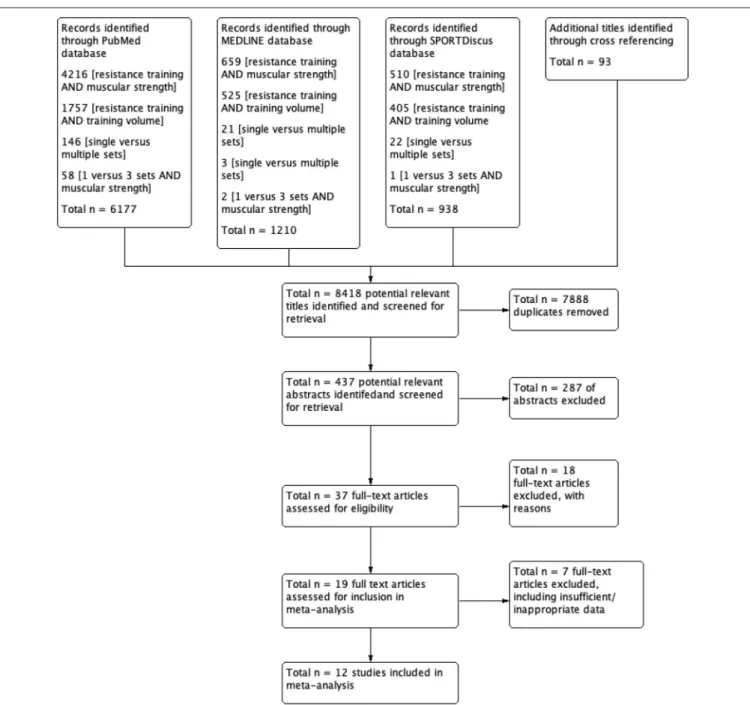
FIGURE 1 | The flow of journal articles through the systematic review process.
of each study for coding, review and data reference. Descriptive statistics containing sample size (n), mean (M) and SD were extracted from each study. This provided data for the mean differences in pre- to post-intervention between groups (e.g., S and M3) on several strength outcomes. Muscular strength was deemed a continuous data variable; therefore, the standardized mean difference (SMD) with 95% confidence intervals (95% CI) were used to establish the ES measures. For each strength outcome variable, a SD score was calculated by using Cohen’s d index of a single ES (di = [M1–M2]/SDpi) (Cohen, 1998), where d = ES, i = individual study, M1 = pre-intervention mean, M2 = post-intervention mean, and SDp = pooled standard deviation. The SD was calculated by summing the extracted pre-intervention and post-intervention SDs and dividing by two. If the standard error of measurement (SEM) of the mean was specified, the SD was calculated using the formula (SD = SEM∗square root of N) (Howell, 2012). Separate ES
was weighted to account for individual sample sizes. If a study reported, exact P-values for a change of strength, the SD of change was calculated. Studies that did not report, exact P-values, the SD of change was calculated using the pre- and post-intervention SDs. Due to diverse population demographics and methods with the included studies, a random-effects inverse variance (IV) using the DerSimonian-Laird method (DerSimonian and Laird, 1986) was applied with the effects measure of SMD. If a study had numerous time-periods, only the pre- to post-intervention strength outcomes were extracted and entered for analysis. The data was then used to compute ES estimates and CI. For each strength measure, an ES was calculated as the pre- to post-intervention change, divided by the pre-intervention SD (Morris and DeShon, 2002).
Meta-Essentials (Suurmond et al., 2017) was initially used to input pre-post-strength outcome data with each row denoted as an individual ES for a treatment group. If treatment groups had multiple ES, then each ES was coded in a separate row. This aided with the computation of ES, SEM, and study size to allocate appropriate weight to each study, and estimate a study effect. To
determine the significance of the ES, the chi-square (Chi2) test
was performed in each model used. For the statistical analyses, Review Manager (RevMan) version 5.3.5 was used to calculate the difference in SD of post-intervention strength outcomes and the generation of forest plots. Data needed were either; (1) means and SDs (pre- and strength change); (2) CI data for pre- to post-strength change for each treatment group (3) P-values for pre- to post-strength difference for each treatment group, or if only the level of significance was available, and; (4) default P-values (e.g., P ≤ 0.05 becomes P ≤ 0.49, P ≤ 0.01 becomes P ≤ 0.0099, and P ≥not significant becomes P ≥ 0.05).
The random-effects model was implemented to allow for variability between the studies due to high heterogeneity. A random-effects model conceptualized the existing series of studies under investigation to be a random sample selected from a larger population of studies. In the random-effects model meta-analysis, there are two sources of variability; (1) variability of the effect parameters, and; (2) sampling variability of experimental units (i.e., subjects) into studies. If individual parameter estimates of each study lead to high levels of heterogeneity, the random-effects analysis considers the “true variance” (or the remaining unmeasured random-effects between studies) in addition to the modeled between-study variances and sampling error typically assumed in fixed-effects models. It should be highlighted that the random-effects model typically gives less specific estimates and larger CIs.
Heterogeneity and Risk of Bias
To evaluate heterogeneity between studies, the I-squared (I2) index test and Cochran Q (Q) heterogeneity statistic were applied. The I2test was used to assess the degree of heterogeneity
for each outcome, with an I2
> 50% applied to indicate heterogeneity. Non-significance signifies that the results of the different studies were similar (P ≥ 0.05) and P < 0.05 denotes a statistically significant effect. The Q statistic uses the sum of squared deviations of each estimate resulting from the pooled estimate and weights the contribution of each study. The Q
TABLE 2 | Inclusion and exclusion criteria.
Inclusion criteria Exclusion criteria
One or more muscle groups used duration intervention and appropriate strength assessment (i.e., single-joint exercises, e.g., leg curl)
Small subject sample groups (e.g., n < six) The minimum duration of the training intervention is 4-weeks; preferably
longitudinal studies (>12-weeks)
The use of either legal or illegal ergogenic aids or supplementation prior to or during interventions
It would be desirable if there were an appropriate control group included within the research design with subjects randomly assigned to groups
Training order variation throughout the intervention Training programme supervised throughout the intervention. Ensuring that
interventions are of similar order and if applicable inter-set recovery periods standardized for multiple-sets
No quasi RCT or narrative studies/reviews to be included
The warm-up is standardized between treatment groups Subjects below 18 or above 45 years of age
Appropriate criteria were specified regarding training loading (intensity) and subjects trained to volitional fatigue
Researchers did not report results adequately (pre-to-post-mean and standard deviation)
Subject groups comparing 1- vs. 3-sets per exercise per session Investigated the effects of nutritional supplements in combination with resistance training
Subjects used resistance training as a means of training Concurrent aerobic and strength training interventions Studies published in the English language journals only
R a ls to n e t a l. 1 -vs . 3 -S e ts o n S tre n g th : A M e ta -A n a ly sis
TABLE 3 | Characteristics of excluded studies investigating 1-vs. 3-sets.
References Design Status Sex N Age, y,
mean ± SD or range
Frequency Duration (wk)
Sets Reps Strength outcomes The reasoning for exclusion from the current analysis
Kraemer, 1997 RAN T M 40 20 ± 2.3 3 12 1/3 8–12 1RM BP, 1RM LP Excluded due to differences between groups, single circuit group
performed forced reps at the end, and multiple circuit group did no forced reps
Borst et al., 2001 CT U C 31 37 ± 7 3 25 1/3 8–12 Sum of 1RM for CP and LExt Excluded due to inadequate evidence of pre-and post-intervention
training means and SDs to calculate an effect size
McBride et al., 2003 RCT U C 28 21.52 ± 1.3 2 12 1/3 6–15 1RM LP; 1RM BC Excluded due to amount of sets subjects were performing
Galvão and Taaffe, 2005
RAN U C 28 65–78 2 20 1/3 8 Maximum isokinetic and
isometric KExt strength
Excluded due to subjects age range
Munn et al., 2005 RCT U C 115 20.6 ± 6.1 3 6 1/3 6–8 1RM EFlex Excluded due to the primary aim, which was the effects of contraction
speed with one or three-sets at fast or slow speeds Rønnestad et al.,
2007
RAN U M 21 26.6 ± 0.1 3 11 1/3 7–10 1RM lower body (LP, LExt, LC);
1RM upper body (CP, Row, LatP, BC, SP)
Provided the subjects with nutritional supplementation (protein chocolate bar) and energy drinks during each exercise bout
Starkey et al., 1996 RCT U C 48 18–50 3 14 1/3 8–12 Maximal isometric KFlex; KExt Study data identified as an outlier when observed using the
Galbraith plot
N, number; y, years; SD, standard deviation; wk, weeks; Reps, repetitions; RAN, randomly assigned trial; T, trained; M, male; 1RM, 1 repetition maximum; BP, bench press; LP, leg press; CT, control trial; U, untrained; C, male and female subjects combined; CP, chest press; LExt, leg extension; SD, standard deviation; RCT, randomized controlled trial; BC, bicep curl; KExt, knee extensor; EFlex, elbow flexor; LC, leg curl; Row, seated row; LatP, latissimus pull-down; SP, shoulder press; KFlex, knee flexion.
TABLE 4 | Study and subject characteristics 1-vs. 3-sets.
References Design Status Sex N Age, y,
mean ± SD or range Until failure Frequency (sessions per wk) Duration (wk)
Sets Reps Training loads (% 1RM)
Strength outcomes [strength measurement type]
Hass et al., 2000 RAN T C 42 39.2–40.1 Yes 3 13 1/3 8–12 67–80 [1RM] LExt, LC, CP, OP, BC
Rhea et al., 2002a RAN T M 16 20–22 Yes 3 12 1/3 8–12 67–80 [1RM] BP, LP
Paulsen et al., 2003 RAN U M 18 20–30 Yes 3 6 1/3 7 83 [1RM] Sq, KExt, LC, BP, SP, Row, LatP
Kelly et al., 2007 RCT T C 40 22.2–25.3 Max effort 2 8 1/3 8 80 [Nm] KExt
Bottaro et al., 2009 RAN U M 24 19–25.4 Yes 2 12 1/3 8–12 67–80 [1RM] KExt, EExt
Baker et al., 2013 RAN T M 16 18–21 Yes 3 8 1/3 6 85 [1RM and Nm] BP, SP, BC
Sooneste et al., 2013 RAN U M 8 22.9–27.1 Yes 2 12 1/3 8 80 [1RM] SPC
Reid et al., 1987 RAN U M 34 18–35 Yes 3 8 1/2/3 3–18 63–93 [1RM] EFlex, EExt, KFlex, KExt, SFlex,
SExt
Kramer et al., 1997 RAN T M 43 20.3 ±
1.9 [SEM]
Yes 3 14 1/3 8–12 67–80 [1RM] Sq
Schlumberger et al., 2001 RCT T F 27 20–40 Yes 2 6 1/3 6–9 65–77 [1RM] LExt, BP
Humburg et al., 2007 RCT U C 29 23.1–27.1 Yes 3 9 1/3 8–12 67–80 [1RM] BC, LP, BP
Radaelli et al., 2014 RCT U M 48 23.5–25.3 Yes 3 26 1/3/5 8–12 67–80 [5RM] BP, LP, LatP, SP
Total/mean ± SD 393 2.7 (± 0.49) 11.2 (± 5.4) 9.0 (± 1.7) 76.5 (± 7.5)
N, number; y, years; SD, standard deviation; wk, weeks; Reps, repetitions; % 1RM, percentage of subjects one repetition maximum; RAN, randomly assigned trial; T, trained; C, male and female subjects combined; 1RM, 1 repetition maximum; LExt, leg extension; LC, leg curl; CP, chest press; OP, overhead press; BC, bicep curl; M, male; BP, bench press; LP, leg press; U, untrained; SEM, standard error of measurement; Sq, squat; KExt, knee extension; SP, shoulder press; Row, seated row; LatP, latissimus pull-down; RCT, randomized controlled trial; Nm, peak torque; 5RM, subjects five repetition maximum; EFlex, elbow flexion; KFlex, knee flexion; SFlex, shoulder flexion; SExt, shoulder extension; SPC, seated preacher curl; F, female.
F ro n tie rs in P h ys io lo g y |w w w .fr o n tie rs in .o rg 7 Ju ly 2 0 1 9 |V o lu m e 1 0 | A rtic le 8 6 4
heterogeneity test was applied to evaluate heterogeneity prior to estimating tau-square (Tau2), then I2 and Tau2 statistics were calculated. Comparing the Q statistic with an X2 distribution with k−1 degrees of freedom (where k denotes the number of included studies) allowed P-values to be attained. All analyses were conducted at the 95% confidence level. The ES of ≤0.2, ≤0.5, ≤0.8, and ≥0.8 were considered trivial, small, moderate and large, respectively (Cochran, 1954).
For the assessment and evaluation of publication bias, the use of funnel plot assessments withDuval and Tweedie’s (2000)
trim and fill correction was applied. The purpose of the “trim and fill” was to identify and correct for funnel plot asymmetry ascending from publication bias. This method is to; (1) remove the smaller studies causing funnel plot asymmetry; (2) apply the trimmed funnel plot to estimate the true “centre” of the funnel, then; (3) replace the removed or omitted studies around the center. Forest plots were produced to display the study-specific ES and the corresponding CI. All forest plots generated were visually examined against its standard error (SE) to account for publication bias also known as the “file drawer problem.” This refers to the influence of the results of a study that introduces bias into the scientific literature by selective publication, primarily by the propensity to publish positive results but not to publish negative results (Scargle, 2000).
Separate subgroup analysis on ES was performed with the resulting moderators, including; (1) single-joint or multi-joint resistance exercise on 1RM strength gains (trained only subjects); (2) single-joint or multi-joint resistance exercise on 1RM strength gains (untrained only subjects). In the subgroup analysis, mean differences in ES were computed for each study to produce a study-level ES for the difference between S and M3 allowing for the generation of forest plots. Sensitivity analysis was performed, by identifying any studies that were highly influential which may bias the analysis. This was achieved for each model by eliminating one study at a time and then inspecting the set-volume predictor. Influential studies were removed if they caused a significant change in the magnitude of the coefficient or change from significant (P ≤ 0.10) to non-significant (P ≥ 0.10) or vice versa.
RESULTS
The procedure used for systematic literature search and retrieval is displayed in Figure 1 from “potentially relevant” to article inclusion. The specific stages of the selection procedure for the meta-analysis are described as a flow diagram (Figure 1).
Study Selection
The initial examination generated 8,418 related abstracts and citations. Thirty-seven full-text articles were initially deemed to meet the inclusion criteria. A total of 19 potentially relevant journal articles met the pre-set inclusion and exclusion criteria (Table 2) and were further assessed for content applicability. Six studies (Kraemer, 1997; Borst et al., 2001; McBride et al., 2003; Galvão and Taaffe, 2005; Munn et al., 2005; Rønnestad et al., 2007) were rejected prior to data extraction, with Galbraith plot identifying one further article (Starkey et al., 1996) as an outlier
and was omitted. Descriptions for the seven studies that were excluded are detailed in Table 3.
Resistance Training Study Characteristics
Following appraisal and sensitivity measures 12 full-text articles (Reid et al., 1987; Kraemer, 1997; Hass et al., 2000; Schlumberger et al., 2001; Rhea et al., 2002a; Paulsen et al., 2003; Humburg et al., 2007; Kelly et al., 2007; Bottaro et al., 2009; Baker et al., 2013; Sooneste et al., 2013; Radaelli et al., 2014) met pre-set inclusion criteria (Table 2). Journal articles included in this analysis had dates ranging from 1987 to 2014. In total, 12 studies provided data on 393 subjects (Table 4) with the both randomized control groups (RCT [n = 4]) and random assignment of treatment conditions (RAN [n = 8]) experimental designs included.
The mean age of the subjects was 25.2 (± 5.4 years). The training status of subjects included in the 12 studies was untrained (n = 6) and trained (n = 6). Assigned cohorts consisted of male (n = 8 [67%]), female only groups (n = 1 [12%]), and mixed-sex studies (n = 3 [25%]) which were included in the analysis. The RT period ranged from 6 to 26 weeks (mean = 11.2 [±5.4] weeks), weekly training frequency ranged from 2 to 3 days per week (2.7 [±0.49] per week), and the repetitions used ranged from 3 to 18 repetitions (9.0 [±1.7]) per week. The total number of sets per week ranged from two-to-three-sets (2.7 [±1.7]) for S and six-to-nine-sets for M3 (7.5 [±2.1]) per exercise. Also, training loads ranged from 63 to 90% 1RM (76.7 [±4.1]) with the subject’s resistance training characteristics and weekly training volume specified in Table 5.
Sensitivity Analysis
The PEDro scale was based on the Delphi list (Verhagen, 1998) with column 1a not used in the calculation of the scores. Only criterion 2–11 are scored giving a total out of ten. Each column number corresponds to the following criteria on the PEDro scale (Table 6): 1a =eligibility criteria (1a = eligibility criteria specified [1= yes/0 = no]); 2 = subjects randomly allocated; 3 = allocation was concealed; 4 = groups similar at baseline; 5 = blinded subjects; 6 = therapists blinded; 7 = assessors blinded; 8 = follow-up measures obtained for >85% of subjects; 9 = intention to treat analysis; 10 = between groups statistical comparison; 11 = point measures and measures of variability. The included studies had PEDro scores that ranged from five through to six (Table 6). Though the maximum PEDro score is 11, it is problematic and unrealistic to achieve this total. Realistically the maximum score on PEDro was eight as it is problematic to blind both participants and researchers to an exercise intervention. Consequently, included journal articles had a common area of bias as subjects, therapists or researchers were not blinded. Galbraith plots were used to investigate for study heterogeneity and identification of potential outliers. Examination of Galbraith plots exposed no outliers (Figure 2). To assess for publication bias trim and fill funnel plot were also performed in all comparison models. This was to safeguard for overestimations of the ES of set-volume and strength outcomes in the included studies. The shape of the funnel plot did not expose any evidence of apparent asymmetry.
Ralston et al. 1- vs. 3-Sets on Strength: A Meta-Analysis
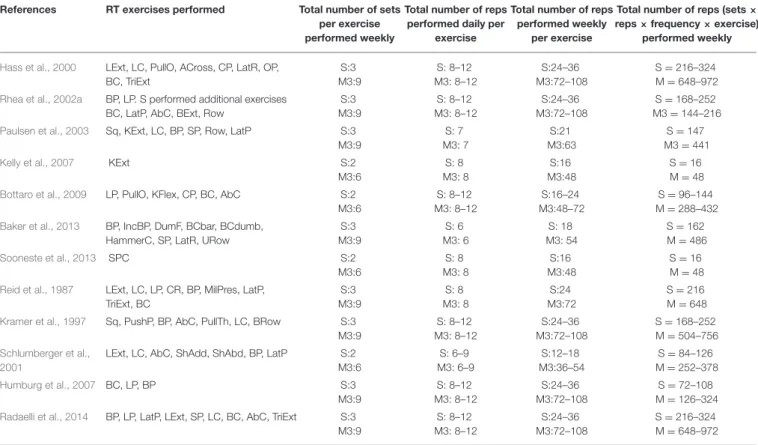
TABLE 5 | Resistance training characteristics and weekly training volume.
References RT exercises performed Total number of sets
per exercise performed weekly
Total number of reps performed daily per
exercise
Total number of reps performed weekly
per exercise
Total number of reps (sets × reps × frequency × exercise)
performed weekly Hass et al., 2000 LExt, LC, PullO, ACross, CP, LatR, OP,
BC, TriExt S:3 M3:9 S: 8–12 M3: 8–12 S:24–36 M3:72–108 S = 216–324 M = 648–972 Rhea et al., 2002a BP, LP. S performed additional exercises
BC, LatP, AbC, BExt, Row
S:3 M3:9 S: 8–12 M3: 8–12 S:24–36 M3:72–108 S = 168–252 M3 = 144–216
Paulsen et al., 2003 Sq, KExt, LC, BP, SP, Row, LatP S:3
M3:9 S: 7 M3: 7 S:21 M3:63 S = 147 M3 = 441
Kelly et al., 2007 KExt S:2
M3:6 S: 8 M3: 8 S:16 M3:48 S = 16 M = 48
Bottaro et al., 2009 LP, PullO, KFlex, CP, BC, AbC S:2
M3:6 S: 8–12 M3: 8–12 S:16–24 M3:48–72 S = 96–144 M = 288–432 Baker et al., 2013 BP, IncBP, DumF, BCbar, BCdumb,
HammerC, SP, LatR, URow
S:3 M3:9 S: 6 M3: 6 S: 18 M3: 54 S = 162 M = 486 Sooneste et al., 2013 SPC S:2 M3:6 S: 8 M3: 8 S:16 M3:48 S = 16 M = 48 Reid et al., 1987 LExt, LC, LP, CR, BP, MilPres, LatP,
TriExt, BC S:3 M3:9 S: 8 M3: 8 S:24 M3:72 S = 216 M = 648
Kramer et al., 1997 Sq, PushP, BP, AbC, PullTh, LC, BRow S:3
M3:9 S: 8–12 M3: 8–12 S:24–36 M3:72–108 S = 168–252 M = 504–756 Schlumberger et al., 2001
LExt, LC, AbC, ShAdd, ShAbd, BP, LatP S:2 M3:6 S: 6–9 M3: 6–9 S:12–18 M3:36–54 S = 84–126 M = 252–378 Humburg et al., 2007 BC, LP, BP S:3 M3:9 S: 8–12 M3: 8–12 S:24–36 M3:72–108 S = 72–108 M = 126–324 Radaelli et al., 2014 BP, LP, LatP, LExt, SP, LC, BC, AbC, TriExt S:3
M3:9 S: 8–12 M3: 8–12 S:24–36 M3:72–108 S = 216–324 M = 648–972
RT, resistance training; LExt, leg extension; LC, leg curl; PullO, pull-over; ACross, arm cross-over; CP, chest press; LatR, lateral raise; OP, overhead press; BC, bicep curl; TriExt, tricep extension; BP, bench press; S, one-set; M3, three-sets; LP, leg press; LatP, latissimus pull-down; AbC, abdominal curl; BExt, back extension; Row, seated row; Sq, squat; KExt, knee extension; SP, shoulder press; KFlex, knee flexion; IncBP, incline bench press; DumF, dumbbell flye; BCbar, bicep curl with bar; BCdumb, bicep curl with dumbbells; HammerC, hammer curl; URow, upright row; SPC, seated preacher curl; MilPres, military press; PushP, push press; PullTh, pull through; Brow, back row; SHadd, shoulder adduction; ShAbd, shoulder abduction.
Effects of 1- vs. 3- Sets on Multi-Joint and
Single-Joint Exercise
Pre- to post-strength outcomes were assessed via a meta-analytic procedure for all included studies. Subgroup analysis was then performed with multi-joint and single-joint exercises combined into separate subdivision analysis. A random-effects model was incorporated into each strength measure due to the potential of pooled study data generating significant heterogeneity with I2 used to evaluate heterogeneity.
The pooled mean ES estimates (untrained and trained) of multi-joint and single-joint data (Tables 7, 8) comprised of 70 treatment groups from 12 studies (Reid et al., 1987; Kramer et al., 1997; Hass et al., 2000; Schlumberger et al., 2001; Rhea et al., 2002a; Paulsen et al., 2003; Humburg et al., 2007; Kelly et al., 2007; Bottaro et al., 2009; Baker et al., 2013; Sooneste et al., 2013; Radaelli et al., 2014). The random-effects model exposed a considerable amount of variability between studies. Heterogeneity prior to taking Tau2 into consideration (Q heterogeneity test) was: Chi2 = 131.56, d.f. = 11, P < 0.00001. The heterogeneity statistic I2 (%) = 92
[interpreted as high, (Higgins et al., 2003)], and the tau2 test
(between-trials variance) = 0.74. When a random effect analysis
was implemented, a large effect was detected for combined multi-joint and single-joint exercises on RT set training volume [mean effect size (ES) 0.93; 95% CI 0.41–1.45]. Pre- to post-intervention strength change was greater with M3 compared to S (ES difference 0.25) with the effect statistically significant (P = 0.0005). The mean for S was 0.64 (95% CI 0.44–0.84). The mean ES for M3 was 0.89 (95% CI 0.66–1.12).
Untrained Subjects’ Effects of Single -vs.
Three-Sets on Combined Exercises
Examination of the effects of pre- vs. post-training strength (untrained subjects only) categorized as either S or M3 from six studies (Reid et al., 1987; Paulsen et al., 2003; Humburg et al., 2007; Bottaro et al., 2009; Sooneste et al., 2013; Radaelli et al., 2014). The random-effects model exposed a considerable amount of variability between studies. Q heterogeneity test was: Chi2=78.30, d.f. = 5, P < 0.00001. The heterogeneity statistic I2 (%) = 94 [interpreted as high, (Higgins et al., 2003)], and the tau2test (between-trials variance) = 0.94. A large effect was
observed on untrained only subjects for multi-joint and single-joint exercises combined (ES 1.20; 95% CI 0.39–2.01). Pre- to post-intervention strength change was greater when M3 was
TABLE 6 | Methodological quality of studies based on the PEDro score.
References PEDro Scale item Total
1a 2 3 4 5 6 7 8 9 10 11 Reid et al., 1987 1 1 0 1 0 0 0 1 1 1 1 6 Kramer et al., 1997 1 1 0 1 0 0 0 1 1 1 1 6 Hass et al., 2000 1 1 0 1 0 0 0 1 1 1 1 6 Schlumberger et al., 2001 1 1 0 1 0 0 0 1 1 1 1 6
Rhea et al., 2002a 1 1 0 0 0 0 0 1 1 1 1 5
Paulsen et al., 2003 1 1 0 1 0 0 0 1 1 1 1 6 Humburg et al., 2007 1 1 0 1 0 0 0 1 1 1 1 6 Kelly et al., 2007 1 1 0 1 0 0 0 1 1 1 0 5 Bottaro et al., 2009 1 1 0 1 0 0 0 1 1 1 1 6 Baker et al., 2013 1 1 0 1 0 0 0 1 1 1 1 6 Sooneste et al., 2013 1 1 0 1 0 0 0 1 1 1 1 6 Radaelli et al., 2014 1 1 0 1 0 0 0 1 1 1 1 6
PEDro, Physiotherapy Evidence Database. The PEDro scale is based on the Delphi list (Verhagen, 1998). Column 1a not used in the calculation of the scores. Only criterion 2–11 are scored giving a total out of ten. Column numbers correspond to the following criteria on the PEDro scale: 1a=eligibility criteria (1a = eligibility criteria specified [1= yes/0 = no]),
2 = random allocation, 3 = concealed allocation, 4 = groups similar at baseline, 5 = blinded subjects, 6 = blinded therapists, 7 = blinded assessors, 8 = follow-up measures obtained for > 85% of subjects, 9 = intention to treat analysis, 10 = between groups statistical comparison, 11 = point measures and measures of variability.
FIGURE 2 | Galbraith plot used to examine study heterogeneity (pre- vs. post-strength change). Each open circle represents one pre- vs. post-study data.
compared to S (ES difference 0.22) with statistical significance (P = 0.004). The mean for S was 0.60 (95% CI 0.34–0.85). The mean ES for M3 was 0.82 (95% CI 0.52–1.11).
Trained Subjects’ Effects of Single -vs.
Three-Sets on Combined Exercises
Separate subgroup examination on the effects of pre- vs. post-training strength (trained subjects only) categorized as either S or M3 from six studies (Kramer et al., 1997; Hass et al., 2000; Schlumberger et al., 2001; Rhea et al., 2002a; Kelly
et al., 2007; Baker et al., 2013). The random-effects model exposed a considerable amount of variability between studies. Q heterogeneity test was: Chi2=29.21, d.f. = 5, P < 0.0001. The heterogeneity statistic I2(%) = 83 (interpreted as high;Higgins et al., 2003), and the tau2 test (between-trials variance) = 0.42. A moderate effect was observed on trained only subjects for multi-joint and single-joint exercises combined (ES 0.63; 95% CI 0.05–1.22). Pre- to post-intervention strength gain was greater when M3 was compared to S (ES difference 0.28) with statistical significance (P = 0.03). The mean for S was 0.68 (95% CI 0.35–1.01). The mean ES for M3 was 0.96 (95% CI 0.61–1.31).
Effects of 1-vs. 3-Sets on Upper Body
Exercise
Examination of upper body exercises (multi-joint and single-joint exercises combined) comprised 10 studies (Reid et al., 1987; Hass et al., 2000; Schlumberger et al., 2001; Rhea et al., 2002a; Paulsen et al., 2003; Humburg et al., 2007; Bottaro et al., 2009; Baker et al., 2013; Sooneste et al., 2013; Radaelli et al., 2014) are displayed in the forest plot (Figure 3). The random-effects model exposed a large amount of variability between studies (I2=93%). Removal ofHumburg et al. (2007)andRadaelli et al. (2014)data, resulted in moderate heterogeneity (Q heterogeneity test was: Chi2=21.71, d.f. = 7, P = 0.003). The heterogeneity statistic I2 (%) = 68 (interpreted as moderate heterogeneity,Higgins et al., 2003), and the tau2 test (between-trials variance) = 0.27, and a small effect was observed (ES 0.37; 95% CI −0.09 to 0.82). Pre- to post-intervention strength change was greater when M3 was compared with S (ES difference 0.19) with no statistical significance (P = 0.11). The mean ES for S was 0.68 (95% CI 0.42–0.94). The mean ES for M3 was 0.87 (95% CI 0.61–1.14).
R a ls to n e t a l. 1 -vs . 3 -S e ts o n S tre n g th : A M e ta -A n a ly sis
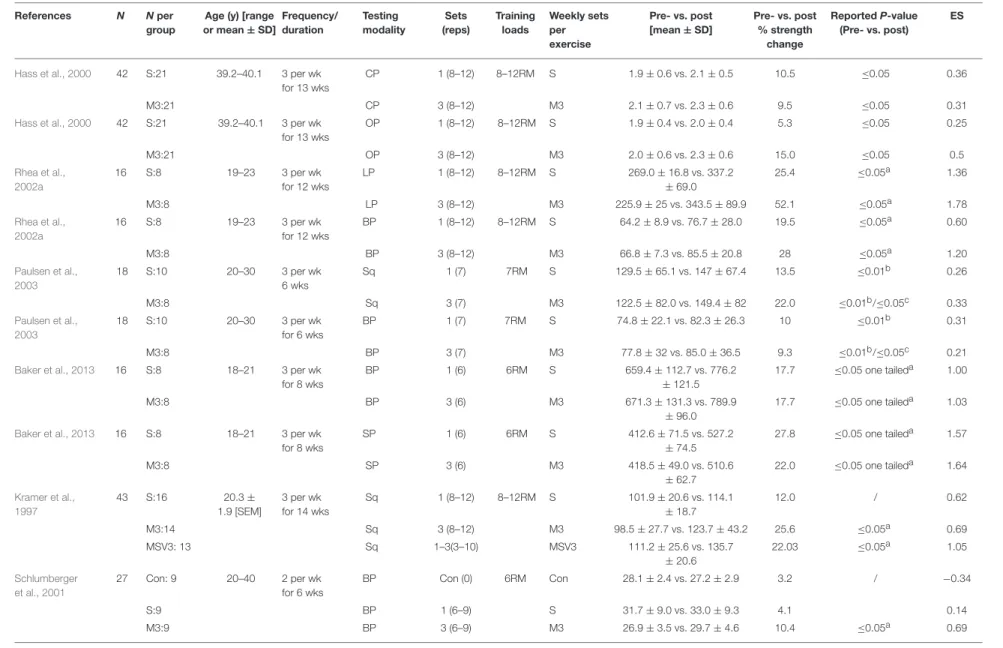
TABLE 7 | Pre- vs. post-strength analysis of multi-joint exercise.
References N Nper
group
Age (y) [range or mean ± SD] Frequency/ duration Testing modality Sets (reps) Training loads Weekly sets per exercise Pre- vs. post [mean ± SD] Pre- vs. post % strength change Reported P-value (Pre- vs. post) ES
Hass et al., 2000 42 S:21 39.2–40.1 3 per wk
for 13 wks
CP 1 (8–12) 8–12RM S 1.9 ± 0.6 vs. 2.1 ± 0.5 10.5 ≤0.05 0.36
M3:21 CP 3 (8–12) M3 2.1 ± 0.7 vs. 2.3 ± 0.6 9.5 ≤0.05 0.31
Hass et al., 2000 42 S:21 39.2–40.1 3 per wk
for 13 wks OP 1 (8–12) 8–12RM S 1.9 ± 0.4 vs. 2.0 ± 0.4 5.3 ≤0.05 0.25 M3:21 OP 3 (8–12) M3 2.0 ± 0.6 vs. 2.3 ± 0.6 15.0 ≤0.05 0.5 Rhea et al., 2002a 16 S:8 19–23 3 per wk for 12 wks LP 1 (8–12) 8–12RM S 269.0 ± 16.8 vs. 337.2 ±69.0 25.4 ≤0.05a 1.36 M3:8 LP 3 (8–12) M3 225.9 ± 25 vs. 343.5 ± 89.9 52.1 ≤0.05a 1.78 Rhea et al., 2002a 16 S:8 19–23 3 per wk for 12 wks BP 1 (8–12) 8–12RM S 64.2 ± 8.9 vs. 76.7 ± 28.0 19.5 ≤0.05a 0.60 M3:8 BP 3 (8–12) M3 66.8 ± 7.3 vs. 85.5 ± 20.8 28 ≤0.05a 1.20 Paulsen et al., 2003 18 S:10 20–30 3 per wk 6 wks Sq 1 (7) 7RM S 129.5 ± 65.1 vs. 147 ± 67.4 13.5 ≤0.01b 0.26 M3:8 Sq 3 (7) M3 122.5 ± 82.0 vs. 149.4 ± 82 22.0 ≤0.01b/≤0.05c 0.33 Paulsen et al., 2003 18 S:10 20–30 3 per wk for 6 wks BP 1 (7) 7RM S 74.8 ± 22.1 vs. 82.3 ± 26.3 10 ≤0.01b 0.31 M3:8 BP 3 (7) M3 77.8 ± 32 vs. 85.0 ± 36.5 9.3 ≤0.01b/≤0.05c 0.21
Baker et al., 2013 16 S:8 18–21 3 per wk
for 8 wks BP 1 (6) 6RM S 659.4 ± 112.7 vs. 776.2 ±121.5 17.7 ≤0.05 one taileda 1.00 M3:8 BP 3 (6) M3 671.3 ± 131.3 vs. 789.9 ±96.0 17.7 ≤0.05 one taileda 1.03
Baker et al., 2013 16 S:8 18–21 3 per wk
for 8 wks SP 1 (6) 6RM S 412.6 ± 71.5 vs. 527.2 ±74.5 27.8 ≤0.05 one taileda 1.57 M3:8 SP 3 (6) M3 418.5 ± 49.0 vs. 510.6 ±62.7 22.0 ≤0.05 one taileda 1.64 Kramer et al., 1997 43 S:16 20.3 ± 1.9 [SEM] 3 per wk for 14 wks Sq 1 (8–12) 8–12RM S 101.9 ± 20.6 vs. 114.1 ±18.7 12.0 / 0.62 M3:14 Sq 3 (8–12) M3 98.5 ± 27.7 vs. 123.7 ± 43.2 25.6 ≤0.05a 0.69 MSV3: 13 Sq 1–3(3–10) MSV3 111.2 ± 25.6 vs. 135.7 ±20.6 22.03 ≤0.05a 1.05 Schlumberger et al., 2001 27 Con: 9 20–40 2 per wk for 6 wks BP Con (0) 6RM Con 28.1 ± 2.4 vs. 27.2 ± 2.9 3.2 / −0.34 S:9 BP 1 (6–9) S 31.7 ± 9.0 vs. 33.0 ± 9.3 4.1 0.14 M3:9 BP 3 (6–9) M3 26.9 ± 3.5 vs. 29.7 ± 4.6 10.4 ≤0.05a 0.69 (Continued) F ro n tie rs in P h ys io lo g y |w w w .fr o n tie rs in .o rg 1 1 Ju ly 2 0 1 9 |V o lu m e 1 0 | A rtic le 8 6 4
to n e t a l. 1 -vs . 3 -S e ts o n S tre n g th : A M e ta -A n a ly sis References N Nper group
Age (y) [range or mean ± SD] Frequency/ duration Testing modality Sets (reps) Training loads Weekly sets per exercise Pre- vs. post [mean ± SD] Pre- vs. post % strength change Reported P-value (Pre- vs. post) ES Humburg et al., 2007 29 Con: 7 23.1–27.1 3 per wk for 9 wks BP Con (0) 8–12RM Con 47.5 ± 15.7 vs. 48.2 ± 17.1 1.47 / 0.04 S: 22 BP 1 (8–12) S 56.1± 20.6 vs. 61.7 ± 21.7 10.0 ≤0.05a 0.26 M3: 22 BP 3 (8–12) M3 54.9 ± 21.6 vs. 63.0 ± 23.0 14.8 ≤0.05a 0.36 Humburg et al., 2007 29 Con: 7 23.1–27.1 3 per wk for 9 wks
LP right leg Con (0) 8–12RM Con 155.7 ± 23.1 vs. 149.8 ±26.2 −3.80 / −0.24 S: 22 LP right leg 1 (8–12) S 174.4 ± 44.7 vs. 188.1 ±36.4 7.9 ≤0.05a 0.34 M3: 22 LP right leg 3 (8–12) M3 172.7 ± 38.4 vs. 195.3 ±44.7 13.1 ≤0.05a 0.54 Humburg et al., 2007 29 Con: 7 23.1–27.1 3 per wk for 9 wks
LP left leg Con (0) 8–12RM Con 156.5 ± 31.5 vs. 149.7 ±33.8 −4.35 / −0.21 S: 22 LP left leg 1 (8–12) S 169.5 ± 40.2 vs. 183.1± 36.1 8.0 ≤0.05a 0.36 M3: 22 LP left leg 3 (8–12) M3 165.4 ± 38.2 vs. 189.9 ±44.9 14.8 ≤0.05a 0.59 Radaelli et al., 2014 48 Con: 10 23.5–25.3 3 per wk for 6 months BP Con (0) 8–12RM Con 68.3 ± 11.4 vs. 64.4 ± 8.8 −5.71 / −0.38 S:12 BP 1 (8–12) S 64.5 ± 9.5 vs. 73.2 ± 9.9 13.5 ≤0.05a,c 0.90 M3:13 BP 3 (8–12) M3 73.4 ± 9.4 vs. 86.1 ± 8.4 17.3 ≤0.05a,c 1.42 M5:13 BP 5 (8–12) M5 89.6 ± 9.6 vs. 99.6 ± 5.5 11.2 ≤0.05a 1.13 Radaelli et al., 2014 48 Con: 10 23.5–25.3 3 per wk for 6 months
LatP Con (0) 8–12RM Con 60.5 ± 6.8 vs. 62.2 ± 6.6 2.8 / 0.25
S:12 LatP 1 (8–12) S 57.9 ± 10.7 vs. 68.7 ± 9.5 18.7 ≤0.05a,c 1.07 M3:13 LatP 3 (8–12) M3 62.5 ± 6.21 vs. 70.0 ± 4.76 12.0 ≤0.05a,c 1.36 M5:13 LatP 5 (8–12) M5 74.2 ± 9.5 vs. 86.5 ± 6.5 16.6 ≤0.05a,c 1.51 Radaelli et al., 2014 48 Con: 10 23.5–25.3 3 per wk for 6 months SP Con (0) 8–12RM Con 26.1 ± 7.4 vs. 29.4 ± 7.6 12.6 – 0.44 S:12 SP 1 (8–12) S 31.6 ± 7.1 vs. 38.7 ± 9.3 22.5 ≤0.05a 0.86 M3:13 SP 3 (8–12) M3 34.2 ± 7.5 vs. 42.3 ± 6.3 23.7 ≤0.05a,c 1.17 M5:13 SP 5 (8–12) M5 41.5 ± 8.2 vs. 56.1 ± 11.9 35.2 ≤0.05a,c 1.43 Radaelli et al., 2014 48 Con: 10 23.5–25.3 3 per wk for 6 months LP Con (0) 8–12RM Con 157.8 ± 21.0 vs. 155.0 ±25.0 −1.8 / −0.12 S:12 LP 1 (8–12) S 170 ± 34.1 vs. 196.7 ± 15.5 15.7 ≤0.05a 1.01 M3:13 LP 3 (8–12) M3 172.5 ± 30.1 vs. 199.2 ±14.4 15.5 ≤0.05a,c 1.13 M5:13 LP 5 (8–12) M5 178.5 ± 24.4 vs. 201.5 ±25.4 12.9 ≤0.05a 0.92
N, number of subjects; y, years; SD, standard deviation; Reps, repetitions; ES, effect size; S, one-set; M3 three-sets; LP, leg press; RM, repetition maximum; BP, bench press; Sq, squat; SP, shoulder press; MSV3, multiple-sets with changes in training volume; Con, control group; LatP, lateral pull-down; SP, shoulder press; CP, chest press; OP, overhead press.
aSignificantly greater than prior to training (P ≤ 0.05).
tie rs in P h ys io lo g y |w w w .fr o n tie rs in .o rg 1 2 Ju ly 2 0 1 9 |V o lu m e 1 0 | A rtic le 8
R a ls to n e t a l. 1 -vs . 3 -S e ts o n S tre n g th : A M e ta -A n a ly sis
TABLE 8 | Pre- vs. post-strength analysis on single-joint exercise.
References N Nper
group
Age (y) [range or mean ± SD] Frequency/ duration Testing modality Sets (reps) Training loads Weekly sets per exercise
Pre- vs. post [mean ± SD] Pre- vs. post % strength
change
P-Value (Pre- vs. post)
ES
Hass et al., 2000 42 S:21 39.2–40.1 3 per wk
for 13 wks
LExt 1 (8-12) 8–12RM S 2.4 ± 0.4 vs. 2.7 ± 0.4 12.5 ≤0.05 0.75
M3:21 LExt 3 (8–12) M3 2.6 ± 0.4 vs. 2.9 ± 0.4 11.5 ≤0.05 0.75
Hass et al., 2000 42 S:21 39.2–40.1 3 per wk
for 13 wks
LCurl 1 (8–12) 8–12RM S 2.0 ± 0.3 vs. 2.1 ± 0.2 5 ≤0.05 0.39
M3:21 LCurl 3 (8–12) M3 2.1± 0.2 vs. 2.3 ± 0.2 9.5 ≤0.05 1.00
Hass et al., 2000 42 S:21 39.2–40.1 3 per wk
for 13 wks
BC 1 (8–12) 8–12RM S 1.0 ± 0.3 vs. 1.1 ± 0.3 10 ≤0.05 0.33
M3:21 BC 3 (8–12) M3 1.1± 0.3 vs. 1.2 ± 0.3 9.1 ≤0.05 0.33
Paulsen et al., 2003 18 S:10 20–30 3 per wk
for 6 wks
KExt 1 (7) 7RM S 125.8 ± 52.8 vs. 144 ± 45.5 14.5 ≤0.01a 0.37
M3:8 KExt 3 (7) M3 117.8 ± 38.2 vs. 142.5
±25.2
21.0 ≤0.01a/≤0.05b 0.76
Paulsen et al., 2003 18 S:10 20–30 3 per wk
for 6 wks
LCurl 1 (7) 7RM S 57.3 ± 30.4 vs. 64.8 ± 24.03 13.1 ≤0.01a 0.27
M3:8 LCurl 3 (7) M3 55.9 ± 29.1 vs. 65.3 ± 37.1 16.8 ≤0.01a/≤0.05b 0.25
Kelly et al., 2007 40 Con: 8 22.2–25.3 2 per wk
for 8 wks
Con Con (0) 8RM Con 135.7 ± 77.1 vs. 127.1
±64.6 6.3 / −0.12 S:14 KExt 1 (8) S 163.5 ± 56.4 vs. 171.2 ± 70 4.7 ≤0.05 0.12 M3:18 KExt 3 (8) M3 171.4 ± 62.0 vs. 200.8 ±111.1 17.2 ≤0.05 0.33
Bottaro et al., 2009 24 S:13 22.2 ± 3.2 2 per wk
for 12 wks
KExt 1 (8–12) 8–12RM S 24.3 ± 3.0 vs. 25.3 ± 2.9 4.1 ? 0.34
M3:11 KExt 3 (8–12) M3 20.9 ± 3.2 vs. 23.4 ± 2.3 12.0 ≤0.05c 0.90
Bottaro et al., 2009 24 S:13 22.2 ± 3.2 2 per wk
for 12 wks
EExt 1 (8–12) 8–12RM S 51.4 ± 10.9 vs. 55.2 ± 10.2 7.4 ≤0.05c 0.36
M3:11 EExt 3 (8–12) M3 45.6 ± 5.9 vs. 48.3 ± 8.2 5.9 ≤0.05c 0.38
Baker et al., 2013 16 S:8 18–21 3 per wk
for 8 wks BC 1 (6) 6RM S 402.8 ± 54.8 vs. 485.1 ± 48 20.4 ≤0.05 one tailedc 1.60 M3:8 BC 3 (6) M3 421.4 ± 44.1 vs. 499.8 ±77.4 18.6 ≤0.05 one tailedc 1.24 Sooneste et al., 2013 8 S:8 25.0 ± 2.1 2 per wk for 12 wks SPC 1 (8) 8RM S 9.1 ± 1.6 vs. 10.9 ± 2.5 19.8 ≤0.05c 0.86 M3:8 SPC 3 (8) M3 9.1 ± 1.6 vs. 11.9 ± 2.9 30.8 ≤0.05c 1.20 (Continued) F ro n tie rs in P h ys io lo g y |w w w .fr o n tie rs in .o rg 1 3 Ju ly 2 0 1 9 |V o lu m e 1 0 | A rtic le 8 6 4
to n e t a l. 1 -vs . 3 -S e ts o n S tre n g th : A M e ta -A n a ly sis TABLE 8 | Continued References N Nper group
Age (y) [range or mean ± SD] Frequency/ duration Testing modality Sets (reps) Training loads Weekly sets per exercise
Pre- vs. post [mean ± SD] Pre- vs. post % strength
change
P-Value (Pre- vs. post)
ES
Reid et al., 1987 34 S:9 18–35 3 per wk
for 8 wks
KFlex 1 (10–12) 6–12RM S 34.2 ± 6.4 vs. 39.7 ± 8 16.1 ≤0.05c 0.76
M3:9 KFlex 3 (6) M3 35.2 ± 5.3 vs. 40 ± 5.6 13.6 ≤0.01a 0.88
Reid et al., 1987 34 S:9 18–35 3 per wk
for 8 wks
KExt 1 (10–12) 6–12RM S 80.5 ± 15.8 vs. 95.5 ± 17.8 18.6 ≤0.01a 0.89
M3:9 KExt 3 (6) M3 90.0 ± 16.7 vs. 103.6 ± 16.4 15.1 ≤0.01a 0.82
Reid et al., 1987 34 S:9 18–35 3 per wk
for 8 wks
EFlex 1 (10–12) 6–12RM S 39.3 ± 4.2 vs. 43.9 ± 6.3 11.7 ≤0.01a 0.86
M3:9 EFlex 3 (6) M3 42 ± 5.2 vs. 45.5 ± 6.9 8.3 ≤0.05c 0.57
Reid et al., 1987 34 S:9 18–35 3 per wk
for 8 wks
EExt 1 (10–12) 6–12RM S 28.5 ± 7 vs. 35 ± 10.8 22.8 ≤0.01a 0.71
M3:9 EExt 3 (6) M3 33.4 ± 8.1 vs. 40.3 ± 10.3 20.7 ? 0.74
Reid et al., 1987 34 S:9 18–35 3 per wk
for 8 wks
SFlex 1 (10–12) 6–12RM S 47.3 ± 10.7 vs. 58.3 ± 10.7 23.3 ≤0.01a 1.03
M3:9 SFlex 3 (6) M3 52.9 ± 11.9 vs. 64.4 ± 9.8 21.7 ≤0.05c 1.05
Reid et al., 1987 34 S:9 18–35 3 per wk
for 8 wks SExt 1 (10–12) 6–12RM S 48.2 ± 11.1 vs. 54.8 ± 11.2 13.7 ? 0.59 M3:9 SExt 3 (6) M3 51.8 ± 9.1 vs. 66.5 ± 11.1 28.4 ≤0.01a 1.44 Schlumberger et al., 2001 27 Con: 9 20–40 2 per wk for 6 wks
LExt Con (0) 6RM Con 44.1 ± 7.7 vs. 44.0 ± 8.6 −0.23 / −0.01
S:9 LExt 1 (6–9) S 44.8 ± 6.8 vs. 47.8 ± 7.9 6.7 ≤0.05 0.41 M3:9 LExt 3 (6–9) M3 43.7 ± 6.1 vs. 50.6 ± 7.6 15.8 ≤0.05 1.00 Humburg et al., 2007 29 Con: 7 23.1–27.1 3 per wk for 9 wks BC Con (0) 8–12RM Con 25.9 ± 11.9 vs. 25.6 ± 12.1 −1.2 / −0.02 S: 22 BC 1 (8–12) S 28.1 ± 9.4 vs. 30.0 ± 9.4 6.8 ≤0.05 0.20 M3: 22 BC 3 (8-12) M3 26.4 ± 9.5 vs. 30.6 ± 9.4 15.9 ≤0.05 0.44
N, number of subjects; y, years; SD, standard deviation; Reps, repetitions; ES, effect size; S, one-set; M3= three-sets; per week, number of days trained per week; LExt, leg extension; RM, repetition maximum; LCurl, leg curl; BC, bicep curl; KExt, knee extension; Con, control group; EExt, elbow extension; SPC, seated preacher curl; EFlex, elbow flexion; SFlex, shoulder flexion; SExt, shoulder extension.
aSignificantly greater than prior to training (P ≤ 0.05).
bSignificant differences from corresponding groups-exercise values (P ≤ 0.05). cSignificantly greater than prior to training (P ≤ 0.01).
tie rs in P h ys io lo g y |w w w .fr o n tie rs in .o rg 1 4 Ju ly 2 0 1 9 |V o lu m e 1 0 | A rtic le 8
Ralston et al. 1- vs. 3-Sets on Strength: A Meta-Analysis
FIGURE 3 | Forest plot of 1 vs. 3-sets (trained and untrained subjects [upper body exercise] combined) withHumburg et al. (2007)andRadaelli et al. (2014)datum excluded.
Untrained Subjects’ Effects of 1- vs. 3-Sets
on Upper Body Exercise
Examination of upper body exercises (multi-joint and single-joint exercises combined) on untrained subjects comprised of six studies (Reid et al., 1987; Paulsen et al., 2003; Humburg et al., 2007; Bottaro et al., 2009; Sooneste et al., 2013; Radaelli et al., 2014). The random-effects model exposed a large amount of variability between studies (I2 = 94%). Removal of Humburg et al. (2007) and Radaelli et al. (2014) data, resulted in large heterogeneity (Q heterogeneity test was: Chi2=11.45, d.f. = 3,
P = 0.010). The heterogeneity statistic I2(%) = 74 (interpreted as high heterogeneity, Higgins et al., 2003), and the tau2 test (between-trials variance) = 0.54, and a small effect was observed (ES 0.35; 95% CI −0.49 to 1.19). Pre- to post-intervention strength change was greater when M3 was compared with S (ES difference 0.23) with no statistical significance (P = 0.42). The mean ES for S was 0.81 (95% CI 0.67–0.95). The mean ES for M3 was 1.04 (95% CI 0.66–1.41). Subgroup examination of S vs. M3 pre- to post-intervention strength differences on trained only and untrained only subjects was not viable due to inadequate study data.
Trained Subjects’ Effects of 1- vs. 3-Sets
on Upper Body Exercise
Examination of upper body exercises (multi-joint and single-joint exercises combined) on trained subjects comprised of four studies (Hass et al., 2000; Schlumberger et al., 2001; Rhea et al., 2002a; Baker et al., 2013). Q heterogeneity test was: Chi2=3.09, d.f. = 3, P = 0.38. The random-effects model exposed a low amount of variability between studies. The heterogeneity statistic I2 (%) = 3 (interpreted as low, Higgins et al., 2003), and the tau2test (between-trials variance) = 0.00. When a random effect analysis was implemented, a moderate effect was detected on trained only subjects for upper body exercise resistance exercises (ES 0.63; 95% CI 0.34–0.92). Pre- to post-intervention strength change was greater when M3 was compared to S (ES difference 0.33) with statistical significance (P < 0.0001). The mean for S
was 0.59 (95% CI 0.16–1.02). The mean ES for M3 was 0.92 (95% CI 0.53–1.31).
Effects of 1- vs. 3-Sets on Lower Body
Exercise
Examination of lower body exercises (multi-joint and single-joint exercises combined) on untrained and trained subjects comprised of 10 studies (Reid et al., 1987; Hass et al., 2000; Schlumberger et al., 2001; Rhea et al., 2002a; Paulsen et al., 2003; Humburg et al., 2007; Kelly et al., 2007; Bottaro et al., 2009; Radaelli et al., 2014) are displayed in the forest plot (Figure 4). Q heterogeneity test was: Chi2 = 54.00, d.f. = 9,
P < 0.00001. The random-effects model exposed a high amount of variability between studies I2 (%) = 83. Removal of Hass et al. (2000) and Humburg et al. (2007) data, resulted in no heterogeneity (Q heterogeneity test was: Chi2=4.05, d.f. = 7, P =0.77). The heterogeneity statistic I2(%) = 0 (interpreted as no
heterogeneity,Higgins et al., 2003), and the tau2test (between-trials variance) = 0.00, and a small effect was observed (ES 0.35; 95% CI 0.10–0.60). Pre- to post-intervention strength change was greater when M3 was compared with S (ES difference 0.27) with statistical significance (P = 0.006). The mean ES for S was 0.60 (95% CI 0.36–0.84). The mean ES for M3 was 0.87 (95% CI 0.57–1.17).
Untrained Subjects’ Effects of 1- vs. 3-Sets
on Lower Body Exercise
Examination of lower body exercises (multi-joint and single-joint exercises combined) on untrained comprised of five studies (Reid et al., 1987; Paulsen et al., 2003; Humburg et al., 2007; Bottaro et al., 2009; Radaelli et al., 2014). Q heterogeneity test was: Chi2=34.99, d.f. = 4, P = < 0.00001). The random-effects model exposed a high amount of variability between studies I2 (%) = 89. Removal ofHumburg et al. (2007)data, resulted in no heterogeneity (Q heterogeneity test was: Chi2=2.36, d.f. = 3, P
=0.50). The heterogeneity statistic I2(%) = 0 (interpreted as no
heterogeneity,Higgins et al., 2003), and the tau2test (between-trials variance) = 0.00, and a moderate effect was observed
FIGURE 4 | Forest plot of 1 vs. 3-sets (untrained and trained subjects [lower body exercise] combined) withHass et al. (2000)andHumburg et al. (2007)datum excluded.
(ES 0.49; 95% CI 0.14–0.83). Pre- to post-intervention strength change was greater when M3 was compared with S (ES difference 0.28) with statistical significance (P = 0.005). The mean ES for S was 0.75 (95% CI 0.30–1.2). The mean ES for M3 was 1.03 (95% CI 0.51–1.55).
Trained Subjects’ Effects of 1- vs. 3-Sets
on Lower Body Exercise
Examination of lower body exercises (multi-joint and single-joint exercises combined) on trained subjects comprised of five studies (Kramer et al., 1997; Hass et al., 2000; Schlumberger et al., 2001; Rhea et al., 2002a; Kelly et al., 2007). Q heterogeneity test was: Chi2=15.24, d.f. = 4, P = < 0.004. The random-effects model
exposed a high amount of variability between studies I2(%) = 74. Removal ofHass et al. (2000)data, resulted in no heterogeneity (Q heterogeneity test was: Chi2 = 0.34, d.f. = 3, P-value = 0.95). The heterogeneity statistic I2 (%) = 0 (interpreted as no heterogeneity,Higgins et al., 2003), and the tau2test
(between-trials variance) = 0.00, and a trivial effect was observed (ES 0.18; 95% CI −0.23 to 0.58). Pre- to post-intervention strength change was greater when M3 was compared with S (ES difference 0.32) with no statistical significance (P = 0.39). The mean ES for S was 0.63 (95% CI 0.18–1.08). The mean ES for M3 was 0.95 (95% CI 0.43–1.47).
Effects of 1- vs. 3-Sets on Multi-Joint Only
Exercise
Outcomes for S vs. M3 on multi-joint exercise (combined trained and untrained subjects) classified as S or M3 are displayed in the forest plot (Figure 5). The forest plot includes the mean ES and CIs for strength change separated for interventions featuring S and M3 and the overall effect test and heterogeneity analysis. The pooled mean ES estimates of S vs. M3 on multi-joint exercise data comprised of 34 treatment groups from eight studies (Kramer et al., 1997; Hass et al., 2000; Schlumberger et al., 2001; Rhea et al., 2002a; Paulsen et al., 2003; Humburg et al., 2007; Baker et al., 2013; Radaelli et al., 2014). The random-effects model exposed a considerable amount of variability between studies. Q
heterogeneity test was: Chi2=69.07, d.f. = 7, P < 0.00001. The
heterogeneity statistic I2(%) = 90 (interpreted as high,Higgins et al., 2003), and the tau2 test (between-trials variance) = 0.86. A moderate effect was observed for multi-joint exercise and M3 (ES 0.83; 95% CI 0.14–1.51). Pre- to post-intervention strength change was greater when M3 was compared to S (ES difference 0.22) with statistical significance (P = 0.02). The mean for S was 0.61 (95% CI 0.34–0.88). The mean ES for M3 was 0.83 (95% CI 0.53–1.13).
Trained Subjects’ Effects of 1- vs. 3-Sets
on Multi-Joint Only Exercise
Separate subgroup examination on the effects of pre- vs. post-training strength (trained subjects only) categorized as either S or M3 from five studies (Kramer et al., 1997; Hass et al., 2000; Schlumberger et al., 2001; Rhea et al., 2002a; Baker et al., 2013). The random-effects model exposed a low degree of variability between studies. Q heterogeneity test was: Chi2=7.73, d.f. = 4,
P = 0.10. The heterogeneity statistic I2(%) = 48 (interpreted as low-moderate,Higgins et al., 2003), and the tau2 test (between-trials variance) = 0.07. A moderate effect was observed on trained only subjects for multi-joint exercises combined (ES 0.52; 95% CI 0.10–0.94). Pre- to post-intervention strength change was greater when M3 was compared to S (ES difference 0.25) with statistical significance (P = 0.02). The mean for S was 0.67 (95% CI 0.30 to 1.04). The mean ES for M3 was 0.92 (95% CI 0.56– 1.28). Subgroup analysis of S vs. M3 pre-to post-intervention strength differences on untrained subjects was not feasible due to inadequate study data.
Effects of 1- vs. 3-Sets on Multi-Joint
Upper Body Exercise
Subgroup analysis on the effects of pre- vs. post-training strength multi-joint upper body exercises (trained and untrained subjects) categorized as either S or M3 from seven studies (Hass et al., 2000; Schlumberger et al., 2001; Rhea et al., 2002a; Paulsen et al., 2003; Humburg et al., 2007; Baker et al., 2013; Radaelli et al., 2014). The random-effects model exposed a significant amount of variability


![FIGURE 3 | Forest plot of 1 vs. 3-sets (trained and untrained subjects [upper body exercise] combined) with Humburg et al](https://thumb-eu.123doks.com/thumbv2/123doknet/14566421.539050/16.892.90.827.97.336/figure-forest-trained-untrained-subjects-exercise-combined-humburg.webp)
![FIGURE 4 | Forest plot of 1 vs. 3-sets (untrained and trained subjects [lower body exercise] combined) with Hass et al](https://thumb-eu.123doks.com/thumbv2/123doknet/14566421.539050/17.892.90.827.98.342/figure-forest-untrained-trained-subjects-lower-exercise-combined.webp)
![FIGURE 5 | Forest plot of 1 vs. 3-sets (trained and untrained [multi-joint exercise] combined).](https://thumb-eu.123doks.com/thumbv2/123doknet/14566421.539050/18.892.76.828.97.329/figure-forest-trained-untrained-multi-joint-exercise-combined.webp)
