Airline Schedule Planning and Operations: Optimization-based
Approaches for Delay Mitigation
by
Lavanya Marla
B.Tech., Civil Engineering, Indian Institute of Technology, Madras (2004)
S.M., Operations Research and Transportation, Massachusetts Institute of Technology (2007)
Submitted to the Department of Civil and Environmental Engineering in partial fulfillment of the requirements for the degree of
Doctor of Philosophy in the field of Transportation Systems
at the
MASSACHUSETTS INSTITUTE OF TECHNOLOGY September 2010
@
Massachusetts Institute of Technology 2010. All rights reserved.ARCHIVES
MASSACHUSETTS INSTITUTE OF TECHOLOGYSEP
2
9 2010
L 3RA R IES
Author...Department of Civil and Environmentahngineering August 18, 2010
Certified by ... Ford Professor
/ Cynthia Barnhart of Civil and Environmental Engineering and Engineering Systems Associate Dean for Academic Affairs, School of Engineering
Thesis Supervisor
Accepted by ...
.
...Daniele Veneziano Chairman, Departmental Committee for Graduate Students
Airline Schedule Planning and Operations: Optimization-based
Approaches for Delay Mitigation
by
Lavanya Marla
Submitted to the Department of Civil and Environmental Engineering on August 18, 2010, in partial fulfillment of the
requirements for the degree of
Doctor of Philosophy in the field of Transportation Systems
Abstract
We study strategic and operational measures of improving airline system performance and reducing delays for aircraft, crew and passengers. As a strategic approach, we study robust op-timization models, which capture possible future operational uncertainties at the planning stage, in order to generate solutions that when implemented, are less likely to be disrupted, or incur lower costs of recovery when disrupted. We complement strategic measures with operational measures of managing delays and disruptions by integrating two areas of airline operations thus far separate -disruption management and flight planning.
We study different classes of models to generate robust airline scheduling solutions. In par-ticular, we study, two general classes of robust models: (i) extreme-value robust-optimization based and (ii) chance-constrained probability-based; and one tailored model, which uses do-main knowledge to guide the solution process. We focus on the aircraft routing problem, a step of the airline scheduling process. We first show how the general models can be applied to the aircraft routing problem by incorporating domain knowledge. To overcome limitations of solution tractability and solution performance, we present budget-based extensions to the gen-eral model classes, called the Delta model and the Extended Chance-Constrained programming
model. Our models enhance tractability by reducing the need to iterate and re-solve the models, and generate solutions that are consistently robust (compared to the basic models) according to our performance metrics. In addition, tailored approaches to robustness can be expressed as spe-cial cases of these generalizable models. The extended models, and insights gleaned, apply not only to the aircraft routing model but also to the broad class of large-scale, network-based, re-source allocation. We show how our results generalize to rere-source allocation problems in other domains, by applying these models to pharmaceutical supply chain and corporate portfolio ap-plications in collaboration with IBM's Zurich Research Laboratory. Through empirical studies, we show that the effectiveness of a robust approach for an application is dependent on the inter-action between (i) the robust approach, (ii) the data instance and (iii) the decision-maker's and stakeholders' metrics. We characterize the effectiveness of the extreme-value models and prob-abilistic models based on the underlying data distributions and performance metrics. We also show how knowledge of the underlying data distributions can indicate ways of tailoring model parameters to generate more robust solutions according to the specified performance metrics.
As an operational approach towards managing airline delays, we integrate flight planning with disruption management. We focus on two aspects of flight planning: (i) flight speed changes; and (ii) intentional flight departure holds, or delays, with the goal of optimizing the trade-off between fuel costs and passenger delay costs. We provide an overview of the state of the practice via dialogue with multiple airlines and show how greater flexibility in disrup-tion management is possible through integradisrup-tion. We present models for aircraft and passenger recovery combined with flight planning, and models for approximate aircraft and passenger re-covery combined with flight planning. Our computational experiments on data provided by a European airline show that decrease in passenger disruptions on the order of 47.2%-53.3% can be obtained using our approaches. We also discuss the relative benefits of the two mechanisms studied -that of flight speed changes, and that of intentionally holding flight departures, and show significant synergies in applying these mechanisms. We also show that as more informa-tion about delays and disrupinforma-tions in the system is captured in our models, further cost savings and reductions in passenger delays are obtained.
Thesis Supervisor: Cynthia Barnhart
Title: Ford Professor of Civil and Environmental Engineering and Engineering Systems Associate Dean for Academic Affairs, School of Engineering
-Credits
Chapter 3 and Chapter 4 of this thesis are a result of collaborations with IBM Research's Zurich Research Laboratory and with Jeppesen Commercial and Military Aviation. I sincerely thank them for these collaborations.
I thank Dr. Eleni Pratsini for facilitating my internship at IBM Research Zurich, which
led to Chapter 3. I am grateful to Dr. Eleni Pratsini and Dr. Gautier Stauffer for our many valuable discussions during my internship at IBM Research Zurich; and Alexander Rikun for his contribution to the corporate portfolio problem and insights on robust optimization from our discussions.
Chapter 4 resulted through a collaboration with Bo Vaaben, an employee of Jeppesen Com-mercial and Military Aviation, who is currently pursuing an industrial PhD program at the Technical University of Denmark under the supervision of Prof. Jesper Larsen. I thank Bo for providing me with data from Jeppesen, for facilitating discussion with airlines on the state-of-the-practice of flight planning, and for help with the Jeppesen simulator.
I thank Prof. Cynthia Barnhart, Prof. Patrick Jaillet, Dr. Hamsa Balakrishnan and Dr. Marta
Acknowledgments
I would like to express my deepest gratitude to my advisor, Prof. Cynthia Barnhart, for her
encouragement and support during my PhD. I have benefited from Cindy's unique research perspective, her depth of knowledge and her approach to solving real-world problems with a blend of theory and practice. Cindy has given me complete freedom and unwavering support to pursue my own research interests, and has encouraged all collaborations. Chapters 3 and 4 of this thesis, which are a result of collaborations with IBM Research Zurich and Jeppesen, would not have been possible without Cindy's strong backing. Her wisdom, patience, and insights have taught me in more ways than one. I sincerely thank her for the wonderful experience she has facilitated for me.
Special thanks to Patrick for his valuable suggestions and guidance through my research, and for valuable advice during my job search. I would like to thank Hamsa and Marta, for their comments and suggestions on my work, and for taking the time to speak with me on a wide range of topics -research, job talks and other career advice. You have guided me through advice as well as example.
I warmly thank Dr. Eleni Pratsini for providing me with a great internship experience at
IBM Research Zurich. This translated into Chapter 3 of my thesis. I am also thankful for your valuable perspectives, feedback and mentorship. Thanks to Gautier and Alex for their collaboration and the fun discussions. I also owe thanks to Bo Vaaben and Steve Altus from Jeppesen for our research discussions on three-way conference calls. These discussions helped me define the problem that ultimately led to Chapter 4. Special thanks to Bo, for our long research discussions, for being so quick to respond on email, and providing me with flight plans and data. It was great having you visit MIT as part of our collaboration.
I owe much to the teachers who inspired me in undergrad, and encouraged me on the journey
to a PhD. I also thank faculty members Nigel Wilson, Mikel Murga, Georgia Perakis and others in the CEE department and the ORC for being generous with their time. Thanks, Maria, Ginny, Patty, Kris and Jeanette for smoothing out all administrative issues.
Thanks to Vikrant, Ta, Pavithra, and Doug for all our interesting research discussions. Vikrant and Ta, your enthusiasm is infectious, and I had great fun in our chats at the office,
research and otherwise. Thanks to the colleagues from the NSF-EFRI, CTL and Transporta-tion@MIT seminar series for your research perspectives. To Niklaus and Nicoleta for collabo-rating on the airline competition and UPS problems. To friends in the Transportation Students Group and Operations Research Center who have made my stay at MIT a wonderful experience. To my officemates over the years -Andre, Liz, Vikrant, Ta, Miao, and others -for some great memories; and especially Andre for the hike in Switzerland!
I thank all the friends who have inspired, challenged and encouraged me through this
jour-ney. To Viji, Madhu, Padma, Naveen, Pavithra, Vikram, and many others for their support. To KP, Prabha, Mythili, Anima, Jayku, AT, Vivek, Varun, Anna for our enjoyable chats. To friends from the MIT India Reading Group for the times spent discussing developmental issues in In-dia, for inspiring me with your passion, commitment and ideas. Also a big thank you to Xiaolu for sharing her tips on thesis writing!
I am grateful to have had this unforgettable experience, and for the many lessons I learned
along the way. I thank the numerous people who have contributed in ways small and large, seen and unseen, to the culmination of this work and this period of learning.
Finally, a big thank you to Mum, Dad and Ramya for their constant support, help, and confidence in my ability to succeed.
Contents
1 Introduction
1.1 M otivation . . . . 1.2 Thesis Contributions and Structure . . . . 1.2.1 Chapter 2: Robust aircraft routing . . . . 1.2.2 Chapter 3: Robust optimization -other applications . . . .
1.2.3 Chapter 4: Integrated Disruption Management and Flight Planning .
2 Robust Aircraft Routing
2.1 Introduction . . . . 2.1.1 2.1.2 2.1.3 2.1.4 2.2 Robust 2.2.1 2.2.2 2.2.3 2.2.4 2.3 Robust 2.3.1 2.3.2 2.3.3
Robust Airline Scheduling . . . . Motivation . . . . Contributions . . . . O utline . . . . Models of Bertsimas and Sim, and Charnes and Cooper . Robust Formulation of Bertsimas and Sim . . . . Delta Model . . . . Chance-Constrained Programming . . . . Extended Chance-Constrained Programming . . . . Models Applied to Aircraft Routing . . . . The Standard Deterministic Aircraft Routing Model . . Modeling . . . . Tailored Approach . . . . 2.3.4 Probabilistic Chance-Constrained Programming Approach
. . . . 27 . . . . 30 . . . . 34 . . . . 34 . . . . 35 . . . . 35 . . . . 39 . . . . 42 . . . . 45 . . . . 48 . . . . 48 . . . . 49 . . . . 50
2.3.5 Extreme-Value Robust Optimization Approach . . . . 2.4 Evaluation . . . . 2.4.1 Experimental Set-up... . . . .
2.4.2 Metrics and Simulator . . . .
2.5 R esults . . . .
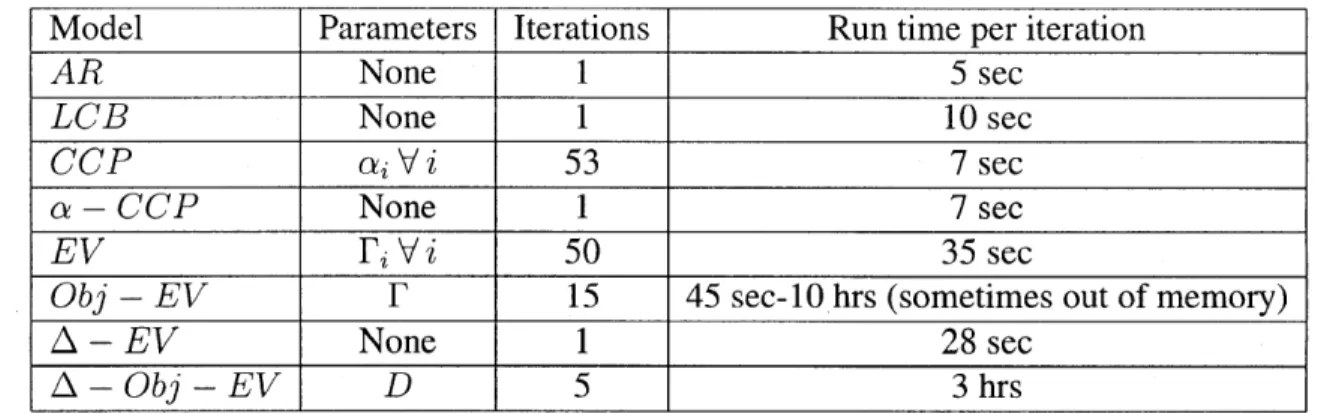
2.5.1 Typical Computation Times . . . .
2.5.2 Correlations between protection levels and robustness metrics
2.5.3 Solution Differences due to Modeling Paradigms . . . .
2.6 Conclusions . . . .
3 Robust Optimization Insights from Three Applications
3.1 Robust Optimization . . . .
3.1.1 Defining Robust Optimization . . . .
3.1.2 Challenges in Building Robust Solutions . . . .
3.1.3 Literature on Robust Optimization Approaches . . .
3.1.4 Approaches of Particular Interest . . . .
3.2 Problems of Interest . . . . . . . .. 3.2.1 Corporate Portfolio Optimization . . . .
3.2.2 Pharmaceutical Supply Chain Design . . . .
3.3 R esults . . . .
3.3.1 Role of Robust Approach . . . .
3.3.2 Relationship between Robust Approach and Metrics
3.3.3 Importance of data . . . . 3.4 Conclusions . . . . 69 . . . . 70 . . . . 70 . . . . 70 . . . . 71 . . . . 74 . . . . 77 . . . . 77 . . . . 83 . . . . 91 . . . . 91 . . . . 97 . . . . 98 . . . . 99
4 Integrated Disruption Management and Flight Planning 101 4.1 Introduction . . . 101
4.1.1 The Problem . . . 102
4.1.2 Opportunities for Integrating Flight Planning and Disruption Management 103 4.1.3 Contributions . . . 107
4.2 Disruption Management . . . .
4.2.1 Mathematical Formulation . . . . 4.3 Flight Planning . . . . 4.3.1 Cost Index-based flight planning . . . . 4.3.2 Flight planning: state-of-the-practice . . . .
4.3.3 Flight Planning Engine . . . . 4.3.4 Concerns related to state-of-the-practice . . . . 4.4 Integrated Disruption Management and Flight Planning . . . 4.4.1 Network representation . . . . 4.4.2 Flight copy creation . . . . 4.4.3 Definitions . . . . 4.4.4 Assumptions . . . . 4.4.5 Aircraft and Passenger Recovery Model . . . . 4.4.6 Approximate Aircraft and Passenger Recovery Model Burn and Passenger Cost . . . . 4.5 Experimental Setup . . . . 4.5.1 Network Structure and Experiment Design . . . . . 4.5.2 Historical Delay Analysis and Scenario Generation . 4.5.3 Parameter assumptions . . . . 4.5.4 Baseline for comparison . . . . 4.5.5 Simulation . . . . 4.6 R esults . . . .
4.6.1 Case Study 1 . . . ... 4.6.2 Case Study 2 . . . ... . . . ..
5 Conclusions and Future Directions
5.1 Summary . . . .
5.1.1 Strategic Approaches . . . .
5.1.2 Operational Approaches . . . .
5.2 Extensions and Future Directions . . . .
. . . . 109 . . . . 110 . . . . 115 . . . . 117 . . . . 118 . . . . 121 . . . . 121 . . . . 122 . . . . 123 . . . . 124 127 128 128 Trade-off Fuel . . . 131 . . . 133 . . . 133 . . . 135 . . . 136 . . . 136 . . . 137 . . . 137 . . . . . 138 . . . 147 151 . . . 151 . . . 151 . . . 154 . . . 155
List of Figures
1-1 US National Airlines' On-Time Arrival Performance (May, 2005 -May, 2010). 20
2-1 Delay Propagation along an Aircraft Route . . . . 32
2-2 Robust Routing with Optimal Slack Allocation . . . . 32
2-3 Propagated Delays of Feasible Aircraft Routings, N2 . . . . 33
2-4 CCP model solutions for network N2 do not show improved total delay min-utes with increased protection (t = 90) . . . . 62
2-5 Bertsimas-Sim model solutions for N2 show non-monotonic relationship of propagated delay with F (t = 90) . . . . 63
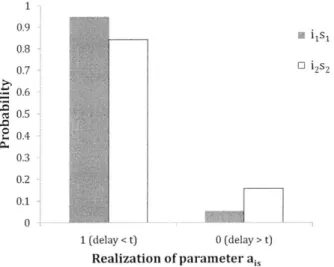
2-6 aj, realization probabilities, N2 . . . . 65
2-7 Propagated Delay Distributions of Strings . . . . 66
3-1 Accuracy -Tractability Trade-off for CVaR . . . . 83
3-2 Mean-variance trade-off curves of extreme-value and chance-constrained models 92 3-3 Sensitivity to uncertainty range . . . . 94
3-4 The Bertsimas and Sim model's sensitivity to uncertainty range . . . . 96
3-5 The Delta model's sensitivity to uncertainty range . . . . 96
3-6 Multi-criteria nature of robustness . . . 100
4-1 Flexibility provided in disruption management by choosing alternate flight plans 104 4-2 Trade-off between flight time and associated costs . . . 106
4-3 Flexibility provided in disruption management by choosing alternate flight plans 107 4-4 Sample flight plan . . . 115
4-6 Propagation Boundary . . . 125 4-7 Trade-offs between fuel burn and passenger delay costs over multiple days . . . 139
4-8 Changing optimal trade-off point between fuel and passenger cost with depar-ture delay A . . . 140
List of Tables
2.1 Flight Delay Percentages and Passenger Disruptions of Feasible Routings, N2 3 1 2.2 Fleet Network Characteristics . . . . 59 2.3 Complexity and Run Times . . . . 60
2.4 Robustness metrics for N2 do not improve with increasing protection
parame-ters in the CCP model (t = 90) . . . . 61
2.5 Non-monotonicity in robustness metrics for N2 with increase in l' in EV (t = 90) 62
2.6 A - EV, A - Obj - EV and a - CCP identify robustness parameters to
improve upon the airline's routing for N2 (t = 90) . . . . 64
3.1 Summary of Robust Approaches and Applications . . . . 91 3.2 Solutions to the Bertsimas and Sim model and sensitivity to uncertainty range . 95
4.1 Flight time -cost trade-offs associated with different flight plans . . . 105 4.2 Flight A - H disruption costs from simulations for different recovery strategies,
summed over 12 days of operation... . . . . . . . 142
4.3 Flight A - H simulated average cost savings per day for different recovery strategies, averaged over 12 days of operation . . . 143 4.4 Improvements observed using enhanced models, compared to conventional
dis-ruption management case . . . 147 4.5 One-third of inbound flights delayed into hub: Incorporating information about
multiple disrupted flights simultaneously . . . 148 4.6 One-third of inbound flights delayed into hub: optimizing flight plans for
Chapter 1
Introduction
In this thesis, we study strategic and operational techniques to improve airline system per-formance and reduce delays for aircraft, crew and passengers. As part of strategic measures, we study robust optimization techniques, by which possible future operational uncertainties are modeled at the planning stage in order to generate solutions that when implemented, are more likely to be executed or easier to repair when disrupted. We complement strategic measures us-ing operational measures of managus-ing delays and disruptions by integratus-ing two areas of airline operations hitherto separate -disruption management andflight planning.
1.1
Motivation
Aviation is an integral part of the international economy, with steady growth in developed countries and explosive growth in developing countries. In 2008, there were 26,245 aircraft departures and 4,282,870 million revenue passenger kilometers worldwide, with revenues of
$563,640 million [Air]. In the United States, aviation generates $1.2 trillion in economic
out-put, and is 5.2% of the US Gross Domestic Product [Fed09].
Air travel has increased tremendously in the past decade. 4,282 billion passenger revenue kilometers were traveled across the world in 2008 compared to 2,797 billion passenger revenue kilometers in 1999, a growth of 53% [Air]. While the revenue passenger kilometers traveled in North America rose 22% from 1999 to 2008, an even higher growth of 71% was observed in Europe and the Asia-Pacific regions [IntlOb]. Though this growth slowed somewhat towards
the end of 2008 and in 2009 due to the recent economic crisis, it is expected that there will be a recovery in traffic to pre-recession levels [TP09]. With these high growth rates, the percent of
US aircraft arriving late (as defined by the 15-minute on-time performance metric) has increased
from 17.01% in 2003 to 25.96% in 2008 [Bur09a]. These delays are highly detrimental in an industry where the profit margins are typically less than 2%, with delay costs forming a major component of operating costs [Int08]. As a case in point, the total costs of U.S. domestic air traffic delays crossed the $40 billion mark [JEC08]. Of these delay costs, $19.1 billion represents incremental operating costs for the airlines (including additional fuel costs due to delays of $1.6 billion, releasing 7.1 million metric tons of carbon dioxide into the atmosphere), $12 billion represents the estimated passenger costs due to low productivity and lost business, and $10 billion represents losses to other industries that rely on air traffic [JEC08]. It is evident that if delays can be reduced, society and the airline industry would benefit tremendously.
The airline system operates as a highly interconnected network, with aircraft, crew and pas-sengers interacting closely. Planning an airline's operations involves capturing the complex in-teractions between airports, gates, airport slots, aircraft fleet types and associated maintenance restrictions, crew restrictions and passenger demands. For large airlines which daily operate thousands of flights, with thousands of aircraft and crew, this this can be a considerable com-putational challenge. Due to this reason, the process of designing an airline's operations, called airline schedule planning, is usually decomposed into four (usually) sequential sub-problems:
(1) schedule design, (2) fleet assignment, (3) aircraft maintenance routing and (4) crew
schedul-ing. We briefly describe these sub-problems here. Given a set of markets desired to be served, schedule design is the process of determining the set of flight legs (as described by origin, des-tination and departure and arrival times) to be operated by an airline so that its profitability is maximized. Following schedule design, the fleet assignment problem is to assign to each flight leg a type of aircraft so that passenger travel demands can be met. The operating cost of each flight leg is the cost of flying a particular aircraft type on that leg, plus a spill cost equal to the lost revenue of passengers who could not book the flight leg due to insufficient numbers of available seats. The fleet assignment cannot use more aircraft of each type than available in the airline's fleet, and the assignment must assure flow balance of each fleet type. Once fleet assignment is completed, each individual aircraft is assigned a routing, or path in the network,
by solving the aircraft maintenance routing problem. The crucial objective of the maintenance
routing problem is to ensure that each aircraft receive periodic maintenance checks at a mainte-nance station, as required by the Federal Aviation Administration (FAA). Given the fleeting and routing decisions made in the previous steps, the crew scheduling problem is to generate cost-minimizing activity schedules for the cockpit and cabin crew so that each flight leg is assigned the appropriate crew members. The crew schedule should follow numerous restrictions that are a result of government-mandated work rules, as well as bargaining agreements between the airline and its employees. For a detailed description of the airline schedule planning process, we refer the interested reader to Barnhart [Bar09a].
Because each flight leg can be successfully operated when its resources -the aircraft, crew, airport gates, runways, etc. -are all available at the scheduled time, there is a close interaction of all these resources in the system. Each of the complex interactions described can be sub-jected to uncertainty and delay in the system. Inherent uncertainty in operations, manifesting as weather, airport and airspace congestion, crew sickness, aircraft maintenance, security, etc., can be reasons for any one of the resources required to operate a flight to not be available on time, with resulting delays or disruptions. Due to this uncertainty, planned schedules are rarely, if ever, executed. In addition, the close interconnections of these resources results in strong network effects -that is, a delay occurring in one part of the network or to one of the resources can propagate downstream to multiple other resources and other parts of the network. These effects are referred to as propagated [LCB06] or reactionary delays [CT09]. For example, a flight arriving late can cause both its aircraft and crew to be delayed in downstream operations. According to the Bureau of Transportation Statistics [Bur10], a distribution of delays by cause, for the period of May 2005 -May 2010 is as shown in Figure 1-1.
When delays or disruptions occur in the network, airlines undertake disruption management. Disruption management is usually under the purview of the Airline Operations Control Center
(AOCC). The goal of disruption management is schedule recovery, that is, to bring the plan back
on schedule as quickly and cost-effectively as possible, and minimize the additional operating costs incurred due to the disruptive events. The scope of the recovery problem spans flight schedules, aircraft routes, crew assignments and passenger routes. Due to its complexity, again, the recovery problem is solved in stages, with typically aircraft recovered first, followed by
EIOn Time - 76.46%
0 Air Carrier Delay
-6.00%
N Weather Delay - 0.84%
E National Aviation System Delay - 7.53%
0 Security Delay - 0.06%
Figure 1-1: US National Airlines' On-Time Arrival Performance (May, 2005 -May, 2010)
crew (which are both resources required for the system to operate); and finally, passengers. For a detailed description of the recovery process, we refer the reader to Barnhart [Bar09b].
To minimize the additional operational costs resulting from these disruptions, different ap-proaches may be used, including:
1. Strategic approaches: These approaches focus on robust schedule design, by which a
schedule that is less sensitive to operational uncertainty is designed at the planning stage, before the day of operation. Understanding that delays and disruptions in the system are inevitable, robust airline scheduling pro-actively considers possible delays and dis-ruptions as schedules and plans are developed; with the objective of building plans that are less susceptible to disturbances or, are easier to repair once disrupted. This might be achieved by building plans that require fewer recovery (disruption management) actions, or that decrease the complexity or cost of recovery. Robust airline scheduling, then, is a proactive planning technique aimed at reducing total realized costs, including both plan and recovery costs. This is in contrast to early practices, in which responses to disruptive events were reactive, that is, actions to manage delays are taken only after an event occurs, resulting in schedule recovery actions which can be costly and complex to implement.
2. Operational approaches: Operational approaches are undertaken by the airline on the day of operations, either in anticipation of or after a delay or disruption of the schedule, after information about the disruption or delay is revealed. These measures come under the category of disruption management. Operational approaches are dynamic in their
...
implementation, and their goal is often to bring the plan back on schedule as quickly as possible, while incurring minimal costs, and disrupt as few resources or passengers of the system. Measures such as flight cancelations, flight re-timing, aircraft swaps, use of reserve crews, etc. can be used.
Strategic measures and operational measures complement each other. Ideally, strategic and operational approaches should be synergistic, and work together in order to minimize the real-ized costs of the system. In this thesis, we focus on both strategic and operational measures of disruption management.
1.2
Thesis Contributions and Structure
In this section, we present the context for our approaches of robust schedule design and en-hanced disruption management. We describe the contributions of our work and structure of this thesis.
1.2.1
Chapter 2: Robust aircraft routing
Deterministic models of airline schedule planning that are commonly used in practice do not capture information about potential future uncertainty, and therefore, render the system vulner-able to delays and disruptions. During the past decade, there has been considervulner-able interest in exploring the benefits of robust approaches which pro-actively make the system less vulnerable to uncertainty on the day of operations.
Several types of approaches have been studied in the broader literature for modeling un-certainty and building more robust solutions. These approaches can be categorized as (i) prob-ability distribution-free models, (ii) probprob-ability distribution-based models, and (iii) problem-specific models. The first two categories are general approaches that can be applied to any mathematical program. In Chapter 2, we ask the question if more general robust approaches belonging to the probability distribution-free and probability distribution-based categories can be applied successfully to airline schedule planning.
We focus on the aircraft routing problem, a step of the airline scheduling process. In par-ticular, we study two general classes of robust models and one tailored approach that uses domain knowledge to guide the solution process. The first class of models is a distribution-free, extreme-value based approach, proposed by Bertsimas and Sim [BS04]. The second class of models is a probability-based chance-constrained approach, proposed by Charnes and Cooper
[CC59].
In order to meaningfully apply the general paradigms of capturing uncertainty to aircraft routing, we show that domain knowledge about the problem should be captured. Through experiments conducted on data from a major US hub-and-spoke carrier, we discover that ex-isting models face limitations in modeling the performance metrics and in solution tractabil-ity. To overcome these limitations, we present new models in both the extreme-value and the probabilistic paradigms, which we call the Delta model and the Extended Chance-Constrained Programming model (ECCP) respectively. Our extended models avoid the need to repeatedly re-solve to gain robust solutions, which was an issue for the basic models. Also, the run times of our extended models are comparable to a single iteration of the models. Both these features enhance solution tractability. Our extended models re-define robustness as maximizing a robust parameter within a budget, and consequently also generate consistently more robust solutions than the basic models according to our performance metrics.
We show that the tailored model for robust aircraft routing is a special case of the chance-constrained programming model. The solutions of the ECCP model, reflecting the focus of the model on high-probability delay events, are robust with respect to our metrics of inter-est. Extreme-value based models, on the other hand, due to a focus on worst-case delays, can generate solutions with good worst-case performance, and a high degree of variability in our performance metrics. This is due to the underlying data distributions for the hub-and-spoke US carrier under consideration, where bi-modal delays are seen with delay either at the lower end of the scale (with a probability of 85-90%) or at the higher end of the range (with a probability of 10-15%).
Our work thus underscores the importance of choosing an approach that aligns well with both the data distributions for the aircraft routing problem, as well as the the metrics of interest to the Department of Transportation (DoT), the airline and passengers. The extended models
and insights gleaned in this work apply not only to the aircraft routing model but also to the broad class of large-scale, network-based, resource allocation problems.
1.2.2
Chapter 3: Robust optimization
-
other applications
The goal of using general methods such as the Bertsimas and Sim and Chance-Constrained Programming method in Chapter 2 is to be able to apply them to various applications, within the airline scheduling context as well to other domains. In this chapter, we study and com-pare the application of various generally applicable robust approaches to multiple problems, namely, strategic supply chain design for a T50 pharmaceutical manufacturer, portfolio op-timization for a global corporation, and aircraft routing for a US carrier (studied in Chapter 2). The pharmaceutical supply chain problem and the corporate portfolio problem arose in collab-oration with IBM Research's Zurich Research laboratory. We consider various approaches of robustness and develop insights that can help in applying these methods to a broad variety of problems.
From empirical studies conducted on real-world data available for the three applications, we observe that the effectiveness of solutions generated is affected by the robust modeling approach, the underlying data and the performance metrics of interest. Extreme-value-based models are seen to be best applied when the underlying data distribution is known with less cer-tainty -that is, the type of distribution, or the spread of data cannot be well-estimated. As more information about the system is available with some certainty (even in the form of quantiles rather than complete distributions), probabilistic models that can capture partial/full distribu-tion informadistribu-tion produce more effective results. Because extreme-value based models focus on the worst-case, they produce conservative solutions geared towards worst-case metrics, whereas probabilistic models produce less conservative solutions geared towards average-case metrics. We also show how knowledge of the underlying data distribution, even if partial, or empirically derived, can indicate ways of modifying input parameters of extreme-value and probabilistic models to produce more robust solutions, according to the specified performance metrics.
1.2.3
Chapter 4: Integrated Disruption Management and Flight Planning
In this chapter, our focus is on operational approaches for airline operations. Disruption man-agement procedures are in place at airlines to bring operations back on track when disruptive events occur, and to reduce recovery costs (which contribute to operating costs).
We include flight planning in an enhanced disruption management tool, by providing opti-mization models that combine flight planning with traditional disruption management models during operations. In particular, we focus on two aspects of flight planning: (i) flight speed changes; and (ii) intentional flight departure holds, or delays, with the goal of optimizing the trade-off of fuel costs and passenger delay costs. Our approach represents an integration of two aspects of airline operations before studied separately, namely, disruption management and flight planning.
Through dialogue with multiple airlines, we provide an update of the current state-of-the-practice with regards to flight planning approaches. We also discuss the current state-of-the-practice in the disruption management area. We identify opportunities for enabling greater flexibility in disruption management using flight planning, possible by integrating these elements, and show the need for optimization-based decision support.
We present models for aircraft and passenger recovery combined with flight planning, and models for approximate aircraft and passenger recovery with flight planning. With these mod-els, we provide a means for optimizing trade-offs between delayed passenger costs and fuel costs, with the goal of minimizing total realized costs.
Our experiments involve the hub operations of an international carrier. In comparison with conventional disruption management, we demonstrate that our enhanced disruption manage-ment strategy helps decrease passenger-related operating costs for the airline by reducing pas-senger misconnections by 47.2% -57.3%. We demonstrate the dynamic nature of the trade-off
frontier between passenger costs and fuel burn costs and discuss in detail the interactions in-volved in this trade-off under different disruption scenarios. We also discuss the relative benefits of the two types of mechanisms studied -that of flight speed changes, and that of intentionally holding flight departures - and show significant synergies in applying the two mechanisms si-multaneously.
We conclude the thesis in Chapter 5 by summarizing the contributions and findings of this
Chapter 2
Robust Aircraft Routing
2.1
Introduction
Robust airline scheduling is a way of pro-actively considering delays and disruptions and cre-ating schedules with the objective of building plans that are less susceptible to disturbances or easier to repair once disrupted. This is in contrast to prior practice, where responses to delays were reactive, that is, after an event occurred, schedule recovery actions which can be costly and complex to implement, were taken. Robust airline scheduling, then, is a proactive planning technique aimed at reducing total realized costs, including both plan and recovery costs.
To evaluate the robustness of solutions obtained, we use simulation, as the objective function values of the planning optimization models do not indicate the realized costs or robustness of the solution. Through simulation, we measure solution performance with respect to a host of relevant robustness metrics.
2.1.1
Robust Airline Scheduling
Several approaches to build robust airline scheduling solutions, tailored to the airline industry, have been developed.
Ehrgott and Ryan [ER02] provide a bicriteria optimization framework to develop pareto optimal solutions for the crew scheduling problem. The two criteria of interest are cost and robustness. Robustness into crew schedules in built by incorporating sufficient ground times
if crews have to change aircraft, or keeping the crew with the aircraft in case of tight ground times. They define a linear non-robustness penalty function based on the expected delay of each flight in the schedule, and if the crew are required to change aircraft for a tight ground time. However, they do not provide details on the calculation of expected delay. Ehrgott and Ryan's formulation trades off the cost function and the penalty function for non-robustness. Within allowable budgets of deviation from the minimum cost solution, they find the most robust solution. Further, they show that this can be solved effectively by modeling the constraints as 'elastic' constraints, which generate solutions that are part of the pareto optimal frontier. Their results clearly demonstrate the trade-off between cost and robustness. However, the authors do not evaluate the pareto optimal frontiers and their true performance through simulation.
Ageeva [AgeO0] creates robust airline schedules by focusing on the aircraft routing part of the airline scheduling process. Aircraft routings are considered to be more robust if they contain more opportunities to 'swap'. Two aircraft meet if their routes contain the same location within a specific time-window. The aircraft may be swapped if they meet twice along their routes, allowing for a switch in routes at the first meeting point and swapped back to the original routes at a later meeting point. Such swaps increase flexibility of aircraft availability in disruptive scenarios. Ageeva examines multiple optimal solutions to the aircraft routing problem and ranks them by their robustness, as measured by the number of swaps. The results indicate that robustness of the resulting aircraft routing, as measured by the number of swaps, can be increased as much as 35% compared to the original routing. However, this work stops short of evaluating the resulting robust solutions through simulation.
Rosenberger, Johnson and Nemhauser [RJNO4] develop a robust model for fleet assignment and aircraft routing that allows for many 'short cycles'. A cycle is a sequence of flights that begins and ends at the same airport. When flights are canceled in disruptive scenarios, airlines cancel not just one flight, but a cycle containing that flight, in order to reposition the aircraft correctly. By increasing the number of short cycles containing fewer flights, the number of flights canceled when one flight is canceled is decreased. In addition, the goal of such short cycles is also to decrease hub connectivity. Hub connectivity indicates the number of aircraft rotations that include more than one hub. Higher hub connectivity means that disruptions can spread from hub to hub in the network. Evaluating the solutions via simulation, the authors
show that the incorporating robustness in the form of short cycles produces fleet assignment solutions that decrease planned operating costs and passenger spill.
Schaefer, Johnson, Kleywegt and Nemhauser [SJKN05] introduce a measure to evaluate crew schedules in practice. Their measure approximates both the planning cost as well as the operational cost of a crew schedule. They propose two methods based on (i) expected operating cost, which is calculated using SimAir, a MonteCarlo simulation of airline operations, and (ii) penalizing pairing properties that may result in poor performance. Using simulation, they illustrate that solutions generated using these approaches perform better under uncertain conditions compared to deterministic approaches that do not take uncertainty into account.
Yen and Birge [YB06] build robust crew schedules by modeling crew scheduling as a two-stage stochastic program. The first two-stage of the model solves the standard crew scheduling model that minimizes expected costs. The second stage recourse model minimizes the expected costs of crews being swapped between planes. They introduce a novel branching scheme to solve the stochastic program. The results exhibit the trade-off between planned crew costs and recourse costs.
To address the issue of demand uncertainty, Jiang [Jia06] introduces fleet re-timing as a dy-namic scheduling mechanism and supplements re-fleeting with re-timing. Re-timing the sched-ule and re-fleeting of aircraft increase or decrease the number of connecting itineraries available to passengers (compared to the original schedule) and increase or decrease the number of seats available in the affected markets. Jiang shows that this can help to reduce passenger spill by better matching capacity. The dynamic scheduling approach modifies the existing flight sched-ule and fleet assignments, keeping existing bookings still feasible (though possibly re-timed), so that realized demand can be accommodated as much as possible. Jiang [Jia06] shows that through the dynamic mechanisms of flight re-timing and re-fleeting, even 'optimized' schedules can be improved by re-designing the schedule at regular intervals.
Shebalov and Klabjan [SK06] propose robust approaches tailored to specific instances of crew scheduling problems by exploiting the specialized structure of the problem. The authors introduce the concept of move-up crews and improve costs by swapping crews, and show the resulting benefits.
to reduce delay propagation along the downstream flight legs. They show that aircraft routings can be made significantly more robust by re-arranging the slack in the schedule to place it where it is needed to a greater extent. Thus robustness can be improved without changing the total slack and adding to planning costs. In addition, they introduce a new approach to minimize the number of passenger mis-connections by re-timing the departure times of flight legs within a small time window. Their approach helps to improve passenger connection times without significantly increasing costs. Their approach is very relevant to this work, and will be discussed in greater detail in later sections. AhmadBeygi, Cohn and Lapp [ACLlO] expand on this notion of propagated delay and model propagation of delay using the concept of propagation trees. They measure delay propagation to aircraft, passengers and crew, and measure the extent that each delay propagated down a tree. Using simulation, they show that airline schedules that consider delay propagation can significantly decrease operational delays without increasing planning costs.
2.1.2 Motivation
In this chapter, our focus is on the aircraft routing step of the airline scheduling process. The aircraft routing problem is to find a feasible sequence of flight legs, called aircraft routings or rotations, to be operated by each aircraft so that maintenance restrictions on aircraft are satisfied. Each flight is required to be assigned to (or covered by) exactly one aircraft, using no more than the available number of available aircraft. and meeting all maintenance requirements. Though robust planning is required at every step of the airline scheduling process, we choose aircraft routing because of its high impact on schedule reliability and relatively low impact on crew costs, flight costs and passenger revenues [LCB06].
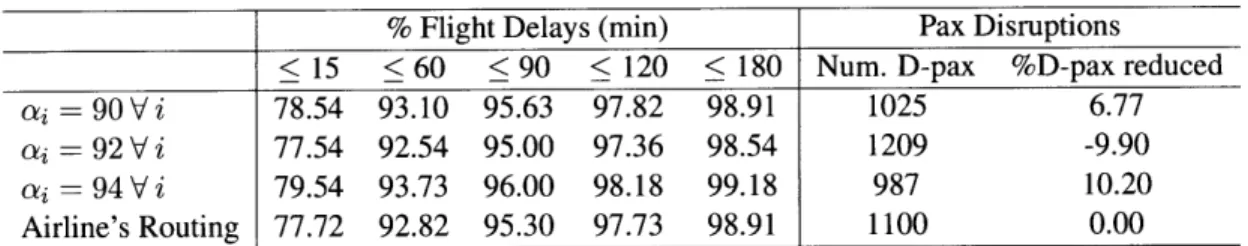
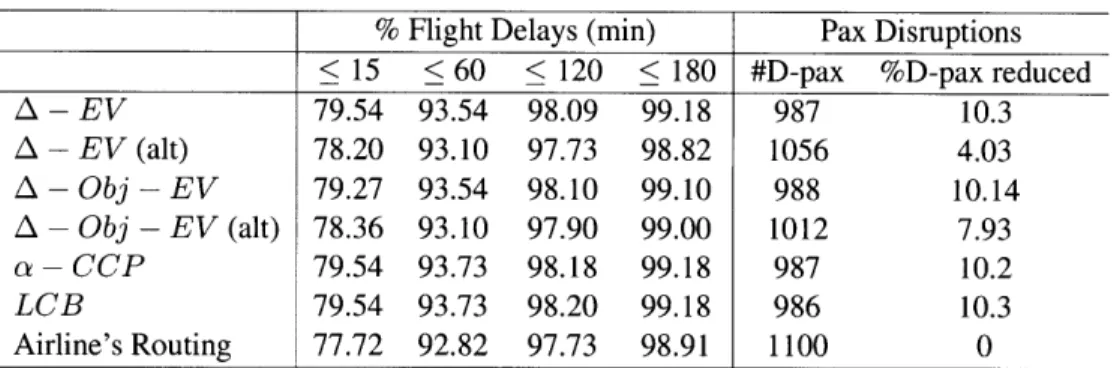
We demonstrate how aircraft routings differ and what we mean by robust aircraft routings, with an example. In Table 2.1, we report performance for 7 aircraft routings as measured by the percent of flights in the routing that arrive within 15 minutes, 30 minutes, 60 minutes, 120 minutes and 180 minutes of their respective scheduled arrival times. Note that these percent-ages were calculated over 22 days of operations of a major U.S. airline. For the instances under consideration in this paper, all of which are drawn from actual airline operations, we compare
metrics of interest, as detailed in @2.4.1. The reported variability in flight delays is signifi-cant, as even small differences in the range of 1% can improve/deteriorate the airline's ranking with respect to the DoT's 15-minute on-time performance metric [Bur09c]. Because airlines do not typically explicitly consider delays in selecting aircraft routings, the airline effectively might choose at random any of these routings, and thus, can incur high delays. To illustrate, for this instance, the aircraft routing operated by the airline is Routing 5, with DoT on-time performance ranking third from the bottom. Moreover, in addition to aircraft delay disparities, different routings can lead to different levels of passenger disruptions and delays. A passenger is considered to be disrupted if one or more flight legs on his itinerary are canceled, or if delays cause insufficient connection time to the next flight leg in his/her itinerary. The percentage of passenger disruptions decreased relative to the airline's routing (% D-pax reduced)are shown in Table 2.1. Routings 1 and 2 can vastly improve upon the airline's routing without any additional resources, while Routing 7 can deteriorate the airline's performance greatly.
Flight Delays Pax Disruptions
Routing <15 min <30 min <60 min <120 min <180 min #D-pax %D-pax reduced
Routing 1 79.1 86.7 93.4 98.0 99.1 988 10.14 Routing 2 78.8 86.8 93.2 98.2 99.2 986 10.30 Routing 3 78.3 86.2 92.9 98.1 99.0 1028 6.50 Routing 4 78.3 86.0 92.9 97.5 98.6 1047 4.80 Routing 5 77.7 85.8 92.8 97.7 98.9 1100 0.00 Routing 6 77.6 85.7 92.4 97.4 98.6 1057 3.90 Routing 7 76.5 84.7 92.0 97.2 98.5 1223 -11.20
Table 2.1: Flight Delay Percentages and Passenger Disruptions of Feasible Routings, N2
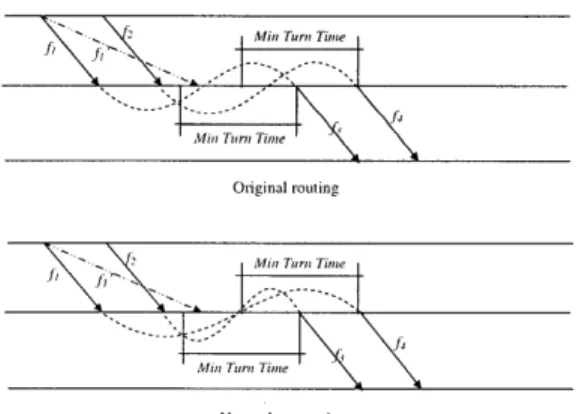
The relationship between aircraft routings and delays and disruptions can be explained by the phenomenon of propagated delays. In network structures, flight delays can be divided into two components [LCB06]: independent delays that originate at the flight's origin or during the flight, and propagated delays resulting from delays in upstream flights that are not absorbed by slack time between flight legs. Delay propagation is illustrated in Fig. 2-1. The solid arrows show the planned schedule for flights fi and f2; and the dotted arrows the operated schedule. PDT, ADT, PAT and AAT are the planned departure time, actual departure time, planned arrival time and actual arrival time respectively, of flight f2. In Figure 2-1, flight fi is delayed, and its delay causes the remaining slack time between flight fi's arrival and f2's scheduled
departure to be less than the minimum connection time required for the same aircraft to fly both flight legs. This causes propagated delay PD for flight leg f2. In addition, independent delay is incurred by f2, both at its departure (IDD) and its arrival (IAD), resulting in total departure delay (TDD) and total arrival delay (TAD). However, by changing the sequence of flights operated by each aircraft, propagated delay can be reduced (Figure 2-2). This involves changes in the routings of aircraft, but because no new aircraft are being added and the flight schedule remains unchanged, the total slack in the system is not altered, instead only the positioning of the slack is changed.
.4PDT ADT
Slack Min Turn Time
PAT AAT
PD IAD TDD
Figure 2-1: Delay Propagation along an Aircraft Route
Mitt Drr Time Mit 'r
Original routin.
-in Turn Time
New robust routing
Figure 2-2: Robust Routing with Optimal Slack Allocation
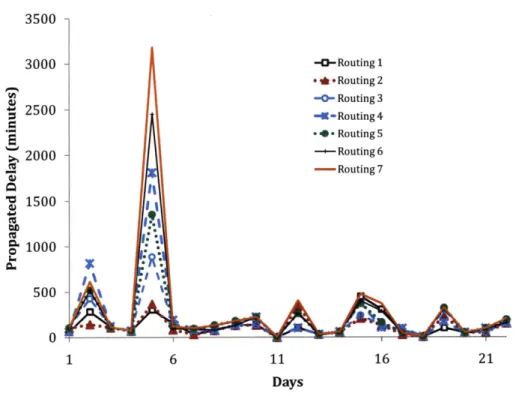
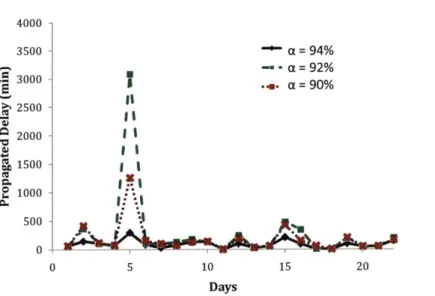
For the airline we study, propagated delay typically represents 20% to 30% of total flight delay [LCB06]. Because total independent delay is a constant for the flight schedule, reducing delay propagation by choosing Routing 1 instead of, for example, Routing 7 has the effect of
reducing total delay. The differences in propagated delays for Routings 1-7 are shown in Fig
2-3. Different aircraft routings are not very different on 'good' days like Day 10, but differences
become apparent on 'bad' days like Day 5.
3500 -3000 - -0-Routing 1 * eRouting 2 -0- Routing 3 2500 ~ -- Routing4 - -. Routing 5 2000 - -'-Routing 6 -- Routing 7 In' 1500-1000 500
i
0 1 6 11 16 21 DaysFigure 2-3: Propagated Delays of Feasible Aircraft Routings, N2
2.1.2.1 Discussion of Metrics
Ideally, good solutions to airline scheduling problems ensure low levels of delay for flights, and good travel experience with low passenger delays and disruptions. Metrics, then, such as total flight delay minutes, total cost of delay, 15-minute on-time performance, 30-min on-time per-formance, and 60-minute on-time perper-formance, are all examples of measures that reflect airline schedule reliability and robustness. A difficulty, however, is that these metrics are not always aligned with each other. For example, the 15-minute on-time performance metric does not re-flect delays greater than 15 minutes, and therefore maximizing 15-minute on-time performance is not the same as minimizing total delay minutes. Similarly, minimizing aircraft delay minutes is different from minimizing passenger delay minutes or passenger disruptions because fewer passengers can be disrupted by holding flights to allow passengers to make their connections, thus increasing total aircraft and passenger delays.
2.1.3
Contributions
In this chapter, we study three different approaches to robustness in aircraft routing, and hence, airline scheduling - two that are generally applicable, the extreme-value based approach and a probabilistic chance-constrained programming approach; and one that is a tailored approach proposed by Lan, Clarke and Barnhart [LCB06]. The extreme-value approach considered is the robust optimization approach of Bertsimas and Sim [BSO4], [BSO3] and the probabilistic approach is the Chance-Constrained Programming approach of Charnes and Cooper [CC59], [CC63]. We begin by showing how to model the robust aircraft routing problem using these three approaches, and identify their respective limitations; suggesting extensions and enhance-ments to the models to address these limitations. We then evaluate the similarities and differ-ences in models and solutions generated by these different approaches, using a simulation-based evaluator. The findings and extensions from this work are generally applicable to the broad class of network-based resource allocation problems.
2.1.4 Outline
In §2.2 we discuss Charnes and Cooper's Chance-Constrained Programming and Bertsimas and Sim's extreme-value approach. In §2.3, we present the three classes of robust models for aircraft routing. For this application, we present Charnes and Cooper's Chance-Constrained Program-ming formulation, the robust optimization formulation of Bertsimas and Sim, and Lan, Clarke and Barnhart's robust aircraft routing formulation. In addition, we propose extensions and en-hancements to the general classes of models in §2.3. We present the experimental set-up for our computations, and details of the simulator built to evaluate the performances of the models in §2.4. In §2.5, we compare the models and solutions generated by the different approaches in terms of complexity and run times (@2.5.1), model parameters (@2.5.2) and modeling paradigms
(@2.5.3), and show how robust solutions may be generated by all classes of models. In §2.6, we
2.2
Robust Models of Bertsimas and Sim, and Charnes and
Cooper
2.2.1
Robust Formulation of Bertsimas and Sim
Consider a standard linear program, that is:max cTx (2.1)
s.t.
a>3
zj < b
(2.2)
1< x u. (2.3)
Soyster [Soy73] considers column-wise uncertainty, where each column Aj of the constraint matrix belongs to a convex set Kj. He shows that the above problem is equivalent to the fol-lowing robust formulation:
max cTx (2.4)
s.t. di zj < b K (2.5)
jEJ
I < x K u. (2.6)
where di - suPAj EK (aij). This means that extreme (or worst-case) values of coefficients
that effectively maximize the amount of slack for the nominal problem are used in the 'robust' model. The use of worst-case values results in solutions that are far from optimal for many realizations of the constraint matrix coefficients.
Bertsimas and Sim [BSO4] argue that worst-case approaches such as that of Soyster, are too conservative, and hence, expensive. Instead, they suggest an approach aimed at avoiding the overly conservative tendencies of Soyster's approach by providing a mechanism to control the 'degree of conservatism'.
In the approach of Bertsimas and Sim, all uncertainty is assumed to be located in the coeffi-cients of the A matrix. By performing some simple transformations and rewriting A, uncertainty
in c and b can also be captured. By changing the objective function to maximize z and adding the constraint z - cTx < 0, the objective function can be moved into the A matrix, thus
en-abling uncertainty in the objective function coefficients to be captured. Similarly, if we have uncertainty in the right-hand-side b-vector, the b-vector values can be subtracted from the left-hand side and the right-left-hand side can be replaced by zero. The assumption of uncertainty in the A-matrix therefore incurs no loss of generality.
Each entry of of the left-hand side of the constraint matrix, A, is assumed to be a random variable with di being the symmetric, unbounded variable corresponding to the (i,
j)th
entry of A. No actual probability distribution of the random variable is assumed, only an interval of values that dij can assume. Specifically, a2 denotes the nominal value of dij, which is used inthe deterministic formulation, and dij is the half-interval of dij. Hence, dij can take on values in the interval [ai2 - igj, ai2 + ij ] and the nominal value aij is the mean value of the symmetric
distribution. The extreme values that di can take are aij - dij and aij + dij.
Let J be the set of coefficients for constraint i that are subject to parameter uncertainty, that is, dij,
j
E Ji takes values from a symmetric distribution as described above. For each constrainti, there is a parameter Fi which can take a (possibly continuous) value in the interval [0,
IJil].
Because it is unlikely that all |JiI coefficients will assume their worst-case (or extreme) values, Fi is used as a means of adjusting the 'level of protection'. The Bertsimas-Sim formulation protects against the case when up to yi of the
|Ji
coefficients are allowed to assume their extreme values, for all constraints i.The corresponding robust non-linear model according to the Bertsimas-Sim model can then be written as:
max cTx (2.7)
s.t. aijxj
+ max dijyj + (Fi - [FiJ)dit yt} < bi V i (2.8)
{siu{t2}Is?;J2,Sil=tFJ,ticJ, g s E}
- Yj < Xj < Y3 Vj (2.9)
I< x < u (2.10)
Because F. can take on continuous values, up to
[i]
of the coefficients dij in constraint i are allowed to take on their worst-case values, and one coefficient ait changes by (F, - [Fij)dit. In the above formulation, Si represents the set of uncertain parameters in constraint i that take on their extreme values, such that ISil = [j], Si C J. {ti} indicates the coefficient ait , forconstraint i, that changes by (Fi - [Fij)diti.
For the ith constraint, the term max
{
diiyjY+
(FT [Fij )&t yt} {Siufti}|SicJi,|siI=[Tij,tiE~liv Si}jESi
is a protection function that protects against the worst-case realizations of all dig,
j
E Ji. The parameterized protection function thus uses Fj to offer various levels of protection. [Fij indi-cates the minimum number of coefficients in constraint i that can assume their worst case values without destroying feasibility of the solution. Fj = 0 represents the deterministic or nominal case, whereas Fi JiI reduces this formulation to the Soyster formulation.Bertsimas and Sim [BSO4] prove that the above non-linear formulation (2.7) -(2.11) can be cast as a deterministic linear program, as follows:
max cTx (2.12)
s.t.
Y
aijx + zF 1 + pij < bi Vi E I (2.13)jEJ jCJi
Zi + Pij > ijyj Vi C I, VjE Ji (2.14)
- Y3 < x < y3 Vj E J (2.15)
< X < u (2.16)
pij > 0 Vi
E I, VjE
Ji (2.17)yj > 0 (2.18)
zi > 0 (2.19)
The detailed proof of the equivalence of (2.12)-(2.19) with (2.7)-(2.11) is in [BSO4].
Thus, the Bertsimas-Sim robust optimization approach ensures that the form of the math program remains linear, and hence more tractable than formulations with non-linearities. Bert-simas and Sim [BSO4] also provide probabilistic guarantees on the feasibility of constraints when more than Fj coefficients take on their worst-case values. Moreover, they show how this
formulation can be applied to portfolio optimization, knapsack problems, supply chain manage-ment [BT03], and network flows [BSO3] in order to obtain robust solutions.
The advantages of the Bertsimas-Sim model are:
" It is generally applicable to linear programs and integer programs.
" Linear integer programs remain linear integer programs, but contain more variables, de-grading tractability minimally.
" Probability distributions for the uncertain data are not required to be known. Uncertainty
can be captured knowing the symmetric bounds of variation alone.
" Adjustments to the 'level of robustness' can be made using the F parameter, thereby
providing measures of the price of robustness, that is, the changes in planned objective function value with changes in protection level. Robustness involves backing off from optimality to gain solutions less vulnerable to uncertainty, implying that there is a price associated with achieving each level of robustness.
" This model, with minor alterations, can capture simple correlations between uncertain
data in a constraint [BSO4]. However, it cannot capture correlations among uncertain data across constraints.
The approach, however, also has some limitations:
" To determine the change in planned costs (or profits) as a function of the level of
'protec-tion', the problem has to be re-solved multiple times, once for each different value of Fi, for all i. Because the bounds are also not tight, there are very few guidelines to the choice of Fi. This poses computational challenges for large-scale problems.
* It assumes symmetric and bounded distributions of uncertainty of parameters about their nominal values.
" It does not incorporate knowledge of probability distributions, if known. This can result