HAL Id: hal-02108532
https://hal.archives-ouvertes.fr/hal-02108532
Submitted on 29 Oct 2020
HAL is a multi-disciplinary open access
archive for the deposit and dissemination of
sci-entific research documents, whether they are
pub-lished or not. The documents may come from
teaching and research institutions in France or
abroad, or from public or private research centers.
L’archive ouverte pluridisciplinaire HAL, est
destinée au dépôt et à la diffusion de documents
scientifiques de niveau recherche, publiés ou non,
émanant des établissements d’enseignement et de
recherche français ou étrangers, des laboratoires
publics ou privés.
Exploring high repetitivity remote sensing time series
for mapping and monitoring natural habitats - A new
approach combining OBIA and k-partite graphs
Fabio Güttler, Samuel Alleaume, Christina Corbane, Dino Ienco, J. Nin,
Pascal Poncelet, Maguelonne Teisseire
To cite this version:
Fabio Güttler, Samuel Alleaume, Christina Corbane, Dino Ienco, J. Nin, et al.. Exploring high
repetitivity remote sensing time series for mapping and monitoring natural habitats - A new approach
combining OBIA and k-partite graphs. IEEE International Symposium on Geoscience and Remote
Sensing (IGARSS), Jul 2014, Quebec City, Canada. pp.3930-3933, �10.1109/IGARSS.2014.6947344�.
�hal-02108532�
EXPLORING HIGH REPETITIVITY REMOTE SENSING TIME SERIES FOR MAPPING
AND MONITORING NATURAL HABITATS – A NEW APPROACH COMBINING OBIA AND
K-PARTITE GRAPHS
Güttler F.
1, Alleaume S.
1, Corbane C.
1, Ienco D.
1, Nin J.
2, Poncelet P.
3, Teisseire M.
11
Irstea, UMR TETIS, Montpellier, France
2
Universitat Politècnica de Catalunya (BarcelonaTech), Barcelona, Spain
3LIRMM, CNRS, Montpellier, France
ABSTRACT
High repetitivity remote sensing could substantially improve natural habitats monitoring and mapping in the next years. However, dense time series of satellite images require new processing methodologies. In this paper we proposed an approach which combines Object Based Image Analysis (OBIA) and k-partite graphs for detecting spatiotemporal evolutions in a Mediterranean protected site composed of several types of natural and semi-natural habitats. The method was applied over a recent dataset (SPOT4 Take-5) specially conceived to simulate the acquisition frequency of the future Sentinel-2 satellites. The results indicate our method is capable to synthesize complex spatiotemporal evolutions in a semi-automatic way, therefore offering a new tool to analyze high repetitivity satellite time series.
Index Terms - Natural habitats monitoring, remote
sensing time series, OBIA, graph representation, SPOT4 Take-5.
1. INTRODUCTION
Enhancing the frequency of satellite acquisitions represents a key issue for Earth Observation community nowadays. The upcoming Sentinel-2 satellites, with a 5-day revisit time, will lead time series analysis of high resolution optical images into a new level of complexity. This kind of high revisit capacity will open new possibilities for several applications such as mapping and monitoring natural habitats. However, close temporal acquisition requires new methodologies for time series analyses as advertised by the scientific community [1, 2]. Recent reviews about the integration of remote sensing for conservation monitoring [3] and Natura 2000 habitat monitoring [4] pointed out remote sensing as a strong, but still underexploited, tool. In this paper we describe a new framework combining Object Based Image Analysis (OBIA) and k-partite graphs for studying spatiotemporal evolutions of natural and semi-natural
habitats in a Mediterranean protected site. Our results were obtained from the analysis of a recent high repetitivity time series dataset provided by the SPOT4 Take-5 experience, carried out by the CNES during the first semester of 2013 with the purpose of simulating Sentinel-2 time series.
2. METHODS
Our study was performed within the Lower Aude Valley Natura 2000 site, located in south of France (43°14'22.85" N 3°11'52.24" E). Contiguous to the Mediterranean Sea, the site spreads over 4,842 ha and is mainly dominated (56.3 %) by Natural Habitat types of Community interest (NHCI). In total, 19 NHCI are part of the site, including 5 priority habitat types. The most widespread habitats are: Mediterranean salt meadows, Coastal lagoons and Mediterranean halophilous scrubs. From February to June 2013, the SPOT4 satellite acquired 29 images over the study site (one image every 5 days) in the context of the Take-5 experience. Only 8 images were completely cloudy free over the whole site. To avoid excessive irregular sampling we kept only the 5 dates presented in table 1. The images were provided at level-2A (ortho-rectified and corrected from atmospheric, environmental and slope effects) by the THEIA Land Data Centre.
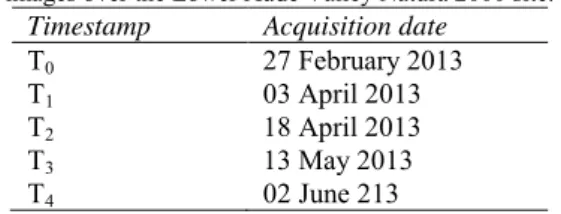
Table 1. Acquisition date of the five selected SPOT4 Take-5 images over the Lower Aude Valley Natura 2000 site.
Timestamp Acquisition date
T0 27 February 2013
T1 03 April 2013
T2 18 April 2013
T3 13 May 2013
T4 02 June 213
From our time series, we aimed to extract a set of k-partite graphs describing the evolution of the natural areas within the site. More in detail, each graph depicts a single area that
evolves during the time. The general process we developed can be divided in 4 main steps as shown in figure 1.
After some preprocessing and data standardization (step 1) which includes spatial subset and spectral indices computation, we segment the images individually (step 2). Six raster layers are used for image segmentation, four of them correspond to the SPOT4 spectral bands and the other two are the Normalized Difference Vegetation Index (NDVI) [5] and the Normalized Difference Water Index (NDWI) [6]. Image segmentation was performed in
eCognition Developer 8.8.1 (multiresolution segmentation
algorithm) throughout a hierarchical rule-set resulting in a set of objects per timestamp (around 800-1000). The next main step (step 3) involves the selection of particular zones (Bounding Boxes) to monitor during the time. The set of Bounding Boxes is chosen among all the objects obtained over all the timestamps. We select the Bounding Boxes following three criteria: a) obtain a good coverage of all the study area, b) reduce the overlapping among Bounding Boxes and c) constrain the process to select big objects. The coverage requirement lies on the hypothesis that we would extract as much information as possible from the time series images and for this reason we will cover the entire study area. The second requirement helps the process to reduce redundancy and avoid following the same zone more than once. The last criterion specifies the following hypothesis: big objects are assumed to delimitate the maximum extent of a particular phenomenon. For this reason we need to detect such particular spatial configuration in order to follow a phenomenon throughout time.
Once the set of Bounding Boxes is filtered out, an evolution graph is created for each of them (step 4). Given a Bounding Box BB, we project BB over each timestamp of the time series and we select the objects overlapping with BB. The graph is built linking the objects of timestamp i with the objects of timestamp i+1. The weight of the link represents the degree of overlap between two objects. In this way we obtain graphs that have as many layers as the number of images in the time series. Another intrinsic characteristic of an evolution graph is that for a certain layer it will contain only one object (corresponding to the Bounding Box that constrains the graph spatial extent). Logically objects belonging to the same timestamp are not connected; this is the same for objects not belonging to two successive timestamps.
3. RESULTS
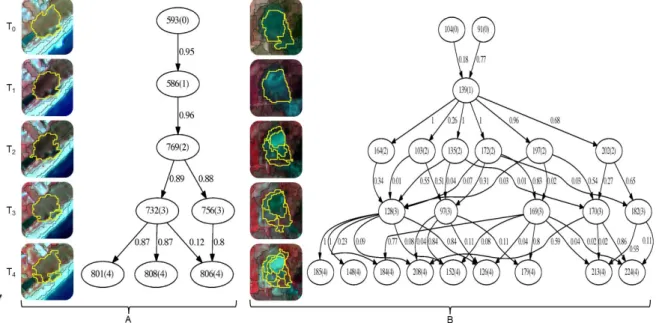
In total, 551 evolution graphs were generated for the entire Lower Aude Valley site. Each of the resulting graphs synthesizes the temporal behaviour of a specific area which can be guided by particular changes and evolutions, like phenological cycles or environmental events (i.e. flooding, fire, etc.). For the natural part of the site (non-agricultural), each graph represents a complex of natural habitats. Figure 2 presents two examples of evolution graphs obtained over areas characterized by distinct natural habitats and environmental factors.
The first example (A) presents a quite simple evolution graph as the boundaries of the objects remain very similar from one time stamp to the next one. This area is dominated mainly by halo-psammophile meadows, coastal-saltmarsh
grass swards and Mediterranean saltmarsh scrubs. From T0
up to T2 the graph contains only a single object per layer,
afterwards two small peripheral objects appear. By analyzing the objects spectral content (bands and vegetation indices), we notice gradual and smoothed changes (figure 3). The NDVI in the end of February (T0) is around 0.33 and
grows gradually up to 0.45 (without considering the peripheral objects). This increase, from the winter up to end of the spring, corresponds to the expected changes with regard to the phenology of those habitats. The peripheral objects pointed to some interesting local variations. The first one appears at T3 and corresponds to the area closer to the
coastal dunes. The vegetation is sparser and the soil
response contributes to keeping the values NDVI lower than 0.35. The second peripheral object appears in the last timestamp and is contiguous to a small coastal pond. The wetness of this area should contribute to a better vegetation development as the NDVI attains 0.52. NDWI values, which informs about vegetation liquid water content, are low (from 0.0 up to 0.18). Nevertheless, the temporal behavior is similar to those described for the NDVI.
The graph structure of the second example (B) is much more complex and encloses several objects in most of the layers. We can observe some drastic radiometric changes throughout the time series. Graph B represents the evolution of a temporary pond. Flooded during the winter (T0) and the
Figure 2. Examples of evolution graphs for (A) coastal meadows and scrubs and (B) temporary pond.
Figure 3. NDVI temporal profiles of the evolution graphs A and B (showed in fig.2). Dots correspond to the mean
beginning of spring (T1), the pond dries up progressively
starting from T2. The water is gradually replaced by some
pioneer terrestrial vegetation, i.e. Salicornia patula and annual Suaeda sp. Habitat spatial differentiation will depend mainly on the local variations of soil salinity and submersion time. Southern and Southeastern parts of the former pond will present more exuberant vegetation and denser covering of the soil. Such developments can be observed since T2 and
subsist up to last timestamp (objects presenting the higher NDVI values on figure 3 – graph B). Flooded areas as well as non-vegetated surfaces can follow during time and are also easily detectable in the NDVI profiles (negative and near zero values).NDWI evolutions are also informative to follow the annuals colonization or the emergence of bare soils but should not be used detect flooding events.
4. CONCLUSIONS
The approach described here allows connecting objects all along the time series even if they were originally obtained from independent segmentations. The combination of OBIA and k-partite graphs offers a new tool to analyze in-deep the spatiotemporal evolutions of a particular area. Natural and semi-natural habitats are characterized by phenological cycles and are sometimes associated to seasonal controlling factors, like flooding in our case. High repetitivity satellite time series provide relevant information to characterize such evolutions but the manual analysis of is a very hard task even for a skilled image analyst or an ecology field expert. In a more automatic way, the graphs generated by our approach synthesize complex spatiotemporal evolutions and can be useful for this kind of time-consuming task. Actually, graph structure associated to spectral content of the objects provides complementary and spatially pertinent information allowing prompt analysis of dense time series. As future improvements we plan to develop ranking and clustering algorithms for the evolution graphs. This higher level information should help the expert to post-process the results as the graphs will be already organized in groups with similar temporal behavior. Also, ranking methods can be useful to highlight the most dynamic areas and the timestamps when the most important changes arise. In our study case, only the most frequent and ecologically coherent associations (complex of habitats) were analyzed as the spatial resolution of SPOT-4 images (20m) is not enough to individualize most of the Lower Aude Valley natural habitats. Another data limitation is related the time length of the Take-5 experience, which concerned only the first semester of 2013 and avoided the observation of complete phenological cycles. To a certain extent, the upcoming Sentinel-2 time series should overcome these difficulties (spatial resolution of 10 m for visible-NIR bands and continuous acquisition expected for about 7 years). Lastly, the combination of punctual very high spatial resolution imagery (i.e. less than 2 m) should be considered as a
potential option to improve the delimitation of natural habitats.
5. ACKNOWLEDGEMENTS
The authors of this work would like to acknowledge the financial support of the French State managed by the National Research Agency in the framework of the program "Investissements d'Avenir" through the support of the GEOSUD project (ANR-10-EQPX-20).
6. REFERENCES
[1] ESA, "Sentinel-2 Preparatory Symposium: session summaries," European Space Agency, Frascati2012. [2] T. Blaschke, G. J. Hay, M. Kelly, S. Lang, P. Hofmann,
E. Addink, et al., "Geographic Object-Based Image Analysis – Towards a new paradigm," ISPRS Journal of
Photogrammetry and Remote Sensing, vol. 87, pp.
180-191, 1// 2014.
[3] H. Nagendra, R. Lucas, J. P. Honrado, R. H. G. Jongman, C. Tarantino, M. Adamo, et al., "Remote sensing for conservation monitoring: Assessing protected areas, habitat extent, habitat condition, species diversity, and threats," Ecological Indicators, vol. 33, pp. 45-59, 2013.
[4] J. Vanden Borre, D. Paelinckx, C. A. Mücher, L. Kooistra, B. Haest, G. De Blust, et al., "Integrating remote sensing in Natura 2000 habitat monitoring: Prospects on the way forward," Journal for Nature
Conservation, vol. 19, pp. 116-125, 2011.
[5] J. Rouse Jr, R. Haas, J. Schell, and D. Deering, "Monitoring vegetation systems in the Great Plains with ERTS," NASA special publication, vol. 351, p. 309, 1974.
[6] B.-C. Gao, "NDWI—A normalized difference water index for remote sensing of vegetation liquid water from space," Remote Sensing of Environment, vol. 58, pp. 257-266, 12// 1996.