Publisher’s version / Version de l'éditeur:
Vous avez des questions? Nous pouvons vous aider. Pour communiquer directement avec un auteur, consultez la
première page de la revue dans laquelle son article a été publié afin de trouver ses coordonnées. Si vous n’arrivez pas à les repérer, communiquez avec nous à PublicationsArchive-ArchivesPublications@nrc-cnrc.gc.ca.
Questions? Contact the NRC Publications Archive team at
PublicationsArchive-ArchivesPublications@nrc-cnrc.gc.ca. If you wish to email the authors directly, please see the first page of the publication for their contact information.
https://publications-cnrc.canada.ca/fra/droits
L’accès à ce site Web et l’utilisation de son contenu sont assujettis aux conditions présentées dans le site LISEZ CES CONDITIONS ATTENTIVEMENT AVANT D’UTILISER CE SITE WEB.
25th IAHR International Symposium on ICE, 2020-11-25
READ THESE TERMS AND CONDITIONS CAREFULLY BEFORE USING THIS WEBSITE.
https://nrc-publications.canada.ca/eng/copyright
NRC Publications Archive Record / Notice des Archives des publications du CNRC : https://nrc-publications.canada.ca/eng/view/object/?id=31225889-4877-4549-923e-cbe9cf001d11 https://publications-cnrc.canada.ca/fra/voir/objet/?id=31225889-4877-4549-923e-cbe9cf001d11
NRC Publications Archive
Archives des publications du CNRC
This publication could be one of several versions: author’s original, accepted manuscript or the publisher’s version. / La version de cette publication peut être l’une des suivantes : la version prépublication de l’auteur, la version acceptée du manuscrit ou la version de l’éditeur.
Access and use of this website and the material on it are subject to the Terms and Conditions set forth at Spallation-based numerical simulation of ice-induced vibration of a structure
1
Spallation-Based Numerical Simulation of
Ice-Induced Vibration of a Structure
R. Gagnon
OCRE/NRC St. John’s, NL, Canada
Robert.Gagnon@nrc-cnrc.gc.ca
A full-scale numerical simulation model of ice-induced vibration of structures has been developed (using LS-DynaTM) and applied to the Molikpaq facility for an ice-encroachment event similar to that which occurred on May 12, 1986 in the Beaufort Sea. The bulk ice sheet used for the simulations had elastic properties, and its dimensions were 6 km x 6 km x 2.5 m. Where ice crushing occurred at the structure-ice interface the ice model used was a crushable foam that incorporated regular spallation events. Typical characteristics of ice-crushing in the brittle regime were manifested by the model. That is, a narrow horizontal hard zone (relatively-intact high-interface-pressure ice) was present in the mid-height region of the ice-edge contact area. Soft-zone material (shattered spall debris from the hard zone) was also represented. Evolution of the hard-zone contact area involved rapid reductions in size during spallation events, immediately followed by fast growth during consequent elastic surging of the near-field ice sheet and structure towards each other, and then some slower growth (due to the bulk ice-sheet velocity) until the next spalling event. The specified ‘thickness’ of the spalls was 5.4 cm, as previously determined from Molikpaq records of the frequency of the spalling events as a function of ice-sheet speed. Spallation (and associated rapid drops in load) occurred at regular intervals whenever a critical amount of hard-zone stress was reached at the ice-structure interface. The amplitude of the Molikpaq repetitive movements in response to the sawtooth loading from the spalling events depended on whether the resonant frequency of the structure/ice system was higher (for a strong response) or lower (for a weak response) than the spalling frequency, where the spalling frequency is directly proportional to the ice-sheet speed. The continuously variable resonant frequency of the structure/ice system had a maximal limiting value (~ 2.1 Hz), designated as the At-Spallation-Resonant-Frequency (ASRF), that was essentially determined by the time duration of load drops at spallation events. The simulations inherently accounted for the variable effective mass and effective spring constant of the ice sheet.
25
thIAHR International Symposium on Ice
2
1. Introduction
Ice crushing induced vibration has been the subject of interest in many investigations since problems were first encountered for some structures when ice sheets moved against them. Examples are structures in Cook Inlet, Alaska (Blenkarn, 1970), the Baltic Sea (Määttänen, 1978) and in Bohai Bay, China (Yue and Bi, 2000). The most widely known and studied events are those associated with the Gulf Canada Resources Ltd. Molikpaq caisson facility that occurred in 1986 during operations at the Amauligak I-65 site in the Canadian Beaufort Sea. Various analytical and numerical approaches (e.g. Määttänen, 1978; Kärnä et al., 1999; Hendrikse and Nord, 2019; Gagnon, 2012) have been applied to explain ice crushing induced vibration. Gagnon (2012) analytically showed that new understandings of ice crushing, with emphasis on spalling behavior, can be applied to the problem when large-scale aspects of the ice are sufficiently taken into account and that this can explain ice-induced vibrations, including so called ‘lock-in’ behavior. Here we present a full-scale numerical model of ice-induced vibration (IIV) that is fundamentally based on ice spallation at the structure-ice interface. The model is applied to a well-documented test case of ice-induced vibration of the Molikpaq structure that occurred on the May 12, 1986 in the Canadian Beaufort Sea (Jefferies et al., 2011). The Molikpaq structure, and the ice sheet that encroached on it on May 12, have been described before (e.g. Gagnon, 2012).
2.0. Spallation and Ice Induced Vibration – A Brief Review
In order to understand the makeup of the numerical simulation model, particularly the spallation components and the physical processes represented therein, it will be helpful to review some earlier work on ice-induced vibration of structures. As a convenience to the reader, a few aspects are included here that are taken directly from Gagnon (2012). Various studies have shown that ice crushing, at least at rates in the brittle regime, is highly geometrical (e.g. Daley, 1991; Evans et al., 1984; Gagnon, 1999; Spencer and Masterson, 1993). That is, spalling events are determined for the most part by the geometry of the ice formation and the depth of penetration, where both can influence the level of confinement. If the rate of penetration varies then the spalling frequency varies accordingly since spalls depend on depth of penetration. This has been discussed by Gagnon (2011) in the context of the development of an ice crushing numerical model that incorporates spalling. The process surface is the actual surface of the ice during the crushing interaction. The geometry of the process surface is determined by the spalling geometry, the hard-zone geometry and the presence of shattered spall debris, i.e. crushed ice. There have been many direct visual observations using normal and high-speed video cameras of regular spalling behavior, both in laboratory and field experiments, that coordinates with regular intervals of penetration as determined from displacement sensors and load sensors used in conjunction with known equipment compliances (Gagnon, 1999). Hence, it is not unreasonable to think that regular spalling events were happening in the case of the 12 May, 1986 Molikpaq event. We may represent the ice sheet and its ice process surface during crushing as in Figure 1 where the sequence of spalls and their occurrence according to depth of penetration is illustrated. The type of spalling event that ties in closely with the ice sheet speed involves a pair of spalls breaking away at approximately the same time, one from the lower and one from the upper edge portion of the ice sheet. As the sheet moves towards the structure there is elastic stress buildup in the ice and structure in between spalling events. For example, this is evident in Figure 2 where the portion of the load record shown occurred at the end of the 12 May 1986 event when the ice was moving slowly. The mechanisms that enable the rapid penetration of ice during a spalling event are complex (Gagnon, 1999). Referring again to the Molikpaq event we can see the rapid ice penetrations that occur, that are enabled by these processes, at the spalling-induced sharp load drops where sudden associated strain releases (surges) occur (Figure 3, from Gagnon (2012)).
3
3.0. Numerical Model Components and Properties
All simulations were run using LS-DynaTM commercial software. These were conducted on a HP Z840 Workstation using 38 CPU’s. Depending on the initial ice-sheet speed (i.e. slower speeds took longer to run) and the number of spallation events included in a given simulation, the runtimes varied substantially and all but one were in the range (18 – 237 hours). One simulation, at the slowest ice-sheet speed, was deliberately left to run considerably past the point where spallations had stopped. Its runtime was ~ 336 hours. Characteristics of all model components are summarized in Tables 1 and 2. Here we are presenting results from one simulation primarily. 3.1. ‘Molikpaq’ Structure and Ice Sheet
The most efficient way to describe the model in a manner that gives the reader an appreciation for the large range of scales and element size is through a series of zoom-views from that of the full ice sheet down to the size of individual spalls at the ice/structure interface. Figure 4 shows the full model, i.e. using the 6 km x 6 km x 2.5 m ice sheet. Barely visible at this scale is the structure at the left edge mid position of the ice sheet that essentially represents a facility such as the Molikpaq. Figure 5 is a closer view at the scale of the structure. The model structure had a large Body-Block (22 m x 22 x 22 m) that represented the bulk effective mass of the Molikpaq. This was attached to a smaller Spring-Block (22 m x 22 m x 4 m) that had elastic properties and that served as the ‘spring’ component of the structure. The Spring-Block was in turn attached to a fixed rigid Base-Block (22 m x 22 m x 4 m). The three component structure system had a resonant frequency of 1.72 Hz, that is close enough to that of 1.80 Hz for the Molikpaq for our purposes. Figure 6 is a closer view of a stack of ridge-shaped entities called Hard-Zone-Spalls (HZS’s) prior to their sequential crushing against the Crushing-Plate. Figure 7 shows details of a single HZS and its associated Support-Plate.
Another component, known as the Edge-Plate (Figure 5), is attached to the edge of the Ice-Sheet. The Edge-Plate has a length dimension along the edge of the Ice-Sheet of 60 m, that is, it spans the full width of the actual Molikpaq structure and transmits load to the Ice-Sheet associated with the crushing activity. In Figure 6 the Crushing-Plate is actually attached to the structure Body-Block. LS-Dyna enables one to attach one rigid body to another even if they are not in physical contact. In Figure 6, each HZS is supported underneath it by a thin rigid ‘Support-Plate’ (not visible) consisting of shell elements with rigid properties. This is illustrated in Figure 7 for one of the HZS’s and a Support-Plate. In Figure 7 the two objects are separated for illustrative purposes, however, generally each HZS is in contact with the corresponding Support-Plate that supports it. All seven of the HZS Support-Plates are attached to the ice sheet Edge-Plate. Hence, when the ice sheet moves towards the structure the Support-Plates move with it and thereby push each HZS sequentially against the Crushing-Plate. This seemingly complicated arrangement is necessary to enable the Ice-Sheet and structure Body-Block (that both consist of large elements) to ‘crush’ against each other via the HZS’s (that are part of the Ice-Sheet) and the Crushing-Plate (that is part of the structure Body-Block), where both have necessarily small elements. Note that the mesh nodes that comprise the HZS’s, Support-Plate’s and the Crushing-Plate are constrained to movement only in the Y-direction, i.e. the direction of the ice-sheet movement.
Here we note that in actual crushing of an ice sheet against a structure, such as the Molikpaq, the ice contact zone (that includes hard-zone spallation events) spans the full width of the structure, i.e. ~ 60 m in the Molikpaq case. In principle, we could have created HZS’s that were 60 m in length, but the requirement of having small elements for the HZS’s would necessitate an unwieldy large number of elements, roughly 60 times the number of elements we presently have for the HZS’s. This would lead to memory issues and impractically long runtimes for the simulations. But one can achieve the intended behaviors in the simulation by enabling HZS’s of
4
reasonable length dimension (~ 0.9 m, in our case) to exert forces that are the same as what 60 meter long HZS’s would generate. This is done simply by applying crushable-foam interface pressures that are sixty-six times the pressure values that would be assigned to a 60 m HZS. Hence, we can apply realistic loads to the structure face using HZS’s of short length (and far fewer elements) that still provide all the characteristics of 60 m HZS’s. This strategy provides high computational efficiency while maintaining the overall integrity of the spallation mechanisms and hard-zone evolution. The specific shape of the ends of the HZS’s (Figures 6-7) is required so that when a HZS is crushing against the Crushing-Plate, no ‘naked edges’ (nodes without neighbors at the edge) interact with the Crushing-Plate. Such neighbor-less nodes would penetrate the crushing plate in an unrealistic manner that leads to error in interfacial forces. 4.0. Numerical Simulation Strategy
The load and displacement data from a simulation are shown below in Figures 8-10. At the beginning of any simulation (such as in Figure 8) the first thing that happens is that a uniform load of 100 MN is quickly applied to the surfaces of both the Crushing-Plate (associated with the structure) and the Edge-Plate (associated with the ice sheet). As discussed below, this load represents the ‘ambient’ load that is present throughout the simulation due to crushed ice that resides at the sides of the hard-zone contact area. Then the ice sheet is given an initial velocity (0.06 m/s in this case) towards the structure so that contact of the first HZS with the Crushing-Plate occurs and hard-zone load begins to accumulate. The load and HZS contact area continue to increase until the critical stress/strain is attained at the middle of the elongated ice-contact patch, at which point the HZS contact definition with the Crushing-Plate is automatically turned off by a switch that senses that the critical stress/strain has been attained. This results in an abrupt drop in load and onset of contact with the next HZS. Consequently load starts to increase again and the pattern repeats itself as the ice sheet continues its forward movement. Up to seven spallation events may be simulated in this fashion since the model presently contains seven stacked HZS’s. Note that we did not include water in these simulations because the water-related shear force on the moving ice sheet is negligible compared to the inertial force of the sheet. 5.0. Description of a Spallation Event
The ice sheet is 2.5 m thick, however the process surface of the ice contact consists of hard-zone relatively intact ice and soft-zone crushed ice. The thickness of the horizontal band of hard-zone contact area is much less than the ice sheet thickness, roughly 1/10 (from ice crushing experiments) at load peaks, and it expands from an initial value (zero in this case) to its maximum value during the time between the load peaks as load increases. The force generated by actual crushed ice in this type of scenario is fairly constant because the change in contact area of the crushed ice is small whenever a new spallation occurs and shatters to become crushed ice. So it is convenient, justifiable and computationally efficient to forgo creating an object to apply the crushed-ice load. Instead, we need only use LS-Dyna to apply the appropriate force on the structure and the ice sheet (i.e. 100 MN in this case, in rough correspondence with the May 12, 1986 Molikpaq event) to adequately represent the ‘constant’ background force field that the crushed ice would have created. To be more specific, that force was numerically applied to the elements of the Edge-Plate and the Crushing-Plate. The images of the model components therefore do not show an object representing the crushed ice because it was not necessary. In the simulation hard-zone contact areas originate from the interaction of the ridge-shaped model entities (HZS’s) consisting of intact ice that flatten against the Crushing-Plate as load is applied. The flattening is enabled by the crushable-foam property of these ‘Hard-Zone-Spalls’. Each Hard-Zone-Spall plays two important roles in the simulation: 1. When the peaked ridge of the HZS is pressed against the Crushing-Plate it flattens by an amount proportional to the applied load, thereby creating a hard-zone area in direct contact with the plate where the interface
5
pressure is high. 2. When the stress at the hard zone / Crushing-Plate interface reaches a critical prescribed value the simulation will switch off the contact definition of the Hard-Zone-Spall so that it no longer supports load, i.e. essentially taking it out of play. This corresponds to a spallation event where a portion of the hard-zone contact (in our case, all of it) separates and shatters to become crushed ice. There is consequently an abrupt drop in load at the ice / Crushing-Plate interface that is proportional to the size of the hard-zone contact area that was taken out of play. In the present case we have set up the simulation so that the spallation event happens when the next Hard-Zone-Spall entity in the sequential stack is about to make contact with the Crushing-Plate. This is achieved in LS-Dyna by using ON/OFF contact-definition switches that are triggered by a prescribed stress or strain in the Hard-Zone-Spall at the center of the flattened area
For elements of the HZS’s that are undergoing volumetric compression in the flattening region at the HZS/Crushing-Plate interface the curve describing the pressure vs fractional volume change had a shape qualitatively similar to that used by Gagnon (2011). The actual quantitative x and y coordinate pairs for the four points defining the curve in the present case are: 0.0, 0.0; 0.015, 450; 0.5, 900; and 1.0, 900, where each pair corresponds to Fractional Volumetric Strain and Yield Stress (MPa) respectively. If the contact patch actually spanned the whole width of the structure face (~ 60 m), then the x and y coordinate pairs for the four points defining the curve would be: 0.0, 0.0; 0.015, 6.75; 0.5, 13.5; and 1.0, 13.5, where each pair corresponds to Fractional Volumetric Strain and Yield Stress (MPa) respectively. The former values were suitably chosen to generate the desired change in load (about 127 MN) that maximal compression of the HZS’s, described above, would generate. With this strategy a reasonable facsimile of the magnitudes of the sawtooth load pattern generated near the end of the May 12, 1986 Molikpaq ice encroachment event could be obtained.
Figure 11 shows a sequence of 16 images from Simulation-2 depicting the behavior of two adjacent stacked HZS’s during a time interval that spans portions of two sequential sawteeth in the sawtooth load pattern (Figure 8). Figure 8 has markers that correspond to the images in Figure 11. The far-field speed of the ice sheet (0.06 m/s) is near constant for this relatively short period of time. The sequence starts at the midpoint in time between two spallation events (sharp load drops). At this point a certain amount of load has accumulated, above and beyond the ‘background load’ associated with the crushed ice that is ‘present’ at the sides of the hard-zone contact areas, but not shown. The corresponding interfacial pressure distributions within the contact zones are also shown in Figure 11. We remind the reader that pressure indicated in the contact zone (that in the simulation is about 0.9 m in length) appear high because they need to be adjusted to represent the actual pressure that would be applied to the structure surface across its full 60 meter face length. That is, the actual pressure across the whole face of the structure is the pressure indicated in Figure 11 multiplied by 0.9/60. On the other hand, the maximal vertical extent of the pressure patch is the same in the images (~ 0.20 m) as it would be across the whole face of the structure. The hard-zone horizontal contact band, where the crushable foam has flattened against the Crushing-Plate, continues to gradually grow in thickness with the continuing ice-sheet movement up to the point where the load peaks and a spallation abruptly occurs between images 6 and 7. Image 7 shows only the second HZS since the first one has been ‘switched off’. Note that Images 7 and 8 indicate a very rapid forward movement and flattening of the HZS compared to the earlier images. This is due to the rapid surge (Figure 10) of the Crushing-Plate (associated with the structure) and the HZS (associated with the Ice-Sheet) towards each other resulting from the release of elastic energy at the load drop. Following the rapid surge, the contact area of the HZS with the Crushing-Plate (as shown in images 9-16) continues to increase gradually as in images 1-6.
6
6. The Role of Resonance of the Structure / Ice System
We note that the simulation presented here is part of a larger set that we conducted for various ice-sheet speeds. The full set of results showed that the displacement amplitude response of the structure (e.g. Figure 9) to the sawtooth loading patterns (e.g. Figure 8) depended on whether the resonant frequency of the structure/ice system was higher (for a strong response) or lower (for a weak response) than the spalling frequency, where the spalling frequency is directly proportional to the ice-sheet speed. Furthermore, a maximal limiting resonant frequency (~ 2.1 Hz) of the structure/ice system was identified, designated as the At-Spallation-Resonant-Frequency (ASRF), as in Figure 9, and its value agreed reasonably well with the corresponding value (~ 2.0 Hz) identified in the Molikpaq May 12, 1986 event (Figure 3). The continuously variable resonant frequency of the structure/ice system partly depends on the effective mass and effective spring constant of the ice sheet, where both in turn depend on the cyclic loading frequency (i.e. spalling rate). Finally, amongst the simple simulations we conducted to obtain the effective mass and effective spring of the ice sheet using the method of Gagnon (2012), one involved directly applying a very fast cyclic load of 100 MN, with a half-cycle comparable to the duration of a load drop during spallation. The system resonant frequency determined for that case was ~ 2.1 Hz. This corroborates with the previously-identified ASRF.
7. Conclusions
We have presented a full 3D numerical model for ice induced vibration of structures that is based on documented aspects of ice crushing in the brittle regime. The model incorporates regular spallation events, and high-pressure and low-pressure zones. The simulation results agree quite well with the load and displacement data from a May 12, 1986 Molikpaq ice-induced vibration event. Furthermore, the results emphasized the important role that the resonant frequency of the structure/ice system plays.
Acknowledgements
The author is grateful to OCRE/NRC for its support of this work, and to Jungyong Wang for helpful technical discussions.
References
Blenkarn, K.A., 1970. Measurement and analysis of ice forces on Cook Inlet Structures. Proc. 2nd OTC Conf., Houston, TX, OTC 1261, vol. II, pp. 365–378.
Daley, C.G., 1991. Ice edge contact and failure. Cold Regions Science and Technology 21, 1–23. Evans, A.G., Palmer, A.C., Goodman, D.J., Ashby, M.F., Hutchison, J.W., Ponter, A.R.S., Williams, G.J., 1984. Indentation spalling of edge-loaded ice sheets. Proceedings of IAHR 1984, Hamburg, pp. 113–121.
Frederking, R., 2004. Ice Pressure Variations during Indentation. Proc IAHR Symposium on Ice, St. Petersburg, Russia, pp. 307–314.
Gagnon, R.E., 1999. Consistent observations of ice crushing in laboratory tests and field experiments covering three orders of magnitude in scale. Proc. POAC-99, Helsinki, Finland, 2, pp. 858–869.
Gagnon, R., 2011. A numerical model of ice crushing using a foam analogue. Cold Regions Science and Technology. 65 (3), 335–350.
7
Gagnon, R., 2012. An explanation for the Molikpaq May 12, 1986 event. Cold Regions Science and Technology 82 (2012) 75–93.
Hendrikse, H., Nord, T.S., 2019. Dynamic response of an offshore structure interacting with an ice floe failing in crushing. Marine Structures 65 (2019), 271-290.
Kärnä, T., Kamesaki, K., Tsukuda, H., 1999. A numerical model for dynamic ice– structure interaction. Computers and Structures 72, 645–658.
Määttänen, M., 1978. On conditions for the rise of self-excited ice-induced autonomous oscillations in slender marine pile structures. Winter Nav. Board, Finland, Res. Rep., 25. Määttänen, M., Marjavaara, P., Saarinen, S., 2011. Ice crushing pressure distribution against a
compliant stiffened panel. Proc. 21st Int. Conf. On Port and Ocean Engineering under Arctic Conditions, Montreal, Canada, POAC 2011, paper #038.
Spencer, P.A., Masterson, D.M., 1993. A geometrical model for pressure aspect-ratio effects in ice–structure interaction. Proceedings of the 12th International Conference on Offshore mechanics and Arctic Engineering, OMAE 1993, vol. 4, pp. 113–117.
Vaudrey, K.D., 1977. Determination of mechanical sea ice properties by large scale field beam experiments. In: Muggeridge, D.B. (Ed.), POAC'77—Fourth International Conference on Port and Ocean Engineering Under Arctic Conditions, vol. 1, pp. 529–543.
Yue, Q.J., Bi, X., 2000. Ice-induced jacket structure vibrations in Bohai Bay Sea. Journal of Cold Regions Engineering 14 (2), 81–92 (June 2000, Paper No 21698).
Figures and Tables
Figure 1. Schematic illustrating the sequence of spalls that will
occur as the ice sheet moves to the left and crushes against the Molikpaq structure. Regions of relatively soft crushed ice, located above and below a central region of relatively intact hard ice, are also indicated. Note that experimental studies have observed higher pressures in the middle of ice sheets during crushing (e.g. Määttänen et al., 2011; Frederking, 2004). Taken from Gagnon (2012).
Figure 4. Full model components.
The 6 km x 6 km x 2.5 m ice sheet is the main object visible at this scale. The other components are barely visible at the left edge of the ice sheet. Zoom-level 1.
Ice sheet Other model components
8
Table 1. Characteristics of Model Components. Note: The ice modulus values are within the range given by Vaudrey (1977).
Object Dimensions (m) Element Type/Size (m) Modulus (GPa) Density (kg/m3) Strain Property Mass (kg) Ice-Sheet 1 6000 x 6000 x 2.5 Solid 15 x 15 x 0.625 3.0 900 Elastic 81 x109 Ice-Sheet 2 6000 x 6000 x 2.5 Solid 15 x 15 x 0.625 1.5 900 Elastic 81 x109 Ice-Sheet 3 7000 x 15000 x 2.5 Solid 15 x 15 x 0.625 3.0 900 Elastic 236.3 x10⁹ Ice-Sheet ‘Edge-Plate’ 60 x 2.5 x 1.0 Solid 15 x .625 x .5 9.0 900 Rigid 150 Structure ‘Body-Block’ 22 x 22 x 22 Solid .5 x .5 x .5 5.0 8000 Rigid 85.2 x10⁶ Structure ‘Spring-Block’ 22 x 22 x 4 Solid .5 x .5 x (.051-.759) 0.0826 2000 Elastic 3.87 x10⁶ Structure ‘Base-Block’ 22 x 22 x 4 Solid .5 m x .5 m x .5 m 5.0 8000 Rigid 15.5 x10⁶ Structure ‘Crushing-Plate’ 2.024 x 0.998 x 0.2 Shell .038 x .025 1000.0 8000 Rigid Negligible ~ 3.2 x10³ Hard-Zone-Spall (a.k.a ‘HZS’)
See Table 2 Solid
Top view, .038 x .025 x .027 160.0 900 Crushable Foam Negligible ~ 14.1 Hard-Zone-Spall ‘Support-Plate’ Same as lower surface of spall Shell Top view, .038 x .025 1000.0 8000 Rigid Negligible ~ 554
Figure 2. A portion of the load record
acquired during the third ‘burst file’ data trace where the ice sheet was moving slowly against the Molikpaq structure. A spalling event is associated with each abrupt drop in load in the sawtooth pattern and these relieve the stress that builds up between the spalling episodes. Taken from Gagnon (2012).
Fig. 6. Load time series for the simulated
impact with the 524 tonne ice mass. The secondary ‘peak’ corresponds to the ice-knob contacting the hull plating that was supported by a frame. The oscillations in load at the top of the secondary peak correspond to elastic oscillations of the meshed hull segment due to the ice-knob impacting the frame.
Figure 3. Movement of the north face of the
Molikpaq in the north–south direction as the ice sheet crushes against it. The record corresponds to the same time period as shown in the load record in Figure 2. A rapid movement of the structure (about 10 mm) is evident at each spalling event. Taken from Gagnon (2012). Note: The ‘ASRF oscillations’ are explained below.
Fig. 6. Load time series for the simulated impact
with the 524 tonne ice mass. The secondary ‘peak’ corresponds to the ice-knob contacting the hull plating that was supported by a frame. The oscillations in load at the top of the secondary peak correspond to elastic oscillations of the meshed hull segment due to the ice-knob impacting the frame.
9
Table 2. Characteristics of Model Components: Hard-Zone-Spall Dimensions - Particulars. Full Length (m) Ridge Length (m) Width (m) Base-to-Top Height (m)
Ridge Base-to-Top Height (m)
Thickness (m)
1.163 0.863 0.250 0.214 0.126 0.054
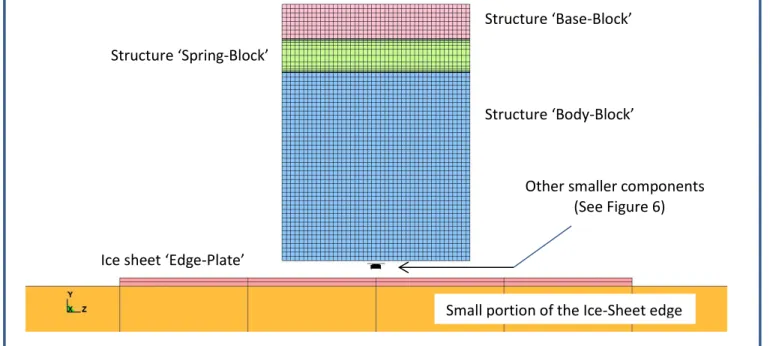
Figure 5. Various components of the model shown at a much smaller scale than that of Figure 4.
Zoom-level 2.
Structure ‘Base-Block’
Ice sheet ‘Edge-Plate’
Structure ‘Body-Block’ Structure ‘Spring-Block’
Small portion of the Ice-Sheet edge Other smaller components (See Figure 6)
Figure 6. Various components of the model. Note that some objects are attached to other objects
even though they may not be in physical contact. For example, the Crushing-Plate is attached to the structure Body-Block. Zoom-level 3.
Portion of the ice sheet ‘Edge-Plate’ Portion of the structure ‘Body-Block’ edge
Crushing-Plate Stack of ‘Hard-Zone-Spalls’ (HZS’s)
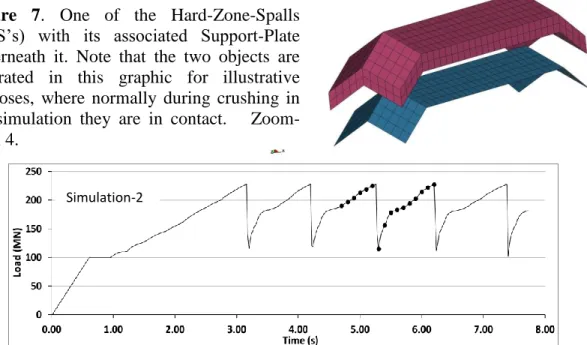
10 Figure 7. One of the Hard-Zone-Spalls
(HZS’s) with its associated Support-Plate underneath it. Note that the two objects are separated in this graphic for illustrative purposes, where normally during crushing in the simulation they are in contact. Zoom-level 4.
Figure 8. Load time series plot for Simulation-2. On the plot there are dark-circle markers that
span portions of two of the load sawteeth. The markers correspond with simulation images shown in Figure 11 below.
Simulation-2
Figure 9. Structure displacement time series plot for Simulation-2.
Ice Sheet Edge-Plate
Figure 10. Displacement time series of the ice sheet Edge-Plate and the structure
Body-Block for Simulation-2. Note that the structure and ice sheet edge surge towards each other at the spallation-induced load drops.
11
Fig. 4. Full model components. The 6 km x 6 km x 2.5 m ice sheet is the main object visible at this scale. The other components are barely visible at the left edge of the ice sheet. Zoom-level 1.
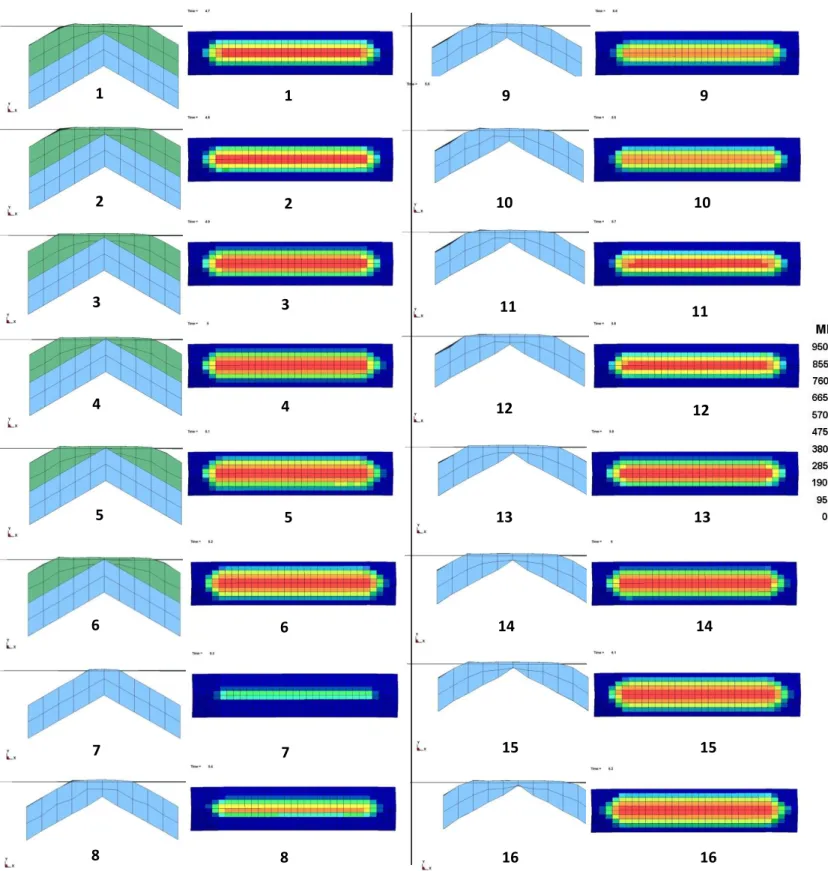
Figure 11. Sequence of 16 numbered pairs of images, from top left to bottom right. A pair consists of a
sectional-view image of HZS’s flattening against the Crushing-Plate and a corresponding image of the interfacial contact pressure pattern. The pairs correspond to the 16 dark-circle markers indicated on the load time series for Simulation-2 (Figure 8). The color-coded pressure scale for the pressure pattern images is at the right. Note that continuous horizontal contact area/pressure patterns have been observed in experimental studies involving structures interacting with ice sheets (e.g. Määttänen et al., 2011). The maximal vertical width of the contact patches is ~ 0.2 m.
1 8 7 6 5 4 3 2 9 16 15 14 13 12 11 10 1 8 7 6 5 4 3 2 9 16 15 14 13 12 11 10