APPLICATION OF THE COPY EXACT METHODOLOGY TO SYSTEMS
IMPLEMENTATION
byCharles F. Gray
B.S. Manufacturing Engineering, Northwestern University, 1997Submitted to the Sloan School of Management in Partial Fulfillment of the Requirements for the Degrees of
Master of Business Administration
Master of Science, Electrical Engineering and Computer Science
BARKER
at the MASSACHUSETTS INSTITUTE
OF TECHNOLOGY
Massachusetts Institute of Technology
May 2001
JUL 0 9 2001
02001 Massachusetts Institute of Technology. All rights reserved.
LIBRARIES
Signature of Author
MIT Sloan School of Management Departmen lectrical Engineering and Computer Science May 10, 2001
Certified by
Charles Fine Cysler Leaders For Manufacturing Professor Thesis Supervisor
Certified by
David K. Gifford Professor of Electrical Engineering and Computer Science Thesis Supervisor
Accepted by
Margaret Andrews, Director Sloan Sc opl of Management
Accepted by
Arthur C. Smith
Chairman, Committee on Graduate Students Department of Electrical Engineering and Computer Science
APPLICATION OF THE COPY EXACT METHODOLOGY TO SYSTEMS
IMPLEMENTATION
byCharles F. Gray
B.S. Manufacturing Engineering, Northwestern University, 1997Submitted to the Sloan School of Management on May 10, 2001 in Partial Fulfillment of the Requirements for the Degrees of
Master of Business Administration
Master of Science, Electrical Engineering and Computer Science
ABSTRACT
Manufacturing companies that successfully grow their markets and operations face the challenge coordinating operations to capture the value created by economies of scale. However, sharing best practices across organizations requires diligent coordination between the multiple business units. This research describes and examines a method for coordination and knowledge transfer commonly referred to as Copy Exact. This method, often associated with technology transfer in semiconductor fabrication facilities, can be readily applied to implementation of large-scale information systems.
By sharing the collective knowledge and resources of multiple independent groups
within a larger organization, the Copy Exact approach can lower total development and implementation costs, accelerate the time required for full solution deployment, and improve likelihood of smooth, trouble-free implementations. However, the close coordination required to execute the Copy Exact approach gives rise to significant coordination costs, and requires careful attention to methods of communication and knowledge sharing applied.
Dell Computer Corporation has applied the Copy Exact methodology to implement factory level supply chain integration package across its 12 worldwide manufacturing facilities. The decision to apply Copy Exact during implementation of the DSi2 system at Dell yielded significant benefits for the cost, speed, stability, and sustainability of the project. However, Copy Exact also created challenges of factory specific software customization and of trans-global project support. The nature and significance of these benefits and challenges are detailed and, where possible, quantified in this thesis. Further, tactics useful for maximizing the Copy Exact benefits and managing the challenges are presented.
The findings of this research indicate that Copy Exact can be successfully applied to information systems implementations. Dell stands to benefit from further application of Copy Exact to multi-factory projects, and similar manufacturing organizations can learn from Dell's example.
Thesis Supervisors:
Charles Fine, Chrysler Leaders For Manufacturing Professor
ACKNOWLEDGEMENTS
The author gratefully acknowledges the support and resources made available by the Leaders for Manufacturing program, a partnership between MIT and
manufacturing companies. This report would not have been possible without the support and learning provided by the LFM program and my classmates.
I would also like to extend sincere gratitude to Dell Computer Corporation for sponsoring this work and supporting the LFM program. I would especially like to thank Stephen Cook and for all of his help in developing and managing the project. Although I cannot mention all of those who gave their time and valuable input, I would also like to extend a special thanks to Thom Clark, John Egan, Matthew Smith, and Tom Wala for the advice, information, and support they provided. This thesis would not have been possible without their valuable assistance.
Finally, I would like to thank my family and friends for the months of
encouragement and support they provided during my research and writing process. To Natalie, thanks for being there - I couldn't have wished for anything more. Most
importantly, to my Mom, Dad, and sister Libby, I am forever appreciative of the encouragement, guidance, and support you have provided throughout my academic
TABLE OF CONTENTS
A BSTRACT ... 2
A CKN O W LEDGEM EN TS... 3
TA BLE O F CO N TEN TS... 4
TABLE O F FIGU RES ... 7
TA BLE O F TA BLES ... 8
1 IN TRO DU CTION AN D OVERVIEW ... 9
1.1 IN TRO DUCTIO N ... 9
1.2 TH ESIS OVERVIEW ... 10
2 BACKGROUND OF DELL'S DECENTRALIZED ORGANIZATION...11
2.1 CO M PAN Y BACKGRO UN D ... 11
2.1.1 Dell Direct Model...11
2.1.2 Build-to-Order M odel ... 12
2.2 COMPANY GROWTH & FACTORY START-UPS ... 12
2.3 O RGA N IZATIO N AL STRUCTURE ... 13
3 DSi2 DEMAND FULFILLMENT SOFTWARE: A COPY EXACT APPROACH ... 1 5 3.1 CO PY EXACT H ISTO RY... 15
3.2 CO PY EXACT AT DELL... 15
3.2.1 Internal Manufacturing Flow... 16
3.2.2 Inbound Materials Flow... 18
3.3 PU LL TO ORDER M ETHO DO LOGY ... 19
3.3.1 M in-M ax ... 19
3.3.2 P ull to O rder ... 19
3.4 DSi2 PROJECT ... 21
3.4.1 DSi2 System Implementation Goal... 21
3.4.2 Implementation Scale... 21
4.1
IMPORTANCE OF CROSS-ORGANIZATIONAL SHARING ...
23
4.2
EXECUTION OF CROSS-ORGANIZATIONAL SHARING...24
4.2.1 Remote Knowledge Transfer Methodologies...24
4.2.2 Face-to-Face Communications ... 26
4 .2 .3 C o o kb o ok ... 2 9 4.2.4 Knowledge Transfer Conclusions ... 32
5 COSTS AND BENEFITS OF THE COPY EXACT APPROACH ...
33
5.1
OVERVIEW OF COPY EXACT BENEFITS...33
5.1.1 Reduced Cost of Implementation... 33
5.1.2 Greater Speed of Implementation... 34
5.1.3 Increased Stability of Implementation...34
5.1.4 Ease of Support and Enhancement... 34
5.2
COPY EXACT AT DELL...35
5.2.1 Reduced Cost of Implementation...35
5.2.2 Increased Speed of Implementation ... 38
5.2.3 Greater Stability ofImplementation... 39
5.2.4 Ease of Support and Enhancement... 41
5.2.5 Organizational Knowledge Sharing... 43
5.2.6 Summary of Copy Exact Benefits Measured...44
5.2.7 C osts of C opy Exact ... 45
6 STRATEGIC QUESTIONS FOR COPY EXACT ...
47
6.1
SYSTEMS DYNAMICS OF COPY EXACT ...
47
6.1.1 Fundamental Differences in Process...48
6.1.2 Sim ilarities of System s... 48
6.1.3 Similarities in Operating Philosophies ... 49
6.1.4 Opportunities for Copy Exact...49
6.1.5 Copy Exact Projects Completed...49
6.1.6 C om m on System s Loop... 49
6.1.7 Common Philosophy Loop ... 50
6.1.8 Savings
from
Economies of Scale... 506.1.9 More Effective Organization... 50
6.1.10 Organizational Emphasis on Copy Exact...51
7 RECOMMENDATIONS AND CONCLUSION ...
52
7.1
RECOMMENDATIONS...52
7.1.2 Recommendations for Copy Exact Project Teams ... 53 7.2 CONCLUSION ... 54
TABLE OF FIGURES
Figure 2-1 Dell Computer Corp. Annual Revenues...13
Figure 2-2 Timeline of New Factory Start-Ups...13
Figure 2-3. Simplified Organizational Chart (as of 3/17/00)...14
Figure 3-1. Diagram of Pull to Order Factory Flow ... 18
Figure 3-2 Pull to Order Production Schedule...20
Figure 3-3 DSi2 Team Staffing Levels ... 22
Figure 4-1 Level of Project Staffing Across Lines of Business ... 24
Figure 4-2 Value of Shared Drive Access... 25
Figure 4-3 Value of Phone & Voice Conference... 26
Figure 4-4 V alue of E-M ail... 26
Figure 4-5 Value of Visits to Sites with DSi2 Active ... 27
Figure 4-6 Value of Visits to Pre-Implementation Sites...28
Figure 4-7 Value of Team to Team Spillover...29
Figure 4-8 Value of Cookbook Documentation ... 30
Figure 4-9 Difficulty of and Importance of Cookbook Documentation, by Topic...31
Figure 5-1 Person-Days Required Per Factory Rollout... 36
Figure 5-2 Speed of Multiple Implementations: Copy Exact vs. Non-Copy Exact A p p ro ach ... 39
Figure 5-3 Implementation Smoothness - IT Trouble Tickets Reported by Rollout ... 41
Figure 5-4 Future Upgradability of Common DSi2 Platform...43
Figure 5-5 Percent of Functionality Met by Phase 1 Solution...46
TABLE OF TABLES
Table 5-1 Theoretical Rollout Effort Required for Non-Copy Exact Implementations.... 37 Table 5-2 Comparison of Projected IT Development and Support Staff...42 Table 5-3 Summary of Copy Exact Benefits ... 44 Table 5-4 Approximate Amount of Travel Required of Austin-based employees for
1
INTRODUCTION AND OVERVIEW
1.1
INTRODUCTION
Leading companies in the high technology industry are in many ways suffering the ill effects of their own phenomenal growth and success. One of the challenges common to successful high growth technology manufacturing organizations is how to maintain the operational consistency between their many factories that allow the companies to take full advantage of their dominant scale positions. One approach to creating coordination between manufacturing sites is known as Copy Exact (alternately, Copy Exactly) - an approach popularized by industry giant Intel Corporation during the 1990's. The Copy Exact approach to development of facilities, systems, and processes requires that multiple sites within the company freely share and co-develop solutions to
achieve common goals.
By sharing the collective knowledge and resources of multiple independent groups within a larger organization, the Copy Exact approach can lower total
development and implementation costs, accelerate the time required for full solution deployment, and improve likelihood of smooth, trouble-free implementations.
However, the close coordination required to execute the Copy Exact approach gives rise to significant coordination costs, and requires careful attention to methods of
communication and knowledge sharing applied.
The objective of this thesis is to examine in detail the benefits and costs of
applying the Copy Exact approach to large-scale projects that span several divisions of a large organization. This thesis specifically examines the methods and results of a
large-scale information systems project within industry leader Dell Computer Corporation of Round Rock, Texas. Dell, which has historically approached similar projects in a decentralized, site-specific manner, has committed to applying the Copy Exact method on this project and stands to gain significant operational advantage if the approach can be successfully replicated.
THESIS OVERVIEW
This thesis will begin with a brief overview of Dell Computer Corporation,
including the origin and the history of the Company. Next, the core business strategy of the Company, including the Direct Sales Model and the Build to Order Manufacturing Model will be summarized. Building on this will be an overview of the Company's basic organizational structure as it pertains to the scope of this thesis. In Chapter 3, a more detailed description of the Company's manufacturing environment will be given and an overview of the information systems project, code-named DSi2, will be
presented. Next, a working definition and broader discussion of the Copy Exact
approach are provided. Chapter 4 begins to explore the tactics used by the DSi2 project team to execute the Copy Exact strategy. Based on observations, interviews, and team survey results, hypotheses of which tactics proved more and less effective tactics are offered. Chapter 5 presents quantifiable findings of the real benefits Dell realized
through application of Copy Exact, including demonstrations of learning curve effects resulting from repeated implementations of a single common solution. Chapter 6 presents and discusses a systems dynamics model proposed by the author for larger organizational effects that result from Copy Exact projects like the DSi2 implementation. Chapter 7 presents several final recommendations for the future application of Copy Exact in large manufacturing companies. Finally, the author suggests areas of potential future study.
2
BACKGROUND OF DELL'S DECENTRALIZED
ORGANIZATION
2.1
COMPANY BACKGROUND
Dell Computer Corporation, the world's largest direct computer systems company, represents one of the most dynamic and well known growth stories of the 1990's. The computer manufacturer began operations in 1984 when an 18 year old undergraduate college student named Michael Dell began customizing IBM clones with extra memory, disk drives, and modems, selling the systems at a deep discount. The model was simple. By listening to the specific needs of each individual customer - and building customized systems to match those needs - Dell could sell exactly what the customer demanded and could keep unsold finished goods to zero.
Since the Company's modest beginnings, Dell has grown to a Fortune 50 company with annual sales of $32 billion. The company targets an entire range of customer segments from personal users to government/large business enterprise users, who make up 60% of yearly sales for the company. The Round Rock, Texas based company is truly global, and services customers in markets worldwide with
manufacturing facilities in Austin, Texas; Nashville, Tenn.; Eldorado do Sul, Brazil; Limerick, Ireland; Penang, Malaysia; and Xiamen, China.
2.1.1 Dell Direct Model
The Company has maintained the core of Michael Dell's fundamental business model with its well-known Dell Direct Model. The company sells its products only through direct-to-the-customer channels such as telephone and the web, Dell ensures that no intermediaries wedge themselves between the manufacturer and its customer base. Dell continues to organize the corporate structure and employee culture around a
strong dedication to the customer and their needs. Sales and Marketing groups within the company are segmented by customer type (e.g. Government, Universities) rather than by product type (e.g. servers, laptops). Other functions within the company by and
large are aligned around these customer segmented sales and marketing groups. The structure allows the company to focus on the needs of its customers rather than the features of its products. This organizational structure will be discussed in greater detail in Section 2.3.
2.1.2 Build-to-Order Model
Hand-in-hand with the direct sales model is Dell's "build-to-order"
manufacturing model. Just as Michael Dell did during the company's first months, Dell builds systems only after customers have selected - and paid for - the computer. The primary advantages of this model are twofold. First, because the company gets paid from its customers before it pays for (and in many cases, procures) the components, it maintains a negative cash cycle. This is especially important in the computer industry because of the tremendous holding cost of inventory that devalues by the day. Second, the Company can ensure ultimate configurability and choice to the customer, since no pre-built systems need to be "pushed" through sales channels at the customers.
The build-to-order model, and its companion the direct sales model, is central to the company's overall strategy. Thus, manufacturing operations at Dell are structured to optimize velocity (1 / lead time + cycle time) rather than output. To keep pace with the nearly infinite number of possible configurations, Dell factories are designed for ultra-small production batches and high product customization.
2.2
COMPANY GROWTH & FACTORY START-UPS
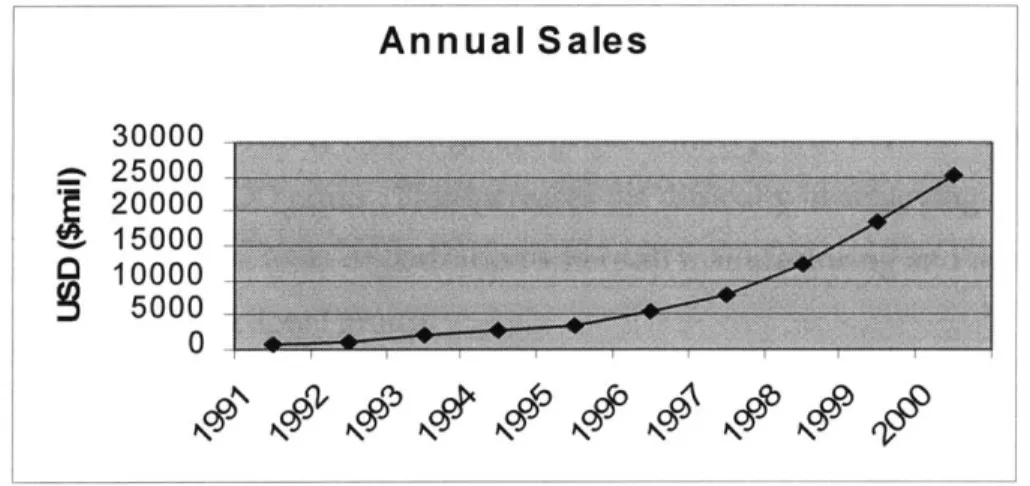
Dell has grown production and sales rates incredibly quickly during the latter half of the 1990's - between 1995 and 2000, dollar sales increased approximately seven-fold, as is shown in Figure 2-1. It should not come as a surprise, then, that the
manufacturing operations within the company have had to scale at a similarly rapid rate. Coupled with Dell's globalization efforts and commitment to create capacity within major worldwide sales regions, the growth has required an accelerating number of factory start-ups in both North America and worldwide regions. Figure 2-2 shows approximate beginning of production dates for Dell manufacturing facilities across the
trends are implied by the author). Further complicating the Company's portfolio of
manufacturing facilities, Dell is continuously improving its manufacturing process in
search of factories that can deliver higher flexibility and velocity at lower costs. Thus,
there is at times only a mild resemblance between factories erected only a few years
apart.
Figure 2-1 Dell Computer Corp. Annual Revenues
A E E A P M M P C A E P M P C T F N C M G N F C C 1 2 1 C 1 1 2 3 C 2 2
V
V
V
VVVVVV
Figure 2-2 Timeline of New Factory Start-Ups
2.3
ORGANIZATIONAL STRUCTURE
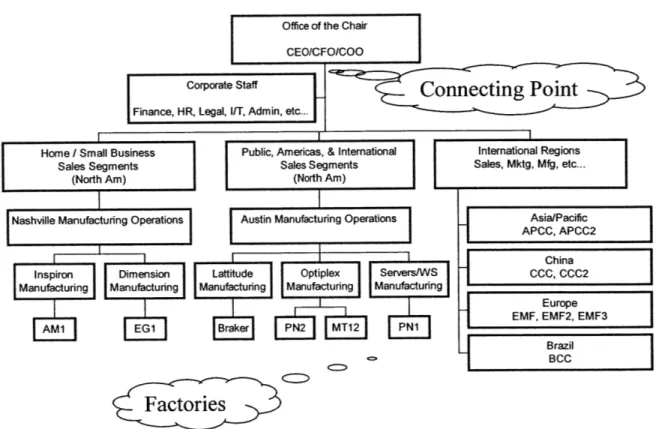
A partial organizational chart, Figure 2-3, has been included to illustrate the basic
organizational alignment of Dell Computer Corporation. While many details (and
groups) have been omitted in the interest of readability, the chart shows that Dell's
North American factories are aligned to product groups, which belong to sales segments
(i.e. Home & Small Business), which in turn report to top executive management. This
organization makes sense at Dell for two reasons: (1) it underscores Dell's core focus on
Annual Sales
30000 e 25000 20000150000-Wr
5000 N kq0 '<DCfNO 5c,6
customers by placing customer segments in the top level, (2) it keeps ground-level business units (e.g. Dimension Manufacturing) as nimble and responsive as possible. Though sales segments can (and constantly do) sell products that are manufactured in all product families (i.e. Home & Small Business can sell Optiplex), many of the product-segment alignments make sense (e.g. Dimension and HSB).
The organizational structure also creates some challenges that are relevant to the scope of this thesis. With the exception of Optiplex factories PN2 and MT12, or Regional factories such as APCC and APCC2, organizational contact points between sites occur in the VP or CEO/CFO/COO ranks. This increases the difficulty in achieving coordination between factories relative to an organization where all manufacturing and operations
were joined under a functional group.
Simplified Organizational Chart (3/17/00)
Office of the Chair
CEO/CFO/COO
I
Corporate Staff
Finance, HR, Legal, U/T, Admin, etc...
Connecting Point
Home / Small Business Sales Segments
(North Am)
Nashville Manufacturing Operations
Public, Americas, & International Sales Segments
(North Am)
Austin Manufacturing Operations
Inspiron Dimension Lattitude Optiplex Servers/WS Manufacturing Mn ctring Manufacturing Manufacturing Manufacturing
[M1
EG1 Braker PN2 MT12 PN1 International Regions Sales, Mktg, Mfg, etc... Asia/Pacific APCC, APCC2 China CCC, CCC2 Europe EMF, EMF2, EMF3Brazil BCC
Factories
Figure 2-3. Simplified Organizational Chart (as of 3/17/00)
3
DSi2 DEMAND FULFILLMENT SOFTWARE: A COPY EXACT
APPROACH
3.1
COPY EXACT HISTORY
At the heart of my project and thesis is the philosophy of copy exact, or CE (referred to elsewhere in the industry as "copy exactly"). CE is a mindset that argues for forced commonality across groups in an organization so that the network benefits and economies of scale that exist in large organizations can be maximized. CE can apply to any or all aspects of a company's operations, ranging from chemical processes to information systems to organizational structures. However, Copy Exact is typically applied selectively within a company, standardizing certain aspects of operations while leaving others untouched.
The copy exact philosophy is most closely associated with Intel Corporation, although the concepts of copy exact exist under different names in countless
organizations. Intel first coined the term and applied the copy exact principles in 1990 in an effort to minimize the time required for a technology to be transferred and to ensure high initial product quality and yield. For Intel, the manufacturing challenge that gave rise to CE was the inherent difficulty they faced in bringing new fabrication facilities up to productive levels as quickly as the market demand grew. The result of copy exact has been extremely positive. Simultaneously, yields have been improved while reducing the time required for new fabs to move from tool qualification to profitability from 24
months to only 13. Intel has placed great importance on copy exact and emphasizes the importance of the approach to new employees and suppliers.
3.2
COPY EXACT AT DELL
The critical manufacturing challenges faced by Dell differ greatly from those of Intel, and thus copy exact at Dell will take a very different shape. While quick ramp-up and high product yield are most core to Intel's success, manufacturing agility and supply chain efficiency are most critical to Dell. Thus, the discussion of copy exact as it
relates to Dell will concentrate on its applications on supply chain systems and processes.
3.2.1 Internal Manufacturing Flow
To understand the backdrop on which copy exact was implemented at Dell, it's first necessary to describe the flow of operations in a typical factory, and then to explain methods by which the DSi2 project sought to alter that flow.
A computer system order moves through up to 10 distinct stages during the build process at Dell's factory. Note that since every computer built at Dell has already been selected and purchased by a customer, the only distinction between the terms "order" and "system" is that an "order" can often contain multiple identically
configured systems (e.g. for a business customer buying 5, 10, or 50 desktops at once). Below is a brief summary of the 10 stages:
1) A TB - The first stage a computer build order moves to is Available to Build, or ATB. As the name suggests, an order that is classified as ATB can be built by a designated factory as soon as materials and human resources are
available to do so.
2) OMAC - Many (but not all) factories next run a database query for Order Material Availability Checking, or OMAC. The query checks the electronic inventory records for the factory and determines if a given factory (or given production line) has all the necessary components (e.g. disk drives,
motherboards, wire harnesses, etc.) for assembly of the entire order. If the factory or line does have all the needed parts, the order moves to stage (4) Traveler Pull. If it does not, the order moves to stage (3) OMA C Fail. 3) OMA C Fail - Once an order is logged to OMAC Fail, a periodic report is
generated and sent to the factory's materials planner for corrective action. Planners then place replenishment orders to the supplier warehouses
parts arrive. OMAC is again run and if another part is missing, the system is again logged into OMAC Fail.
4) Traveler Pull - If all parts needed are available, a factory technician prints a hard copy of a traveler for each system included in the order (to a max of 50). Stacks of these travelers, which contain all details necessary for proper
system assembly, are then handed to the kitting line's personnel.
5) Kitting - At the kitting operation, all of the components that belong inside the chassis assembly (along with the chassis itself) are placed into large plastic totes and sent via conveyor to the next area, System Build.
6) System Build - Assembly technicians take all components included in the "kit" and build the system. The build step itself is relatively fast, taking only two to three minutes.
7)
Quick Check & Burn In
- The completed system is then placed in a "bum rack" where the appropriate operating system, drivers, and factory pre-installedsoftware are added. Additionally, basic checks for functionality of ports, video cards, and modems are run. If the system does not function correctly, it is placed into a troubleshooting loop that is beyond the scope of the process described here.
8) Boxing - Configured and functional systems are then sent to the boxing line, where they are placed into their cardboard shipping container. At this time, keyboards, mice, user manuals, and CD-ROM copies of pre-loaded software are added. Boxes are sealed and transferred to the shipping station.
9) SPAM Merge - Orders with multiple systems staged until every system in the order has completed boxing. They then are palletized together and matched with the associated peripherals, including speakers, printers, and monitors (a.k.a. SPAMs).
10) Shipping - Complete orders are finally loaded on outbound freight carriers, where they may be shipped directly to the customer or may be sent to a logistics company (e.g. UPS) for final shipment.
Inbound Materials Flow
As the above description of internal factory logistics illustrates, Dell factories are
highly dependent on the ability of component suppliers to deliver specific parts and
quantities in a very timely manner. To accomplish this without requiring suppliers to
make very inefficient daily shipments to each factory, Dell utilizes "Supplier Logistics
Centers" or SLCs to stock up to two weeks worth of safety stock. Understanding of the
SLC operations are as important to Dell's Information Systems requirements as are the
internal factory operations.
Pull to Order Materials
Concept
Production Schedule SLCs & SLC Suppliers Commits Bui d\\
Schedule Timed Deliveries Kitting Docks Line-Specific shipmentsFigure 3-1. Diagram of Pull to Order Factory Flow
Suppliers (e.g. hard disk manufacturers) are contractually required to maintain a
target stock of materials in these independently managed SLCs typically equal to about
one to two weeks of inventory. The inventory, however, does not officially belong to
Dell until it is moved into the Dell factory, where inventory targets are much lower
(typically measured in hours, not weeks). Deliveries from the SLCs to the factories are
scheduled several times per day, and contain components from multiple suppliers.
Success within the factory requires effective means of scheduling these shipments.
PULL TO ORDER METHODOLOGY
Dell has gained a reputation for excellence in the practice of "build to order", meaning that no computers are built to stock in anticipation of future orders. An extension of this manufacturing practice that will be explored in this thesis is the practice of "pull to order". The current practice in the majority of Dell's operations is a classical "Min-Max" material replenishment procedure while others are pioneering the pull-to-order replenishment method. This disconnect is a major hurdle to copy exact application of production scheduling applications so it is important to outline the two methods and their key differences.
3.3.1 Min-Max
In this method of replenishment, various components required for system assembly (e.g. hard drives) are assigned an efficient economic order quantity based on product-specific parameters including order cost, holding cost (i.e. space required and purchase cost), and standard shipment quantities. Based on this quantity and an assumed replenishment lead-time, a theoretical reorder point is calculated. Each time inventory falls below this reorder point, materials planners place an order for
replenishment from the SLC. The key advantage of this method is simplicity and ability to visually spot problems in the component inventory stocks (#'s of boxes in storage). The major shortcoming of this method is the high level of manual material inspection it
requires. Historically, one or more full-time stock checkers have been required to constantly monitor inventory levels to trigger reorder points.
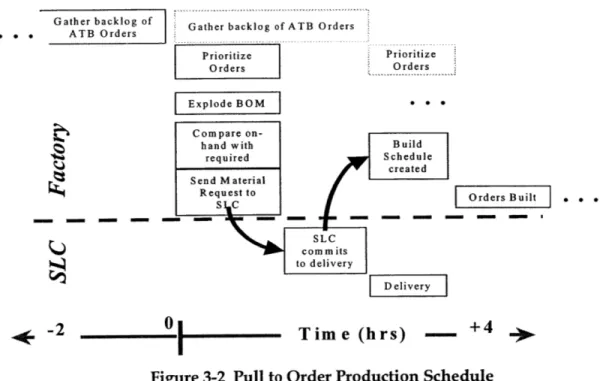
3.3.2 Pull to Order
By contrast, pull to order explicitly excludes this reorder point approach. Rather than the reactive method outlined above, raw material needs and orders are created in a predictive fashion. As shown in Figure 3-2, the pull to order methodology brings materials in based on orders in the backlog and their associated bills of material. The
(intended) result of this approach is that, by "reacting" several hours before the order enters the OMAC check, that OMAC failures will be avoided. At the same time, materials planners can be more aggressive about lowering the minimum on-hand
quantity of materials since material can be coordinated and pulled in if a need does arise. Factories did, in fact, experience a several fold reduction in on-hand inventory when converting to pull to order.
... Gather backleog ofGathe backog
~
Gather backlog of ATB Orders... ATB Orders
Prioritize Prioritize
Orders Orders
Explode B=OM e
Compare
on-hand with Build
required Schedule
created
Send M aterial
RFequest to Pr u.n.e. Orders BOd
SIS SLC commits to d e liv ery D l v r -2 0 T im e (h rs) -- +
Figure 3-2 Pull to Order Production Schedule
Pull to order is significant to this thesis because the information systems project studied in the analysis requires factories to adopt a pull to order methodology. This raised the stakes in the implementation decision.
DSi2 PROJECT
3.4.1 DSi2 System Implementation Goal
DSi2, or Demand-Supply (matching with) i2, intends to achieve two key outcomes:
1. Enable factories to operate in a pull to order material management approach ("Demand Fulfillment" or DF), and
2. Link procurement activities of all five worldwide regions to allow globally optimized material allocation and price negotiation ("Global Planning/ Procurement Collaboration" or GPPC) .
The two objectives are fundamentally different from one another. Pull to order is
by definition a factory level activity that is executed on an hourly time scale. By
contrast, procurement is an activity that takes place on a weekly, bi-weekly, or monthly time scale. Given the inherent divisibility of the two sub-projects, the early project organizers chose to divide the implementation team into two essentially separate sub-teams. For this thesis the author studied only the Demand Fulfillment component of the project. In the remainder of the thesis, references to DSi2 or "the project" are intended to
encompass this piece of the i2-based solution, although there is every reason to believe that a broader scope would have produced similar conclusions.
3.4.2 Implementation Scale
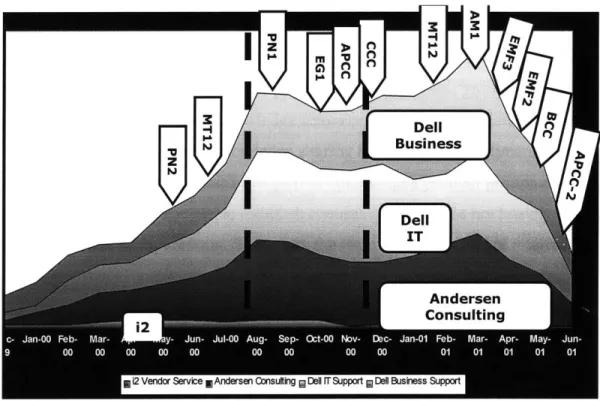
The copy exact information systems project observed was interesting in part because of its sheer size and complexity. When fully rolled out, the phase one
implementation of DSi2 will have spanned more than 18 months and will have required a total of 24,000 person-days of effort from implementation team personnel. Figure 3-3 below shows a timeline of system go-lives at various factories superimposed onto a
chart representing effort (in person-days) required by the project. This data and its
3.4
underlying assumptions will be more thoroughly discussed in Chapter 6, so the only
conclusion needing to be drawn at this point is that the project is of significant scale and
complexity to warrant careful consideration of project implementation methodology.
Also of note from Figure 3-3 are the plurality of groups that make up the team. At this
general level of abstraction, the team can be broken into four components: product
experts from the software vendor, systems designers and integrators from an external
consulting group, IT developers (company internal) and business process experts
(company internal).
I
zDell Business
KNOWLEDGE TRANSFER METHODOLOGY FOR DSi2
In this chapter, I will describe in detail the multiple approaches taken to the problem of knowledge transfer, including written documentation, face-to-face collaboration, remote (phone, e-mail, shared file...) collaboration, and team-to-team personnel spillover. Based on results of interviews, surveys, and observations, I will provide specific learnings about the "how" of knowledge transfer in this type of project.
4.1
IMPORTANCE OF CROSS-ORGANIZATIONAL SHARING
As noted in the previous chapter, some of the biggest benefits - and burdens - of Copy Exact are derived from the need for participants from diverse groups within the company to coordinate and share knowledge across organizational borders. During the DSi2 implementation at Dell, this knowledge sharing happened in two dimensions. First, members of different business units (across autonomous product groups and worldwide regions) were required to establish communication paths not heavily utilized
during normal business operations. Second, as the team was composed of internal employees, external IT implementation consultants, and software vendor experts, critical information paths needed to be created even within each individual site team.
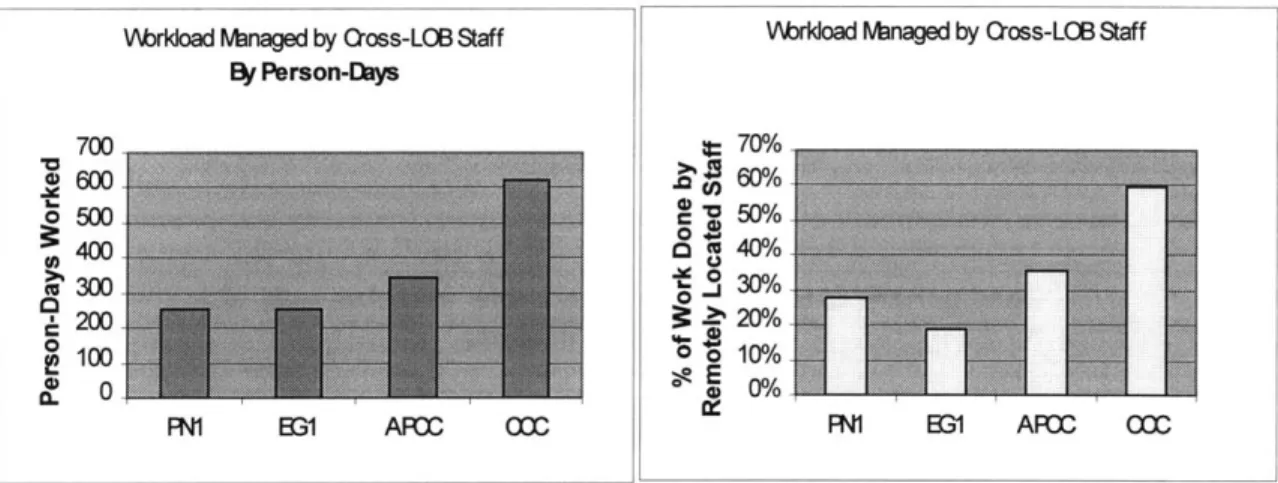
Figure 4-1 below shows the magnitude of this first type of cross-group sharing. The graphs demonstrate the workload for the second, third, fourth, and fifth
implementations that was handled by resources not belonging to the factory or region in question. Similar data for remaining installations was not available to the same level of detail since roster positions had not been formally allocated at the time of this study. As Figure 4-1 highlights, the implementations relied on cross-organizational team members for between 20 and 60% of workload. This figure accounts for the percentage of
dedicated team members (excludes all designated "shared resources", e.g. executive management and IT personnel tasked with supporting multiple rollouts - including these team members, cross-staffing would appear even more significant).
VVbrkoad Wnaged by Cross-LOB Staff Vorkload Wbnaged by Oross-LOB Staff Dy Person-Days 700 : 70% 600 6 20% 100 50% 0 a% 400 o 40%/ 0 200 20% 100 0 0100/ 0 12 00/ FM B31 AFPC CDC WN1 EG1 AF C OC
Figure 4-1 Level of Project Staffing Across Lines of Business
4.2
EXECUTION OF CROSS-ORGANIZATIONAL SHARING
The large amount of cross-organizational knowledge sharing was accomplished
through a variety of tactics that can be broadly categorized into those primarily executed
remotely and those based on face-to-face contact. Each of these categories, along with
their relative effectiveness will be discussed in more detail.
4.2.1
Remote Knowledge Transfer Methodologies
4.2.1.1
Shared Drive Access
One means by which teams were able to share data, implementation
methodologies, and best practices across organizational groups was via the company's
global intranet "shared drive". This platform was frequently used to archive master
implementation schedules (i.e. Gantt charts), FAQ lists, data "flat" files, and other large
general interest documents. The shared drive, while considered useful for specific types
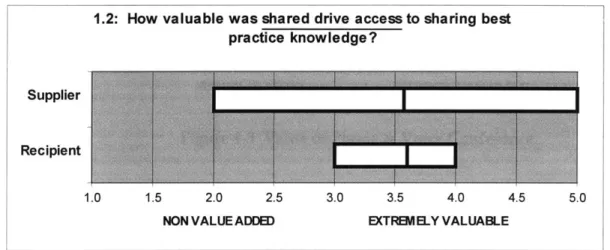
of data, was not overwhelmingly popular among team members. Figure 4-2 represents
the results of a team opinion survey where the question "How valuable was the shared
drive access to sharing best practice knowledge?" was asked of nine "suppliers" of
shared information (i.e. those who participated in a second, third, or fourth
implementation team sharing knowledge they had gained during previous roll-outs) and
six "recipients" of this information (i.e. those who had not previously taken part in a
roll-out and relied on information gained from those involved in earlier roll-outs). The
-_____________ -~
-two horizontal bars represent the ranges of responses, and the mean response for each
group is represented by the tick mark inside the bar. These responses (supported by
interview discussion) indicate that use of a central shared drive is useful but not
Recipient "
1.0 1.5 2.0 2.5 NON VALUE ADDED
sufficient for knowledge transfer.
Figure 4-2 Value of Shared Drive Access
4.2.1.2
Phone and Voice Conference
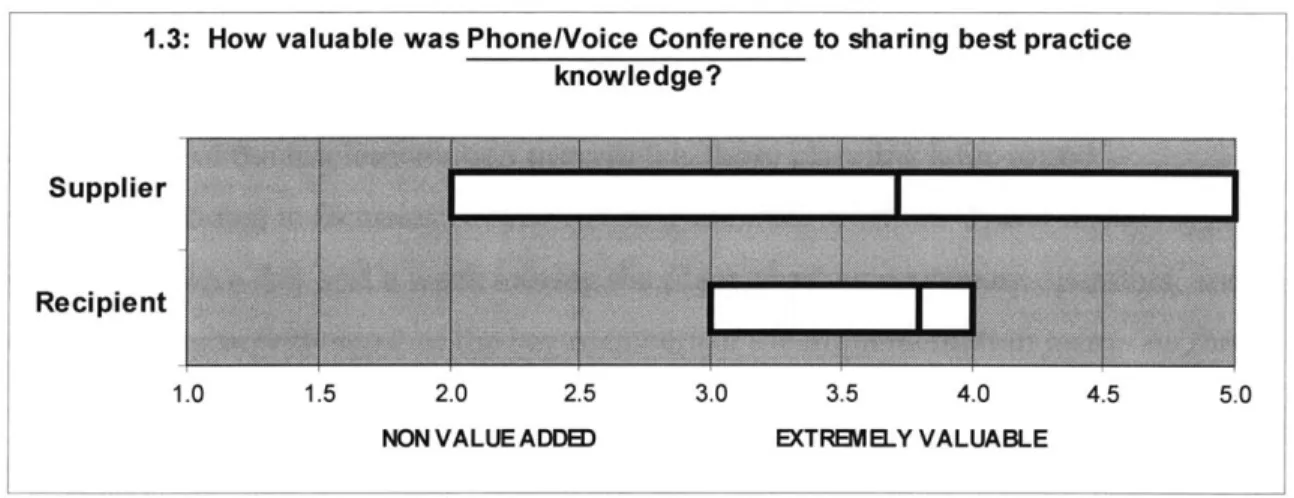
A second means of remote knowledge sharing used was phone/voice
conference. Especially useful for discussion of more complex issues between team
members separated geographically (often by thousands of miles), phone interaction was
also recognized as an important channel for sharing information across organizations.
While the team survey responses were slightly more positive than for shared drive,
phone was also acknowledged to have limitations.
1.2: How valuable was shared drive access to sharing best practice knowledge?
Supplier
3.0 3.5 4.0 4.5 5.0 EXTREMELY VALUABLE
1.3: How valuable was Phone/Voice Conference to sharing best practice knowledge?
Supplier
Recipient
1.0 1.5 2.0 2.5
NON VALUE ADDED
3.0 3.5 4.0 4.5 5.0
EXTREMELY VALUABLE
Figure 4-3 Value of Phone & Voice Conference
4.2.1.3
The final means of remote communication identified was mail. Surprisingly,
e-mail was viewed by the 15 respondents as the most valuable remote communication
method. There did exist a large spread in opinions, but by and large respondents and
interviewees cited the ability to target information broadly (all-user messages) or
1.1: How valuable was e-mail to sharing best practice knowledge?
1.0 1.5 2.0 2.5 3.0 3.5 4.0 4.5 5.0
NON VALUEADDED EXTREMELY VALUABLE
narrowly as the leading benefit of the medium
Figure 4-4 Value of E-Mail
4.2.2 Face-to-Face Communications
A key finding of the survey questions on methods of knowledge transfer was the
universally agreed upon dominance of "real" (i.e. person to person) interaction for
effective knowledge transfer.
Supplier
4.2.2.1 Visits to DSi2-Live Factories
The first of three face-to-face channels considered was the practice of bringing "recipients" of the implementation process (i.e. those planning later-round
implementations) to factories already running the DSi2 solution. These visitors typically spent between a day and a week touring the plant, shadowing system operators, and making contacts with some of the key members of the implementation team. As the responses shown in Figure 4-5 show, there was an extremely wide dispersion of opinions about the value of these activities. Surprisingly, the "recipients" (i.e. those receiving the tours, etc) were less enthusiastic about the value of the travel than those providing the tours, etc.
1.4: How valuable were tours of current DF users' facilities to sharing best practice knowledge?
Supplier
Recipient
1.0 1.5 2.0 2.5 3.0 3.5 4.0 4.5 5.0
NON VALUE ADDED EXTREMELY VALUABLE
Figure 4-5 Value of Visits to Sites with DSi2 Active
4.2.2.2 Visits to Pre-Implementation Sites
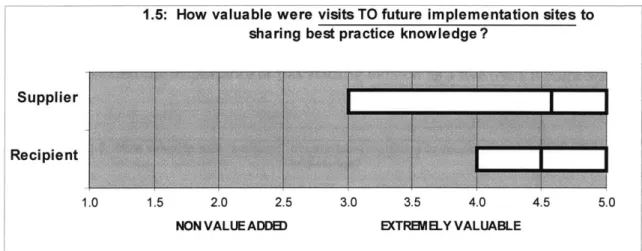
The second, and more positively viewed, method of face-to-face sharing used was factory visits to pre-implementation sites by employees who had already
successfully installed the DSi2 solution in their own factory. During these trips, the visitors helped the factory think through their needs requirements, discussed with the future implementation core team how the Solution might interface with that particular factory's current systems, and helped generate pre-requisite requirements the factory needed to accomplish prior to attempting the installation. Implicit in many of these
activities was "selling" of the DSi2 package to those who needed to fully buy-in to make the process a success. The perception of this channel of communication, as shown in Figure 4-6, was more universally positive than the visits in the reverse direction. The
visits were especially desired by the factories receiving the extra sets of eyes, who
1.5: How valuable were visits TO future implementation sites to sharing best practice knowledge?
Supplier
Recipient
1.0 1.5 2.0 2.5 3.0 3.5 4.0 4.5 5.0
NON VALUE ADDED EXTREMELY VALUABLE
apparently viewed the visits as almost wholly positive experiences.
Figure 4-6 Value of Visits to Pre-Implementation Sites
4.2.2.3 Team to Team Spillover
The final, and most positively viewed, channel of communications was
"spillover" of core team members from one implementation to the next. Spillover refers
to the practice of assigning one or more core members (i.e. full-time) of a completed
implementation to act as a core member of a subsequent rollout team. This type of
face-to-face, day-to-day contact provided the richest opportunities for true shared learnings,
since it allowed formation of a "we" relationship rather than an "us/them" one that
short plant visits in each direction might develop. In each of the early round
implementations, at least two core members of the implementation (not including
shared support such as IT staff) had already lived through one or more successful
implementations. The DSi2 owners institutionalized this through a waterfall staffing
process, where each team that rolled out the system was expected to take the lead in
managing knowledge sharing to one of the next sites. In this way, every new
implementation could benefit from the full-time support of one or more experienced
DSi2 implementers without placing too large a burden on the staff of any one LOB or
region. This spillover also occurred naturally through the inclusion of the systems
integration consultants. The consultants, who had been contracted for all 12 factory
implementations, typically filled many of the slots for upcoming installation teams with
consultants rolling off a successful implementation.
The spillover process was viewed extremely positively by all polled participants
and represented one of the few cases of total consensus in the survey. 14 of the 15
respondents rated the importance of this staffing method as a five (on a 5 point scale),
1.6: How valuable was "spillover" of core team members to sharing best practice knowledge?
Supplier
Recipient
1.0 1.5 2.0 2.5 3.0 3.5 4.0 4.5 5.0
NON VALUE ADDED EXTREMELY VALUABLE
while the fifteenth respondent rated it as a four.
Figure 4-7 Value of Team to Team Spillover
4.2.3
Cookbook
One formalized method of remote knowledge transfer observed during the DSi2
implementation deserves a closer analysis. During initial development and
implementation planning, the DSi2 Team leadership communicated an intention to use
lessons learned in the first roll-out to create a "cookbook," or comprehensive collection
of "recipes" on implementation technique required for successful DSi2 rollout. The
cookbook document was compiled from inputs of subject-matter experts in all areas of
the project, and then was distributed both by hard-copy and e-mailed/ shared drive
soft-copy. Initial response to the cookbook indicated that it was not being used nearly as
much as expected. Figure 4-8 shows the responses to the question "How useful was the
cookbook in setting up Go-Live?" which averaged slightly less than 3.0 of 5. However,
several team members added written comments to their response, indicating a widely
held belief that the cookbook would become much more useful as members of the
original development and implementation teams rolled off the DSi2 project, taking key knowledge with them.
1.8: How useful was the "cookbook" in setting up Go-Live?
Supplier
Recipient
1.0 2.0 3.0 4.0 5.0
NON VALUE ADDED EXTREMELY VALUABLE
Figure 4-8 Value of Cookbook Documentation
"... There is a need to have [the cookbook] available for when the original
designers and go-live swat teams have all gone to greener pastures." - DSi2 Team Member
"[The cookbook] was used more in APCC and CCC roll-outs and now that it has been tried and tested it will be even more valuable in future sites... For future sites this document will slide up to about a 4 level if not 5 in usefulness."
-Another DSi2 Team Member
While the value of comprehensive written documentation is likely to increase with time, it is not clear that all topics covered within the cookbook are equally likely to be most valuable. Certain topics (e.g. user training materials and or project plan Gantt charts) are relatively less difficult to transfer through a written, standalone medium like the cookbook than are others (e.g. how to know when the factory is ready to go-live). At the same time, some topics are less important to replicate from site to site (e.g. standing meeting structures) than others, where great gains can be made from applying best practices documented in past implementations (e.g. Hub readiness performance criteria).
Difficulty Low Importance Scope Management (70/30 Agreement IT Transfer Material Process CheclistHub Readiness Communication CP Process D Gap Analysis Meeting StructureHand-off m install to sustaining Timelines and Milestones
f(Gantt Charts) Chle nktione
Low
Figure 4-9 Difficulty of and Importance of Cookbook Documentation, by Topic
Figure 4-9 attempts to place each of the 13 chapters of the cookbook (initial version) on a matrix of these two criteria, difficulty and importance. (Note: placements were made based upon inputs from authors of the cookbook as well as senior members of the implementation team. It in no way reflects the relative quality of contents in each chapter, only the likelihood future implementation teams would look to a written
document for guidance on a given topic.) Items that were perceived as being difficult to document and of lower importance to copy exactly (upper left quadrant) can be viewed as ones of lowest priority for cookbook documentation. However, those where it was deemed very important to implement in the proven way (copy exact) and with lesser difficulty to document (lower right quadrant) can be considered the "low hanging fruit" of the cookbook orchard. Finally, topics viewed as difficult to communicate in written documentation but highly important to replicate (i.e. upper right quadrant) may be included with understanding that greater supplemental support (phone conferences,
face-to-face visits) will be needed to ensure the full value of documented information is gained.
Knowledge Transfer Conclusions
To summarize the key takeaways from the "how" of knowledge transfer at Dell's DSi2 project:
" Cross-organizational knowledge sharing is at the core of successful Copy Exact execution, and careful consideration must be paid to effective channels and tactics.
" Written documentation and remote communications are necessary but not sufficient for meaningful knowledge transfer.
" Most effective information sharing happens within a group that considers itself a team.
5
COSTS AND BENEFITS OF THE COPY EXACT APPROACH
In this chapter, I will identify and, where possible, quantify the costs and benefits of the Copy Exact approach as demonstrated during the DSi2 project. Included in this analysis will be learning curve demonstration for "effort to implement" (person-hours) and "smoothness" (number of exception events) of project go-live.
Additional factors considered will be maintainability and upgradability, along with costs such as burden of coordination effort and lack of customization by site. A large part of these considerations will be examined (and where possible quantified) via benchmarking at Intel, where Copy Exact(ly) has been rigidly adhered to for several
years.
Application of the copy exact project management approach has clear benefits as well as costs. Below several generalized (non-Dell specific) benefits and costs will be presented followed by in depth quantification on several in the context of Dell's DSi2 implementation.
5.1
OVERVIEW OF COPY EXACT BENEFITS
5.1.1
Reduced Cost of Implementation
In cases where a sizeable fraction of implementation costs are upfront and relatively fixed, major savings can be realized by sharing this fixed cost over multiple implementations. In the case of Intel, hundreds of thousands of hours have been
invested in fine-tuning a manufacturing process. If identical processes can be applied in multiple factories, the effective cost (on a per factory or per unit produced basis) will be much improved. Similarly, if Burger King spends a great deal of effort developing an
optimal recipe for cooking French fries, it is likely to want to implement the exact recipe across its thousands of restaurants worldwide.
Greater Speed of Implementation
Almost every organization is somewhat constrained by human resources and human bandwidth. In many, if not most, cases organizations are not capable of staffing many separate development efforts in parallel. Thus, if results of development efforts are not shared between parts of the organization, a development staff would be required to execute projects one by one. The benefits of development would then be delayed to all but the first "customer." This is especially significant in rapidly evolving industries such as microprocessor manufacturing. In the case of Dell, limited IT staffing resources make it impossible to respond to all requests from the multiple factories in a timely manner.
5.1.3 Increased Stability of Implementation
In the case of projects that involve new technology development a major concern can be stability of the new technology once implemented. In the case of enterprise software development, there will likely be "bugs" that will not be understood until the system is implemented in a live environment. The opportunity to fix these bugs during initial implementations and to avoid them during subsequent ones is a key benefit for a copy exact approach for mission critical software solutions.
5.1.4 Ease of Support and Enhancement
Frequently at issue for implementation is an entire string of possible future enhancements. In the case that the first version implemented is a success, companies have a call option of sorts to sink additional investments in for further development. Developing a phase one project in a copy exact approach allows organizations to pursue these enhancements also in a copy exact methodology. Thus the benefit of using copy exact can be calculated as the savings resulting from application to phase one
development plus the value of the option to pursue phases 2,3,4... copy exact.
A further benefit that applies particularly to enterprise software development is the ease of support for the implemented (phase one) system. There exists typically a fixed cost for training IT personnel to support a given system. To the extent that the 5.1.2
same fixed training cost can be shared over multiple instances of the same application, the ongoing costs to IT support groups can be radically lower.
5.2
COPY EXACT AT DELL
The DSi2 project provides an opportunity to better understand how actual copy exact benefits compare to the theoretical ones. Several sources of data were collected and many interviews conducted in an attempt to quantify the actual benefits that can be attributed to application of the copy exact methodology.
5.2.1 Reduced Cost of Implementation
During the implementation of DSi2, it was expected that the sequential rollouts would create a constantly decreasing requirement in marginal effort for each factory. To test this hypothesis, total person-days (including internal employees and external
consulting resources) is assumed to be a fair measure of "effort" required. Relatively precise and accurate person-day measurements were gathered for each of the first four factory implementations, using time sheets, archived staffing documents, and interviews with team managers. The final eight factory implementations, which had not been completed by the end of the on-site project, were estimated through precise (and hopefully accurate) staffing plans provided by team leaders.
Since typically, two or more separate factory implementation efforts were in process at a given time, a significant portion of the team's resources were splitting time over multiple efforts. In each case, efforts were made to allocate each person's efforts as specifically as possible. If, for instance, a system architect was working on both the Malaysian and Chinese factory rollouts (APCC and CCC, respectively) their time was allocated 50% / 50% over the two teams. There were times, however, when shared resources could not be reasonably attributed to one, two, or three specific factories. In
these cases, the person-days were allocated over all implementations in the given phase. As the clustering of bars in Figure 5-1 indicates, the first two factories (PN2 and MT12) were executed closely to one another, collectively named "Phase 0". The next four implementations (PN1, EG1, APCC, and CCC) made up "Phase 1"', and the final six factories were planned for "Phase 2" execution. This assumption clearly reduced some
of the precision of the learning curve analysis, but hopefully not the accuracy. For
phases 0, 1, and 2 respectively, 63%, 64%, and 84% of person-days were attributable to
individual factories and did not need to be shared. Nonetheless, it is possible that the
relative magnitude of effort required within a phase may be inaccurate (i.e. it is possible
that more of the shared support was spent on PN1 and EG1 than on APCC and CCC).
Effort Rquired By Install
4500 4000 3500 3000 2500 2000... . 1500 1000 500 0 (D
sg
0 4) ('.10 . flc, W(Do Eg
D C'J3V( (Dl
.e C, (D CO( C1 0 Z 00 )0 L LL V .. 0- i C 0I 0 SCL :: J ::J _ & LL ._ aL. LL . 2 .Figure 5-1 Person-Days Required Per Factory Rollout
Figure 5-1 presents the findings of this learning curve assessment. The dashed line represents the effort required (approximately 4000 person-days) to implement one site. As was expected, every subsequent rollout required significantly fewer person-days to execute, and the arrows represent the gap between the actual effort required to implement and the likely effort required to do so if other factories had not already blazed the trail. This gap can be seen as the "value" (in person-day terms) of copy exact. It can alternatively be viewed as the theoretical cost (in person-day terms) of allowing each factory to reinvent the wheel.
In aggregate, the actual implementation for 12 factories is expected to require -24,000 person-days. If no coordination existed between factories (i.e. the opposite of copy exact), this number would be -48,000 days - approximately 100 person-years of additional labor! However, it is unlikely that, even in a highly decentralized
company, every site would develop a completely unique solution. A more reasonable
assumption would be that
-
in absence of an explicit copy exact philosophy
-
each
organizational group (as defined on the company's organizational chart) would seek to
implement its own unique solution. At Dell, eight such organizational units exist
-
four
of which are product-focused organizations in North America (Optiplex, Dimension,
Portables, and Servers/Workstations) and four of which are geographically focused
worldwide facilities (Asia Pacific, China, Ireland, and Brazil). As detailed in Table 5-1,
this approach would be expected to require -36,000 person-days, or a net increase of 50
person-years. This conclusion assumes that each multi-factory group was able to
complete both rollouts with 5000 person-days (as Optiplex did with 4000 for PN2 and
1000 for MT12), and each single factory group performs just as PN2 did in the initial
DSi2 rollout (4000 person-days).
Table 5-1 Theoretical Rollout Effort Required for Non-Copy Exact
Implementations
Optiplex
PN2, MT12
5000
Dimension
EGI, AMI
5000
Portables
MT12 (New Line)
4000
Servers/Workstations
PN1
4000
Asia Pacific
APCC, APCC2
5000
China
CCC
4000
Europe (Ireland)
EMF2, EMF3
5000
Brazil
BCC
4000
TOTAL
36,000
Readers may note that the effort required for implementation experienced a
dramatic drop-off following the first iteration, but remained relatively flat for the next
11. This seems to reject the hypothesis that a continuous learning curve was present
during the DSi2 project, however there exist several possible explanations for this trend
that do not reject learning curve effects. First, the order of factory implementations was determined in large part by system readiness and level of buy-in from factory
management. This tended to front-load the process with factories that had a strong foundation of IT and business processes that greatly simplified the implementation process. Second, since the implementation process was planned in three waves (i.e. phases), it would be unreasonable to expect major project to project improvement for implementations essentially executed in parallel. Finally, implementation requirements for later stage factories are based upon (detailed) projections rather than observation. While this data was carefully developed and is believed to be highly credible, the project management for DSi2 favored conservative assumptions about personnel requirements. It is reasonable to assume that actual effort required to implement may be significantly less than forecasted.
5.2.2 Increased Speed of Implementation
In the case of Dell's DSi2 program, a large percentage of the implementation team was shared between multiple location installs. Since limited IT staff resources would have precluded the company from developing multiple (separate) applications in parallel, the copy exact approach taken greatly reduced the number of months necessary to get all facilities up and running. Figure 5-2 below shows the contrast between the timeline of implementations actually achieved (left) with what might have existed assuming a complete "from scratch" sequential approach (i.e. focusing IT resources on
developing a solution for Factory A, then focusing those resources on creating a new solution for Factory B, etc). As the graphs illustrate, the sequential copy exact approach allowed the implementation team to cover all 12 worldwide facilities in less than 600 days (from initial development to 12th go-live). By contrast, had each factory received a solution that did not build on previous work, fewer than three full implementations could be completed in the same time period.
Sequential Copy Exact Implementations APCC2- C=Y BCC- 0 EMF2 0 AMI MT12-Lat C= CCC Y APCC EG1 -r C1 PN1 <....5 MT12 a PN2 r 0 200 400 600
Days (Development Begins at 0)
Sequential Non-CE Implementations
PM
- MT-PN21 0 100 200 300 400 500 600 [ays (Development Begins at 0)Figure 5-2 Speed of Multiple Implementations: Copy Exact vs. Non-Copy Exact Approach
5.2.3 Greater Stability of Implementation
Stability of implementation is a critical consideration for any system that touches mission critical areas of an organization. In the case of Dell and DSi2, the application
impacted order delivery performance and component inventories on-hand, arguably two of the most important metrics in operations at Dell. Thus, one of the most
significant benefits of Copy Exact in the case of DSi2 was stability of implementation. To measure the fuzzy concept of "stability", we can look at several different metrics. In the case of this study, two major avenues were pursued: factory performance metrics and error reporting metrics. A factory performance metric approach would attempt to measure "stability" of an installation by how much variability or chaos appeared in factory metrics (e.g. inventory, cycle time, % of OMAC fails, etc) and would equate this variability with the newly implemented system's instability. Ultimately, this approach was rejected since too many external variables existed in the environment that
potentially confounded the validity of the factory metrics (e.g. supplier recall on part X or a spike in order volume at time Y).
Instead, this study took the approach of monitoring reports of known system errors, or "bugs" that are conveniently tracked by the company's centralized IT group via a software package called Remedy. IT related problems experienced by factory