Development of a Connected Platform for Industrial
Equipment Monitoring to Enable Predictive
Maintenance using Supervised Machine Learning
Methods
by
Jessica Madison Wu
B.S., Harvard University, Cambridge, MA, 2014
Submitted to the Department of Mechanical Engineering and the MIT Sloan School of Management in partial fulfillment of the requirements for the degrees of
Master of Science in Mechanical Engineering and
Master of Business Administration
in conjunction with the Leaders for Global Operations Program at the
MASSACHUSETTS INSTITUTE OF TECHNOLOGY
June 2019
@ Jessica Madison Wu, MMXIX. All rights reserved.
The author hereby grants to MIT permission to reproduce and to distribute publicly paper and electronic copies of this thesis document in whole or in part in any medium now known or hereafter created.
Signature redacted
A u th or ... ...
Department of Mechanical En e ing and the MIT Sloan School of Management
S.- May 10, 2019
Signature redacted
C ertified by ...
Daniel Frey, ThesisfSuperviso Professor of Mechanical Engineering, MIT Department of Mechanical Engineering
Certified by...Signature
redacted
John Carrier, Thesis Supervisor Senior Lecturer of System Dynamiyg(:ThSchool of Management
Signature redacted
Approved by...Nicoa ...
Nicolas Hadjiconstantinou
Chair, Mechanical Engineering Committee on Graduate Students
Approved by...Signature
redacted
Maura Hferson
H Assistant Dean, MBA Program, MIT Sloan School of Management
JUN
04 2019
ARCHIVES
MITLibraries
77 Massachusetts Avenue
Cambridge, MA 02139 http://Iibraries.mit.edu/ask
DISCLAIMER NOTICE
Due to the condition of the original material, there are unavoidable flaws in this reproduction. We have made every effort possible to provide you with the best copy available.
Thank you.
The images contained in this document are of the best quality available.
Development of a Connected Platform for Industrial Equipment
Monitoring to Enable Predictive Maintenance using Supervised
Machine Learning Methods
by
Jessica Madison Wu
Submitted to the Department of Mechanical Engineering and the MIT Sloan School of Management on May 10, 2019, in partial fulfillment of the requirements for the degrees of
Master of Science in Mechanical Engineering and
Master of Business Administration
Abstract
SHAPE Technologies is the world leader in ultra high pressure industrial waterjet systems
for cutting and cleaning with applications from metal to food. Although SHAPE is the technological leader in this space, SHAPE must continuously look toward developing new capabilities to differentiate its products. SHAPE has historically outfitted its machines with a suite of sensors, however these systems in the field do not store the data, thereby losing the time series relationships and historical log of machine health. One opportunity is to create a connected platform that leverages this data to help SHAPE's customers move away from a break fix model to a predictive maintenance program.
This project seeks to expand on a sensor connectivity proof of concept ("POC"), which the team successfully built on a prototype grade Raspberry Pi, and make the platform ready for customer beta trial. First, this project explores important infrastructure, legal, and supply chain challenges that impact the commercial business when connecting industrial equipment to the internet as well as the technological considerations to make the platform both backwards and forwards compatible. Second, this project helps define the minimum viable product requirements for industrial infrastructure and devices configuration. Third, this project merges the POC captured data and lab data to train and validate supervised machine learning models to predict failures several days in advance and demonstrates how such a system can help customers mitigate unplanned downtime.
Thesis Supervisor: Daniel Frey
Title: Professor of Mechanical Engineering, MIT Department of Mechanical Engineering Thesis Supervisor: John Carrier
Acknowledgments
I would like to thank my advisers, Professor Frey and Professor Carrier, for their patience,
continued support, and guidance through this academic journey. I would like to thank the entire team at SHAPE Technologies for hosting me and rolling up their sleeves alongside me for seven months to move this project forward. I would like to thank the Bright Wolf team for their partnership throughout this learning process. I would also like to thank Danny and Joel from American Industrial Partners for their mentorship. Last but not least, I want to thank my mom Jie and my dad Xinmin for their continued support in my pursuit of knowledge.
My dad started this graduate school journey with me but passed away in February of 2018.
THIS PAGE INTENTIONALLY LEFT BLANK
Contents
1 Introduction 1.1 1.2 1.3 1.4 1.5 Background .... ... . . .. .. .. . . .. .. ...1.1.1 Overview of maintenance strategies for industrial equipment
1.1.2 Overview of waterjet cutting technology . . . .
1.1.3 Critical failure modes in waterjet systems . . . . HoT case studies on industrial equipment industry peers . . . . General problem statement . . . .
Methods ... ...
P roject goals . . . .
2 What is the business case for an IIoT platform for waterjets?
2.1 What is the definition of success for implementing HoT? . . . .
2.2 How can SHAPE make the most impact with the platform in the short term?
2.3 How can SHAPE make the most impact with the platform in the long term?
3 What is the best approach to implementing a connected platform across multiple brands?
3.1 Legacy products . . . .
3.2 Next generation products . . . .
4 Supervised machine learning data analysis
4.1 D ata collection . . . . 4.2 D ata cleaning . . . . 15 15 15 20 21 23 26 26 27 29 32 33 34 35 36 38 41 41 43
4.3 Data analysis methodology . . . .
4.3.1 Data exploration . . . .
4.3.2 Principal component analysis . . . .
4.3.3 Analysis approach . . . .
4.4 Results and discussion . . . .. . . .
4.4.1 O verview . . . .
4.5 Model evaluation . . . .
4.5.1 Cross validation . . . .
4.5.2 Binary classification and regression trees . . . .
4.5.3 Comparison of supervised and unsupervised learning methods
4.5.4 Field validation of model . . . .
5 Application of project learnings for the industry 6 Conclusions and recommendations
6.1 Risks and mitigants . . . .
6.2 Future w ork . . . . 6.2.1 Customer beta testing . . . .
6.2.2 Updating sensors and hardware . . . .
6.2.3 Improvements to predictive algorithms . . . .
6.2.4 Tangential projects and features . . . .
8 . . . . 46 47 49 . . . . 50 . . . . 52 52 52 . . . . 53 . . . . 55 56 57 59 61 63 65 65 65 66 67
List of Figures
1-1 This figure from a recent OSI Soft presentation summarizes how "new maintenance
strategies offer more efficient and more effective alternatives to reactive approaches."
[14]
161-2 The price of sensors used in mass scale connected IoT applications have fallen
by half in the recent decade. [12] . . . . 18 1-3 This figure from the 2017 BSquare Annual HoT Maturity Survey [...j in
Manufacturing, Oil and Gas, and Transportation defines five typical phases to an HoT deployment framework and relative adoption in oil and gas. The framework can be adopted to manufacturing and other industries by refining
the meaning of phase four for the specific industry. [11 . . . . 19
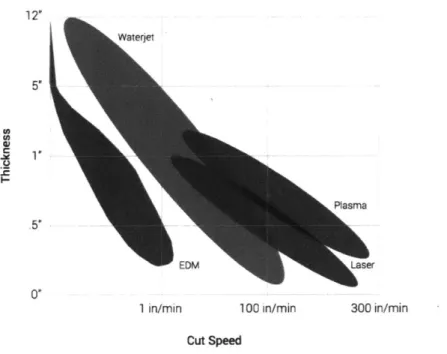
1-4 This chart compares the cut speed versus thickness of a metal using various cutting methods. Waterjets may not be the fastest cutting method compared to its subtractive process peers, but waterjets are versatile, do not emit noxious
gasses, and do not create a heat affected zone.
[3]
. . . . 221-5 Some common issues encountered in operation of hydraulic intensifiers. . . . 23 1-6 This is an example of one variant of Flowserve's add-on beacons which pack
additional sensors used for asset monitoring. There are options to connect to these beacons via Bluetooth and to monitor them through a paid application. [4] 25
2-1 The top sources of revenue growth from IoT enabled systems. [8] . . . . 31
3-1 There is an operational and development spending advantage to sharing a
codebase to generate the UI for different products. This prototype dashboard
4-1 Overview of the supervised machine learning workflow utilizing Microsoft Azure services. The Additional Lab DAQ Data input icon represents the
combination of the National Instruments DAQ data as well as the lab logs. . 42
4-2 This pump diagram illustrates how the dual intensifier lab test pump is set up. For example, the variable Pump Case -1 is the temperature of the pump case for intensifier 1/KFI and CylDyn -1-2 is the temperature of the dynamic
seal on the cylinder on the left side of intensifier 1/KFI. . . . . 44
4-3 The bar graph shows the status of the pump as determined by the hydraulic
intensifier. . . . . 47
4-4 The bar graph tallies the reasons for shutdown as determined by the hydraulic
intensifier. . . . . 48
4-5 The bar graph tallies the warning codes during operation as determined by
the hydraulic intensifier. . . . . 49
4-6 These bar graphs tally the reason for shutdown and maintenance as noted in the lab logs. The left graph represents root cause parts maintenance on the
-1, or right side, and the right graph represents root cause parts maintenance
performed on the -2, or left side, of the KFI intensifier. . . . . 49
4-7 These are the resulting metrics for predicting a warning due to a check valve
over temp with 10 fold cross validation. . . . ... . . . . 54
4-8 This graph shows the improvement of the F-score on predicting a warning due to a check valve overtemp with 10 fold cross validation with an increasing
prediction window . . . . 54
4-9 Binary classification trees are effective to triage conditions with given features. However, it is necessary to balance the trees and limit depth to prevent overfitting. This example tree seeks to triage the event of a dynamic seal failure. . . . ...55
4-10 This graph groups different operating periods of the KFIII intensifier into six
operating states, with one of those an anomaly. . . . . 56
4-11 This graph paretos the input features by importance, ranked in descending order on the left, by their percentage of contribution, by the scale on the top,
to identifying the specific state. . . . . 57
6-1 Progress of SHAPE's engineering development and research on how to use
HoT to deliver value to the company and customers overlaid on top of Figure
1-1 from OSI Soft detailing the typical phases of development. The bolded
star bullets denote customer readiness and the bolded circular bullet denotes
validation readiness. . . . . 62
6-2 As a part of the condition based maintenance features, each system will
send a series of alerts from warnings to emergency stop ("E-stop") events to authorized users. These alerts add value because they lead to immediate remediative actions or can be interpreted holistically over time to triage impending
system issues. . . . . 62
6-3 A group of subject matter experts brainstormed future features for the HoT
platform on adhesive notes, discussed each idea, and translated the most near
THIS PAGE INTENTIONALLY LEFT BLANK
List of Tables
1.1 These are the major similarities and differences between waterjet technology
and that of its subtractive manufacturing peers.[3] . . . . 21
2.1 A breakdown of one time costs for establishing a connected platform. .... 30
2.2 A breakdown of the recurring costs for maintaining a connected platform. . . 30
2.3 A breakdown of one time costs for each additional connected waterjet system. 30
2.4 A breakdown of recurring costs for each additional connected waterjet system. 30
3.1 The current state of modules and subsystems across SHAPE brands. A mark
under standard indicates the module has been standardized and a mark under
option indicates options customers can select for that module. . . . . 37
3.2 The next generation of modules and subsystems across SHAPE brands. A
mark under standard indicates the module has been standardized and a mark
under option indicates options customers can select for that module. . . . . . 39
4.1 This is a representative format of the raw DAQ data set. Variables are denoted
by v. These variables are not the same as the IoT variables and states. . . . 43
4.2 This is a representative format of the raw IoT data set. Variables are denoted
by v and state conditions are denoted by s. These variables and states are
not the same as the DAQ variables and states. . . . . 43
4.3 This is a representative format of the raw lab data set. Some variables are
4.4 This is a representative format of the cleaned data for each intensifier. Variables are denoted by v and state conditions are denoted by s. The engineering log
data was merged into two of the state condition columns. . . . . 45
4.5 This table was generated after consulting two subject matter experts on the
most important variables and interactions that lead to common failures. . . . 46
4.6 This table shows how one member of the set of strings is selected and all the
times with that event, such as at time t, is marked with a 1. . . . . 51
4.7 This table shows how all rows preceding to the event within x minutes away
from time t, when the warning or error occurs, are marked times with a 1. 51
4.8 These sample results show the ability for boosted trees to correctly identify common warnings such as dirty oil filters, check valve over temps, and over speed shutdowns. More data is needed to improve predictions for rare events,
such as dynamic seal failures. . . . . 55
Chapter 1
Introduction
1.1
Background
SHAPE Technologies ("SHAPE"), formed through the acquisition of 10 companies, is a
leading provider of ultra high pressure ("UHP") waterjet cutting solutions. SHAPE's business strategy focuses on both new systems as well as aftermarket services and sale of consumable parts. As competition intensifies, SHAPE is looking toward new technologies, including this exploration into adding an Industrial Internet of Things ("IloT" or "IoT") connected platform, to update and differentiate its product offerings.
1.1.1
Overview of maintenance strategies for industrial equipment
The metamorphosis of maintenance strategies for industrial equipment evolved over time alongside the advancement of technology and accelerated with the recent decline in cost of data acquisition and computing. Maintenance of industrial equipment started on a break fix model, where operators would run the equipment until failure and then fix it. After repeat experience running the equipment, an operator may develop insights about the machine and find a correlation between a certain sound or symptoms, such as part wear, to a maintenance need. However, it takes a long time to develop these attributions and they are difficult to convey from one operator to another without extensive training.
the amount of unplanned downtime per operating hours. A break fix model leads to the most unplanned downtime because there is seldom intervention on the failing part, leading to reactive maintenance. This reactive maintenance strategy is typically more expensive because it is assumed that one discovers the issue upon operation and one is operating the equipment to use as part of a value added process. As a result, the user will not only incur the downtime costs of idle employees and missed productivity but also in expedited equipment service chargyes.
The opportunities for improvement over this reactive maintenance strategy is outlined in Figure 1-1. As an industrial equipment company invests time and fixturing or instrumentation into studying their products, the next step is to offer preventative maintenance. A preventative maintenance strategy relies on time based maintenance intervals to dictate when to replace a part or perform a service. The time interval is either based on calendar days since last replacement or run time as measured by the machine.[14]
Effectiveness
Condition-Bmsed
Efficiency
Figure 1-1: This figure from a recent OSI Soft presentation summarizes how "new
maintenance strategies offer more efficient and more effective alternatives to reactive approaches." [14]
This strategy is an improvement over reactive maintenance; however, it is still far from ideal. First, the run time measurement, if not subject to human log errors, rely on a run time clock on the equipment that can reset or fail to reset for a host of reasons. Second, the time interval suggested by the manufacturer is determined in a lab under a predefined set of operating conditions and assumptions. These operating conditions are based on limited data sets and may not be representative of each customer's use case and the resulting time
interval likely errs on the side of caution to ensure high uptime. For example, if a part has an average useful life of 100 hours but a standard deviation of 10 hours, the manufacturer may suggest replacement after 80 to 90 hours of operation to maintain uptime above 99.9% or 97.7%, respectively. Third, these preventative maintenance strategies are effective against unplanned downtime caused by routine part failures but do not encompass edge cases or failures due to system interactions specific to each customer.
While a conservative preventative maintenance strategy can minimize unplanned downtime, the cost is high because the customer is forfeiting multiple standard deviations of the useful life of each part to achieve this level of uptime. It also creates a potentially unfavorable dynamic for the manufacturer if they cannot promise as many run time hours as a competitor in the same market. The customer incurs higher operating costs with both the reactive maintenance and preventative maintenance strategies.
Over the past decade, the price of sensors have decreased by half (Figure 1-2). As the price of sensors fell and their accuracy remained high despite increasingly smaller packages, like in the case of the accelerometer, the use of sensors in expensive industrial equipment increased.[15] These sensors help monitor the status of the machine and the availability of these sensors gave way to condition based maintenance. Additional on board sensors provide operators with more data to pair with their experience, such as the listening for certain sounds, or to help corroborate their hypothesis. In these scenarios, the instrumentation is only useful if paired with a subject matter expert who can interpret the sensor outputs or know the correct course of action given an out of range indicator. The most advanced version of condition based maintenance monitors the sensor data continuously and signals to the operator at predefined thresholds. The resulting action is still up to the operator's discretion, but using condition based maintenance thresholds coupled with less conservative time based preventative maintenance intervals can help signal earlier than expected failure or an impending obscure failure mode. In this way, a condition based maintenance strategy helps the customer recapture some of the lost useful life of a part as an improvement over a purely time based preventative maintenance strategy. These additional sensors also offer the manufacturer the opportunity to review the data, if it is stored or shared, to better triage the system and get it back up and running faster or, at the least, understand their systems
better to make improvements in future product development. The average cost of loT sensors is falling
$1.50
1.25 2004 average cost: $1.30 1.00
0.75
0.50
0.25 2020 average cost forecast $0.3
0
'04 '06 '08 '10 '1? 'l '16 '1F '?0
Figure 1-2: The price of sensors used in mass scale connected IoT applications have fallen
by half in the recent decade.[12]
The shift to the latest maintenance strategy, predictive maintenance, accelerated rapidly
over the past few years. It was expensive until the recent decade to collect extensive amounts
of data and process it locally. Additionally, the hardware for on premise data storage was
expensive to buy and maintain. Pooling of privatized, lower cost data servers through services
like Google Cloud, Microsoft Azure ("Azure"), and Amazon Web Services ("AWS") made
mass adoption of cloud storage affordable and the internet made this data available world
wide. The availability and affordability of storage coupled with that of sensors precipitated
an environment ripe for collection of big data sets; this practice is generally called IoT.
The industrial sector has embraced IoT connected platforms over the past several years.
According to the Bsquare annual survey from 2017, over 86% of companies surveyed leverage
HoT with 33% of manufacturers surveyed stating that they established their HoT solution
in the past 12 months. [1] The BSquare HoT Maturity Model delineates five phases as shown
in Figure 1-3, where the first phase is data connectivity with data forwarding and the final
phase is data processing at the edge.
A preventative maintenance strategy offers several advantages over a condition based
maintenance strategy. Through habitual retraining of machine learning, or statistical, algorithms, conditional thresholds that were once predetermined in the lab can now be altered dynamically.
IloT Use
(by %of responses)
Device connectivity and simple data forwarding
Real-time dashboards and monitored activity through constant data stream
2
Advanced analytics, such as machine learning, cluster analysis, and artificial intelligence, from data scientists
3
Automated simple. single-stem- -- Best RoI
4 Value
Data processing on (or very close to) connected equipment, in addition to
functions performed in gateways or the cloud
Figure 1-3: This figure from the 2017 BSquare Annual HoT Maturity Survey [...] in
Manufacturing, Oil and Gas, and Transportation defines five typical phases to an HoT deployment framework and relative adoption in oil and gas. The framework can be adopted to manufacturing and other industries by refining the meaning of phase four for the specific industry. [1]
Furthermore, the rapid feedback and analysis against the aggregate model can detect anomalies
as well as benchmark system health against historical units. Algorithms can use this
historical data to provide the operator with a wide set of useful or actionable insights, including a prediction of the remaining useful life of a part or an alert before a trending failure. Without statistical analysis, some of these non-linear and multi-factor failure modes would be difficult to recognize even with a trained eye. Not only do these methods decrease the need for a subject matter expert to analyze the data, the equipment owner can also avoid unplanned downtime if alerted to order a replacement part before failure or if the operator can shut down the system before a catastrophic event and avoid extensive maintenance.
For most industrial companies, it is a journey to arrive at a meaningful predictive maintenance program due to a series of common hurdles. First, it takes a few iteration of the industrial product to add in sensors and the best set of sensors to feed the predictive models. Second, an HoT strategy can only succeed with the support and alignment of management, engineering, and sales. Third, it will take a long time to collect sufficient failure data for each failure mode, especially the edge cases, to train and then validate new models.
A panel of speakers at the 2018 HoT USA Conference revealed and agreed upon the top
challenges companies face when trying to implement an HoT strategy. [9] The first is that the organization must have a champion for the connectivity initiative. Second, the champion must empower the team of subject matter experts to experiment with new methods while protecting this team from the politics in the rest of the organization. Third, this team must quickly work to showcase the utility of a connected system to the rest of the organization through a minimum viable product ("MVP").
1.1.2
Overview of waterjet cutting technology
High pressure waterjets pumps were invented in the 1950's in Baxter Springs, Kansas and further refined in the 1960's by Flow International Corp., a brand which is now part of
SHAPE. Waterjets rely on the double ended stroking piston inside an intensifier pump'
to compress filtered water.[13] The pressurized water is delivered to a tapered nozzle that further increases the pressure. This water escapes the nozzle in a high pressure stream and a gantry system with four or more degrees of motion directs the nozzle to make 3D cuts. The cuts typically creates a V-shaped tapered kerf in thicker materials, which can be compensated through tilting the cutting head.
In 1982, Dr. Mohamed Hashish patented the technology to introduce abrasives to the pressurized water stream to cut through harder materials.[10] Abrasive waterjets can be used to shape metals over twelve inches thick and is most versatile compared to competing technologies such as plasma or laser (Figure 1-4). It is differentiated from laser and plasma cutting because there is no heat affected zone around the cut. Some drawbacks of waterjet technology is it has a reputation as a dirty process if abrasive garnet is added to the high pressure stream. The units are also loud due to the intensifier stroking action and the lack of a noise barrier around the machines. New waterjet models provide sound attenuation around the intensifiers and these covers reduces the noise to 75dB. However, waterjets hold an advantages over laser, EDM, and plasma cutters because they do not emit hazardous vapors. Waterjet technology remains the most versatile among its class as summarized in
This thesis will only focus on waterjets driven by hydaulic intensifiers and will omit consideration for direct drive pumps.
20
Waterjet Plasma Laser Electrical discharge machining
(EDM)
Process erosion burning or melting erosion
melting
Secondary none slag grinding sometimes none
Processing to remove removal of
heat affected oxidized edge
zone and and heat
flattening affected zone
Materials virtually any steel and primarily conductive
aluminum steel and materials
aluminum
Thickness up to 24" 2-3" up to 1" up to 12"
Part 0.001" 0.010" 0.001" 0.001"
Accuracy
Table 1.1: These are the major similarities and differences between waterjet technology and that of its subtractive manufacturing peers.[3]
Table 1.1.
1.1.3
Critical failure modes in waterjet systems
An abrasive waterjet can be broken down to five major subsystems:
1. Controls and electricals
2. Intensifier(s)
3. X-y motion table
4. Cutting head and gantry system
5. Reservoir tank
Subsystems 1 and 5 rarely face critical failure modes. The X-y motion table can induce
errors in the cut if the motion is not smooth, is not calibrated, or if the motors fail. The critical failures that account for the majority of unplanned downtime under a break fix model are due to the intensifier and the cutting head. This intuitively makes sense because both
12"
i
Waterjet 5" .51' EDM Lase-, 001 in/min 100 in/mir 300 1r/in
Cut Speed
Figure 1-4: This chart compares the cut speed versus thickness of a metal using various
cutting methods. Waterjets may not be the fastest cutting method compared to its
subtractive process peers, but waterjets are versatile, do not emit noxious gasses, and do not create a heat affected zone.[3]
the intensifier and the cutting head are subject to immense pressures on the order of 60 kpsi to 90 kpsi and parts of the cutting head are subject to abrasive wear due to the addition of garnet to the water stream.
The intensifier actuates at roughly 120 strokes per minute with pressurized water inside the bore. There are a set of metal to metal dynamic seals inside of the intensifier as well as a set of check valves. These seals and valves can fail catastrophically and cause leaks and a loss of pressure approximately once every 500 operating hours in a 60 kpsi intensifier. Another, though less common failure mode, is tunneling inside the bore whereby impurities in the water cut channels inside of the high pressure cylinder and create channels that bypass the seals. This failure happens roughly once every eight to ten million strokes of the intensifier. Some common types of failures are highlighted in the intensifier troubleshooting guide reproduced in Figure 1-5.
When abrasive garnet is added to the pressurized water stream inside the cutting head, it 22
hftnsffler Trw&"habt Gedd.
F l o w
OL
stefedh dwun*HPIraious jede, g 4w
HHOT iWTrE
HOT ~Los VAwER ' oos aet od
itself over the course of 100 plus hours of jet on time, depending on the cutting application.
The cutting head can also fail suddenly if the head snaps due to stress fractures. Both of these failure modes would result in unplanned downtime under a break fix model. Additionally, a clog in the abrasive feed line could result in machine downtime and, potentially, render the part in progress defective, but would not necessarily require a part replacement.
1.2
IhoT case studies on industrial equipment industry
peers
Although IhoT is relatively new to the industrial space, most of the largest players have invested heavily in developing predictive tools to both enhance the customer experience and deepen their share of wallet. As discussed in Section 1.1.1, 86% of companies have embarked
on their IhoT
journey.
The following three examples illustrate how companies throughoutthe industrial space are pursuing various IhoT strategies. The companies highlighted are
equipment, which are primarily pumps, subtractive manufacturing equipment, and aircraft engines, respectively, yet all three employ similar data ingestion and data processing methods. Flowserve provides pumps and valves to power, oil and gas, and chemical industries. In 2012, Flowserve introduced its first generation of wireless beacons. These beacons can be retrofitted onto assets after purchase and offers wireless transmission of data. [5] In an interview with one of Flowserve's longtime HoT product managers, he highlighted the biggest challenges and shared the status for Flowserve's systems. Two of his team's main challenges were the management of expectations and the scope of the technology featured in the initial release. His advice is to create a working platform for condition based maintenance before building out advanced preventative maintenance features because there is significant value to gain from executing a condition based maintenance strategy.
As of 2016, Flowserve's customers utilize the connected beacons to monitor the conditions of these high value pump without predictive features. Per the specifications of the latest beacon, it offers additional temperature sensors, 14 days of fault storage, and vibration sensors. Different versions of these beacons are added to various parts of the system and then monitored via a mobile and web application that highlights the health and alerts for each beacon. [6]
For industrial subtractive manufacturing equipment companies, the state of the art for a connected platform is found in computer numerical control ("CNC") machines. These machines are often outfitted with crash sensors and linear or rotational feedback. They have additional sensors that count parts to automate production. As a byproduct of automation, the units are not only able to monitor cut speed and feed rates but also cooling fluids, the absence of material, and part inspection. CNC machines can be part of larger automated cells and thus can become a bottleneck if they break. Therefore, catastrophic failures would result in line down events and owners of these high value added processes seek preventative measures.
The HoT systems made for CNC machines, such as those provided by Fanuc, offer preventative features that target these failures which result in unplanned downtime.[111
They monitor the cooling fans and motors and signals predicted deterioration. Other
predictive maintenance programs target the calibration of a CNC machine against baseline, 24
Figure 1-6: This is an example of one variant of Flowserve's add-on beacons which pack additional sensors used for asset monitoring. There are options to connect to these beacons via Bluetooth and to monitor them through a paid application.[4]
real time measurements, and usage.[16] Most of these systems offer several but not all monitoring features due to the fragmentation of CNC machinery manufacturers and retrofit compatibility with different machines.
GE Aviation utilizes HoT on their high pressure nozzles and shrouds manufacturing lines
to shift from preventative maintenance activities to condition based [7]. They did this by first
digitizing the paper logs that they previously had taped to machines. Then they connected their machines to the internet to harvest sensor data such as pressure, temperature, and currents. Finally, they hold daily scrum meetings or weekly stakeholder meetings to triage different machine conditions.
While these three examples highlight the proliferation of HoT related activities at large industrial equipment manufacturers, it is important to note that most companies, including
two of the three spotlighted cases, have not reached the latter phases of the maturity framework as defined in Figure 1-3.
1.3
General problem statement
Recent computing advancements, price deflation in local storage, cloud storage, and computing power make continuous asset monitoring technologically and economically feasible. Historically,
SHAPE has outfitted assets with sensors that monitor pump health including stroke rates,
temperature, and pressure. However, SHAPE has not stored this information from these legacy systems to enhance the customer experience or leveraged the data to deduce learnings to carry forward into future product development. Due to the higher cost of operation relative to other subtractive manufacturing processes, waterjets are often chosen when there is no more economical options to perform the specific manufacturing operation. Therefore, the cost per length of material cut is crucial to the economics of operating a waterjet. The majority of SHAPE's customers own few waterjets, which means downtime on a waterjet often halts the entire job. The focus of this investigation is to research different ways to connect to these assets, store, and analyze the data generated to add value to both customers and to
SHAPE.
In addition to providing more uptime to the customer and improving the customer ownership and operating experience, SHAPE seeks to capture a larger share of wallet on aftermarket sales and services to smooth out revenue through the HoT platform.
1.4
Methods
This project has three work streams. First, it is to understand the drivers of the business case and garnering stakeholder support. Second, it is to define the common hardware package and information technology ("IT") infrastructure workflows that all brands can utilize. Third, it is to explore the data to develop predictive insights for the intensifier.
This thesis will cover two of these workstreams to get SHAPE ready for a customer beta trial on their connected platform:
1. Business Case Development
(a) Understand how SHAPE operates in order to scope the minimum viable product and to identify the near term opportunities and the long term opportunities.
(b) Use project management best practices to build consensus and align the team to
execute to the roadmap
2. Data Analysis and Predictive Modeling
(a) Collect, clean, and present the data to demonstrate the value proposition to the business because it wants to understand how the customer uses the waterjet systems
(b) Use this same data to provide predictive insights to the customer to decrease their
unplanned downtime
1.5
Project goals
A previous Leaders for Global Operations ("LGO") thesis by Lee Evangelakos established
proof of concept connectivity to one of the SHAPE brands using a Raspberry Pi micro-controller with WiFi shield to monitor and study the intensifier. [2] Evangelakos was able to reach phases one and two of the BSquare Maturity Model as defined in Figure 1-3. The work presented in this thesis will expand on her work by creating an industrial grade platform that can interface with and ingest data from all brands and leverage sensors beyond the standard set to build predictive models. This advances the SHAPE system forward to phase three, advanced analytics, and partially to phase five, data processing at the edge and in the cloud. The remainder of this thesis addresses the commercial readiness and SHAPE's progress from preventative toward condition based and predictive maintenance strategies.
THIS PAGE INTENTIONALLY LEFT BLANK
Chapter 2
What is the business case for an HoT
platform for waterjets?
Ricardo Buranello, Vice President of Sales at Telit, summarized the common objectives for an organization that wants to implement HoT. These organizations all want to use the connected system to make money, save money, or stay compliant.[9] For SHAPE, there is opportunity in all three areas.
To understand how to make money, one must look at the economics behind standing up, expanding, and maintaining an HoT platform. There are costs associated with the platform and costs associated with adding additional assets, in this case waterjet systems, to the platform. The one time costs, as listed in Table 2.1, for establishing the platform are the highest, while the one time costs, as listed in Table 2.3, for adding additional assets are incremental. The biggest line item for the one time costs for adding an additional asset is from the industrial gateway. If the cost of industrial grade gateways decreases, like the cost of sensors has decreased, this could further accelerate the addition of connectivity to lower end industrial equipment. The recurring costs for the platform, as listed in Table 2.2, depend primarily on how aggressive the organization wants to be in rolling out new features and maintaining uptime. The recurring costs for each asset, as listed in Table 2.4, depend primarily on the volume of data sent back and forth to the cloud and the number of cloud services utilized. Therefore, to keep these costs low, it is imperative to maximize the number of computations that are performed at the edge or in the local gateway and to minimize the
rate of sensor data transmitted to and processed in the cloud. One Time Platform Costs Example
Hardware specifications, development
Software applications, user interface,
website
IT data pipeline, services setup
Table 2.1: A breakdown of one time costs for establishing a connected platform.
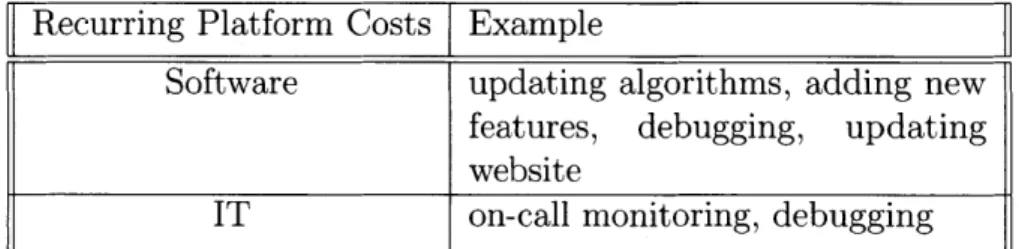
Recurring Platform Costs Example
Software updating algorithms, adding new
features, debugging, updating website
IT on-call monitoring, debugging
Table 2.2: A breakdown of the recurring costs for maintaining a connected platform.
breakdown of one time costs for each additional connected waterjet system.
breakdown of recurring costs for each additional connected waterjet system.
With these costs in mind, industrial companies, like SHAPE, can charge for the connectivity package or can sell a subscription service that promises monitoring or uptime guarantees. New products and services tops the list of revenue sources enabled by HoT in Figure 2-1. Customer experience also improves with the introduction of a connected platform. A positive customer experience helps boost the perceived value of the product, word of mouth references, and repeat customer purchases. The aftermarket parts and services market is strong for
30
One Time Costs per Asset Example
Labor install, commissioning
Hardware sensors, gateway
Software operating system
Table 2.3:
Table 2.4:
A
A
Recurring Costs per Asset Example
Network cellular, WiFi
IT cloud hosting, licensed services
waterjets due to high volume of consumable parts, such as seals, focus tubes, and abrasives. The data from these machines can inform SHAPE when to remind customers to purchase consumable parts; maintaining these constant touchpoints with the customer discourages them from purchasing from non original equipment manufacturer ("OEM") replacement parts providers. Furthermore, SHAPE can sell add-on services to the customers with these connected assets based on their unique needs to create new revenue streams. For example, a customer who uses waterjets to drill holes may want to purchase a pierce sensor that stops the flow of abrasives when the material is cut through.
How is 1hoT growing manufacturing revenue? Percent of respondents
New products/services 52%
Customer experience 51
New revenue streams 51
Creating a new market 46
More market share 34
Better pricing 31
Data: GENPACT: '2016 Reality Check: Transforming Industrial Businesses with the Internet of Things.
Figure 2-1: The top sources of revenue growth from IoT enabled systems.[8]
As described above, there are many immediate and advanced ways to make money, but there are several opportunities for SHAPE to save money as well. SHAPE can utilize the data to verify warranty claims by confirming proper use and operating hour claims. SHAPE can also preemptively ship out parts to customers before failure to mitigate the need for expedited shipping, especially on heavy intensifier parts. There are recorded cases of SHAPE shipping the wrong parts because the customer communicates their model number over the phone and then verbally describe the part, leading to the wrong selection. This also causes an inefficient and stale customer experience. Therefore, a condition based alert system will lower both shipping and administrative costs. There are also customer service tickets logged for trivial technical support interactions; an additional investment to allow for self-diagnostic troubleshooting through the HoT application would eliminate these types of calls.
The final motivation for implementing IHoT is to help maintain compliance, such as in the pharmaceutical, automotive, or food processing industries, where processes are heavily
regulated and traceability and safety are paramount. Although SHAPE itself is not subject to these compliance regulations, its customers are. For example, SHAPE sells equipment to poultry processing plants as well as to numerous automotive and aerospace customers. The ability to monitor the progress of high value or high cost of failure processes is important for these types of customers in addition to having traceability for compliance.
2.1
What is the definition of success for implementing
HoT?
This connected platform, when deployed across SHAPE, will initially allow SHAPE to track data generated by pump assets and, ultimately, all system assets. The main technical components include hardware connectivity to the programmable logic controllers ("PLC") and both web and mobile user interfaces built on top of custom IT infrastructure. This platform allows SHAPE to differentiate itself from competitors by providing a level of digital sophistication that some customers are asking for, yet most customers cannot or do not have the bandwidth to achieve on their own.
ROI =- Net Profit
One Time Costs + (Recurring Costs Asset x Number'of Assets)
In addition to product differentiation, the definition of success for an industrial manufacturing company, like SHAPE, is monetizing on the data. The return on investment ("ROI") for adding connectivity to machines can be calculated by dividing net profits by the sum of all the one time costs and the cumulative sum of the product of the recurring costs with the number of assets per Equation 2.1. This macro level view on the investment is a good benchmark against other high priority projects, but the long term strategic benefits are not captured in the ROI.
Other ways to quantitatively measure success is to project out increases to revenue from new system sales due to more market share, aftermarket parts and services, add-on program sales, better pricing, and savings on operating expenses before and after implementing HoT on a population of assets.
2.2
How can SHAPE make the most impact with the
platform in the short term?
Within the first couple of years, the addition of connected features to waterjets will help sustain aftermarket sales and services. The addition of HoT enabled features will provide a perceived added value to SHAPE pumps and systems even when there is incremental learning from the hardware due to the nascent platform. SHAPE can guarantee an industry leading uptime through a fee per asset maintenance program that also lowers maintenance costs for end customers, creating value for both parties. The ability to monitor maintenance intervals also translates to lower inventory costs for SHAPE due to an increased confidence in the level of inventory on hand.
Since most of the data acquisition required is already tracked locally by the pump but not stored, having access to the raw data in of itself is valuable for learning about the robustness of SHAPE's legacy designs in the field. Operators are able to step away from their machines and still monitor their machines, which is valuable when operating a waterjet where complex geometry or jobs cutting thick materials tend to be long. This frees up an operator's time to perform higher value added tasks.
Furthermore, the ability to understand the exact cutting cost of one's
job,
and the optionto receive real time alerts based on failure conditions are some of the ways the connected platform will enhance and streamline the customer experience. The ability to track jet on time improves a contract waterjet shop's quoting accuracy. This also opens up additional business models, such as leasing waterjet systems by the run hour or charging jobs by cost per length at the quoted speed.
When SHAPE is able to present the customer with an option to order necessary replacement parts at the click of a button, it will discourage them from shopping around. This added convenience in the consumables reordering process will curtail customer churn in aftermarket sales. These are just some of the benefits which SHAPE will immediately derive from the HoT platform.
2.3
How can SHAPE make the most impact with the
platform in the long term?
In the long term, SHAPE will be able to leverage the platform to capitalize on new sales, recapture a larger share of aftermarket, develop insights on how to improve the next generation product, and facilitate distribution of add-on software services. Some customers such as those in Italy, where there is a tax incentive for adopting Industry 4.0 ready equipment, customers are already asking for connected devices. As the industry leader, SHAPE must move quickly to integrate remote monitoring and predictive maintenance to remain competitive, to set the
expectation for, and to demonstrate the utility of connectivity in the waterjet space.
Once the platform reaches a steady state where the unit alerts the user of potential issues and the system offers the user a recommendation of appropriate action, this will increase the value of customer service interactions. When customer engagements are completely manual, the number of service professionals SHAPE must hire scales proportionately with the number of machines and accounts. However, constant touchpoints are essentially free with an integrated application. Knowing about impending failures through the same alerts can help SHAPE's technicians optimize travel by proactively servicing multiple customers in the same area.
Furthermore, the engineering team can perform benchmarking from the aggregated user data. For example, it is possible to get a glimpse of how often suppliers are using the machines and whether the machines are performing to the specification that the team baselined in the labs. SHAPE will have the capability to surface manufacturing issues and recognize poorly performing lots before parts fail. SHAPE can also use the local storage and edge computing capabilities of the gateway to help the customer run diagnostics on their machine. With the owner's permission, data specific to the time of failure can be uploaded and routed to the
SHAPE support team and used to help triage and root cause the customer's issues remotely.
These activities not only help improve the customer experience, they will all add to SHAPE's learnings to aid future product development.
In summary, SHAPE should focus on building its HoT platform for maintenance at launch and extend it to additional services as guided by customer feedback.
Chapter 3
What is the best approach to
implementing a connected platform
across multiple brands?
SHAPE faces a unique challenge in that it has been formed through the acquisition of
multiple brands. For example, each of these brands have historically used their preferred supplier of programmable logic controllers ("PLC") to connect to their intensifiers. They chose their own set of sensors and sensor placements, and each has elected to capture and store a different set of tagged variables from the machine data. These independent design decisions extend to other subsystems as well, including the cutting head, reservoir tank, x-y table, abrasive hopper, and gantry system.
The benefits to homogenize the connected platform to the extent possible became clear considering all the savings. First, a single platform would require maintenance of one data hosting and processing system. Second, it would allow for sharing of a similar user interface
("UI") codebase. Third, there are economic savings due to purchasing power by scaling the
platform with common hardware and cloud services.
It is sensible to start by studying a pareto of the brands by lifetime machine sales as well as new sales to find the largest addressable markets. For SHAPE, these are the Flow and KMT brands. It is important to involve all the brands in development of the platform to ensure global compatibility and perform the limited MVP trials with these brands with the
largest install bases. Electing to pilot with the larger brands gives the project exposure to diverse use cases and operating conditions. If the pilot is successful, the platform will be near ready to launch to a large set of similar customers.
3.1
Legacy products
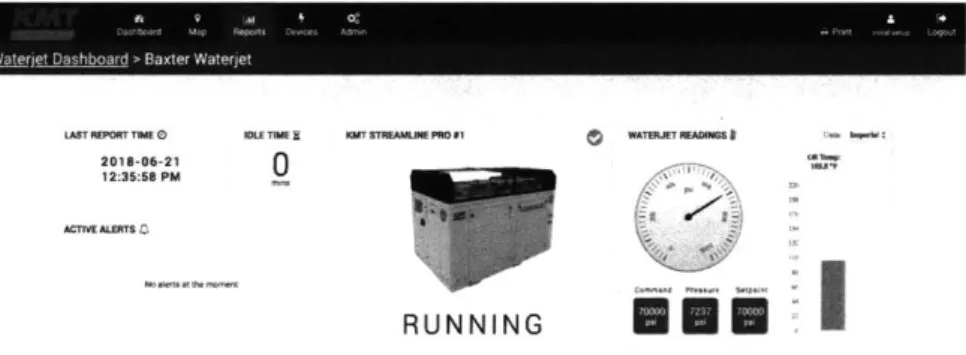
Since the legacy brands each have their own unique hardware and software architectures, it is imperative to standardize these different inputs to the extent possible before ingesting the data in the long run. Otherwise, it will be necessary to manage a different database and a separate set of algorithms for each brand. The benefits to standardization is a savings in time and in cost. However, this is not possible with legacy products without major retrofits. Since the majority of the data is collected by but not stored by the PLC, the only additional physical hardware to legacy products is a networking device, in this case an industrial gateway, to keep the retrofit strategy minimal in parts and labor (Table 3.1). All other features, data extraction, and data transformation is accomplished through software. The different brands can share the codebase for the UI, like the prototype shown in Figure 3-1.
L -- TM0E - -P n0 M
I& TSTREAhMJEPRO#1 WATENIE WADS:
RUNNING
I
Figure 3-1: There is an operational and development spending advantage to sharing a codebase to generate the UI for different products. This prototype dashboard is customized for the KMT brand.
One benefit of having all SHAPE assets and systems on one type of gateway, the networking device that manages data collection and controls data transfer, is the flexibility to add this
SKU to any of the pumps and systems in the SHAPE family of products. Data is currency
in a connected platform and employing a standardized retrofit kit across brands reduces the technical lift to extract data from the different models from the various brands. Not only
will SHAPE realize volume discounts in placing larger purchase orders for one gateway SKU, the need to only support one type of gateway will distribute the IT burden.
Starting with a bolt on gateway will allow for the possibility of retrofitting existing customer machines with HoT enabled functionalities. There are numerous physical engineering requirements for the hardware since these industrial computers will be subject to vibrations, dust from the cutting media, and potentially water in the event of a leak. It is important to select hardware that is able to connect to all the pumps and systems under SHAPE's many brands to avoid redundant work and ongoing maintenance.
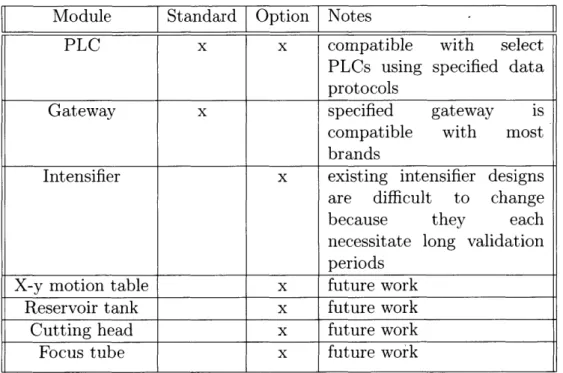
Module Standard Option Notes
PLC x x compatible with select
PLCs using specified data protocols
Gateway x specified gateway is
compatible with most
brands
Intensifier x existing intensifier designs
are difficult to change
because they each
necessitate long validation periods
X-y motion table x future work
Reservoir tank x future work
Cutting head x future work
Focus tube x future work
Table 3.1: The current state of modules and subsystems across SHAPE brands. A mark under standard indicates the module has been standardized and a mark under option indicates options customers can select for that module.
The selected gateway is about the size of the average hardcover book and can tuck inside most existing PLC enclosures, obviating the need to install an additional enclosure. The gateway is compatible with both wired connections, if the customer is able to put the asset on their local network behind a firewall, and wireless or cellular connections, if the customer cannot accommodate a wired connection or for applications in remote locations. Customers are able to perform the install themselves by following written instructions along with a software update.
3.2
Next generation products
The history of legacy products makes it evident that it is inefficient and difficult to standardize waterjet models developed independently. Going forward, it is beneficial for SHAPE to establish one global pump architecture that all brands can follow while allowing for a few hardware options in the various brands' parallel product development roadmaps. There are several areas to standardize future development.
For example, all intensifier pumps should be outfitted with the same set of standard sensors, with the option to add additional sensors, where the variables referring to the same measurement on each machine uses the same name (Table 3.2). This simplifies the data collection and processing steps.
Furthermore, PLCs used in future waterjets should all speak the same types of data transfer protocols in order to streamline the data transfer process. While it is improbable to prescribe the specific type of X-y table or reservoir tank to customers of pump brands like KMT, SHAPE can create a standard sensor add-on package that couples with most motor controllers and reservoir tanks to deliver the same HoT enabled features.
In order to learn from the units in the field and simplify ongoing future maintenance,
SHAPE must architect its connected platform to be both forwards and backwards compatible
and continuously add features based on customer feedback. Connecting assets with a
universal gateway device allows for such compatibility.
38
Table 3.2: The next generation of modules and subsystems across mark under standard indicates the module has been standardized and indicates options customers can select for that module.
SHAPE brands. A
a mark under option
Module Standard Option Notes
PLC x x limit PLC selections to a
few that are compatible with specified data transfer protocols
Gateway x specified gateway is
compatible with all brands
Intensifier x x standardized intensifier
sensors
X-y motion table x compatible with most
motor controllers
Reservoir tank x compatible with most
reservoir tanks
Cutting head x compatible with SHAPE
cutting heads
Focus tube x compatible with SHAPE
focus tubes
THIS PAGE INTENTIONALLY LEFT BLANK
Chapter 4
Supervised machine learning data
analysis
The second workstream presented in this thesis will walk through the data analysis performed on the lab pump to develop models that predict some common warnings and failures. This work adds the functionality required to bring SHAPE's connected platform into the third and fifth phases of the BSquare HoT Maturity Model (Figure 1-3). The following sections will walk through the data collection, cleaning, and analysis methodologies as summarized in Figure 4-1 followed by a comparison with unsupervised models.
4.1
Data collection
The analysis utilizes data from three sources. The first source is from the HoT POC
connectivity system set up by Evangelakos. This data includes a date and time stamp as well as 11 sensor variables and four pump health variables. The second source is from the National Instruments data acquisition ("DAQ") system which collects data from the lab pumps. This data includes a date and time stamp as well as 48 sensor variables and no pump health variables. The sensors monitored by this DAQ are different than the ones monitored
by the HoT POC, henceforth referred to as the IoT data set. The final data set comes from
the lab technicians. It is a dated log of each planned and unplanned shutdown along with the root cause of the shutdown.
Feature Engineering " Count " percent change " slope change - dfen . dropnia . clip outliers * 1j90 e ^W4. X ^Z/ 1/JN
F---
-ft
- 'I,dirty oil fiter
chedc valve overtenv
dyrwaic seal falre
overspead,
S 70i training
* 30% 'validation
a booated tree
S bayes point mchine
n feural net * togistc tegression cross validation AUC acuracy pwramneW Swo"
Figure 4-1: Overview of the supervised machine learning workflow utilizing Microsoft Azure
services. The Additional Lab DAQ Data input icon represents the combination of the
National Instruments DAQ data as well as the lab logs.
42 1 a a * e e e
The following analysis was performed on 147 days, or a little less than five months, of data from the three sources described. During the data analysis phase, concurrent work occurred to migrate the lab pump to the selected industrial gateway and build out the appropriate IT infrastructure.
4.2
Data cleaning
Each of the three raw data sources were in a different format (Tables 4.1 - 4.3). The IoT
data was in JSON. The DAQ data set was in disparate Excel files, which were automatically generated about once per day. The lab notes were stored in an Access database that could be converted to Excel. Combining all three data sets adds value by making all variables and notes available from one common database.
Time v1 v2 ... V4
YYYY-MM-DD HH:MM:SS float float ... float
Table 4.1: This is a representative format of the raw DAQ data set. Variables are denoted
by v. These variables are not the same as the IoT variables and states.
Time v1 v2 ... v si 2 ... 4
YYYY-MM-DD HH:MM:SS float float ... float string string ... string
Table 4.2: This is a representative format of the raw IoT data set. Variables are denoted by v and state conditions are denoted by s. These variables and states are not the same as the
DAQ variables and states.
Event ID Date In Date Out ... Pump ID Part ID ... Reason
float MM/DD/YY MM/DD/YY ... string string ... string
Table 4.3: This is a representative format of the raw lab data set. Some variables are suppressed for proprietary reasons.
The data cleaning was performed primarily using the pandas package in the Python programming language. Python was selected due to its open source packages, wide adoption, and compatibility with Microsoft Azure, which is SHAPE's preferred cloud provider.
![Figure 1-1: This figure from a recent OSI Soft presentation summarizes how "new maintenance strategies offer more efficient and more effective alternatives to reactive approaches." [14]](https://thumb-eu.123doks.com/thumbv2/123doknet/14732269.573274/17.917.208.698.541.792/presentation-summarizes-maintenance-strategies-efficient-effective-alternatives-approaches.webp)
![Figure 1-2: The price of sensors used in mass scale connected IoT applications have fallen by half in the recent decade.[12]](https://thumb-eu.123doks.com/thumbv2/123doknet/14732269.573274/19.917.209.700.157.433/figure-price-sensors-connected-applications-fallen-recent-decade.webp)
![Figure 1-3: This figure from the 2017 BSquare Annual HoT Maturity Survey [...] in Manufacturing, Oil and Gas, and Transportation defines five typical phases to an HoT deployment framework and relative adoption in oil and gas](https://thumb-eu.123doks.com/thumbv2/123doknet/14732269.573274/20.917.196.699.120.379/bsquare-maturity-manufacturing-transportation-deployment-framework-relative-adoption.webp)
![Table 1.1: These are the major similarities and differences between waterjet technology and that of its subtractive manufacturing peers.[3]](https://thumb-eu.123doks.com/thumbv2/123doknet/14732269.573274/22.918.128.755.96.479/table-major-similarities-differences-waterjet-technology-subtractive-manufacturing.webp)
![Figure 2-1: The top sources of revenue growth from IoT enabled systems.[8]](https://thumb-eu.123doks.com/thumbv2/123doknet/14732269.573274/32.917.217.700.381.590/figure-sources-revenue-growth-iot-enabled-systems.webp)