The Design, Development, and Analysis of a
Wearable, Multi-modal Information Presentation
Device to Aid Astronauts in Obstacle Avoidance
During Surface Exploration
by
Alison Eve Gibson
Submitted to the Department of Aeronautics and Astronautics in partial fulfillment of the requirements for the degree of
Master of Science in Aeronautics and Astronautics
at the
MASSACHUSETTS INSTITUTE OF TECHNOLOGY June 2017
@
Massachusetts Institute of Technology 2017. All rights reserved.A uthor ...
Signature redacted
Department of Aeronautics and Astronautics
May 1, 2017
Certified by...
Signature redacted
w
Leia Stirling
Assistant Professor of Aeronautics and Astronautics
Thesis Supervisor
Accepted by ... MASSACHUSETTS INSTITUTE OF TECHNOLOGYSEP 27 2017
LIBRARIES
Signature redacted
X7Youssef M. Marzouk
Assistant Professor of Aeronautics and Astronautics
Chair, Graduate Program Committee
The Design, Development, and Analysis of a Wearable,
Multi-modal Information Presentation Device to Aid
Astronauts in Obstacle Avoidance During Surface Exploration
by
Alison Eve Gibson
Submitted to the Department of Aeronautics and Astronautics on May 1, 2017, in partial fulfillment of the
requirements for the degree of
Master of Science in Aeronautics and Astronautics
Abstract
The future of human space exploration will involve extra-vehicular activities (EVA) on foreign planetary surfaces (i.e. Mars), an activity that will have significantly different char-acteristics than exploration scenarios on Earth. These activities become challenging due to restricted vision and limitations placed on sensory feedback from altered gravity and the space suit. The use of a bulky, pressurized EVA suit perceptually disconnects human explorers from the hostile environment, increasing navigation workload and risk of colli-sion associated with traversing through unfamiliar terrain. Due to the hazardous nature of this work, there is a critical need to design interfaces for optimizing task performance and minimizing risks; in particular, an information presentation device that can aid in obstacle avoidance during surface exploration and way-finding. Multi-modal displays are being con-sidered as cues to multiple sensory modalities enhance cognitive processing through taking advantage of multiple sensory resources, and are believed to communicate risk more effi-ciently than unimodal cues. This thesis presents a wearable multi-modal interface system to examine human performance when visual, vibratory, and visual-vibratory cues are pro-vided to aid in ground obstacle avoidance. The wearable system applies vibrotactile cues to the feet and visual cues through augmented reality glasses to convey obstacle location and proximity. An analysis of obstacle avoidance performance with the multi-modal device was performed with human subjects in a motion capture space. Metrics included completion time, subjective workload, head-down time, collisions, as well as gait parameters. The pri-mary measures of performance were collision frequency and head-down time, as these both must be minimized in an operational environment. Results indicate that information dis-plays enhance task performance, with the visual-only display promoting the least head-down time over tactile-only or visual-tactile displays. Head-down time was the highest for trials without a display. Results provide implications for presenting information during physically active tasks such as suited obstacle avoidance.
Thesis Supervisor: Leia Stirling
Acknowledgments
This work was supported through graduate research fellowships from the National Science Foundation and Draper. The author would like to thank her research advisors Dr. Leia Stirling (MIT) and Dr. Andrea Webb (Draper) for their help and guidance throughout the project. The author would also like to thank and recognize MIT undergraduate students Bradley Jomard and Charlotte Sun for their assistance in data collection and post-processing.
Contents
1 Introduction
1.1 Future Manned Missions to Mars . . . 1.2 Multi-Modal Information Presentation
1.2.1 Vibrotactile Displays . . . . 1.3 Human Obstacle Avoidance Strategy 1.4 Project Objectives and Hypotheses .
2 Examination of Vibrotactile Perception Thresholds 2.1 Experimental Methods . . . . 2.1.1 Participants . . . . 2.1.2 M aterials . . . . 2.1.3 Experimental Protocol . . . . 2.1.4 Statistical Methods . . . . 2.2 R esults . . . . 2.2.1 Perceived Location Accuracy . . . . 2.2.2 Perceived Type Accuracy . . . .
2.2.3 Undetected Vibrations . . . .
2.3 D iscussion . . . . 2.4 Implications for Vibrotactile Displays . . . . 3 Design of the Multi-modal Interface Device
3.1 Display Cue Logic . . . . 3.2 Hardware Design and Development . . . .
of the Feet 15 15 17 19 22 23 27 28 28 28 29 31 32 32 34 36 37 40 43 44 45
3.3 Algorithm s . . . . 3.4 Augmented Reality Glasses . . . . 3.5 Summary and Limitations . . . . 4 Analysis of the Multi-modal Interface Device
4.1 Experimental Methods . . . . . 4.1.1 Participants . . . . 4.1.2 Experimental Protocol . 4.1.3 Data Processing . . . . . 4.1.4 Statistical Methods . . . 4.2 Results. . . . . 4.2.1 Subjective Measures . . 4.2.2 Motion Capture Metrics 4.3 Discussion . . . . 5 Conclusions
5.1 Implications for Multi-Modal Information
5.1.1 Astronauts . . . . 5.1.2 Other Applications . . . . 5.1.3 Takeaways . . . . 5.2 Limitations . . . . 5.3 Future Work . . . . 5.4 Research Contributions . . . . Presentation Devices A Additional Data B Computer Code
B.1 Vibration Perception Study Arduino UNO C Code . . . . B.2 Vibration Perception Study Python GUI Code . . . . B.3 Vibrotactile Boot Edison Wi-Fi C Code . . . . B.4 Vibrotactile Boot Arduino UNO C Code . . . . B.5 MATLAB Post-Processing Code . . . .
48 50 51 53 54 . . . . 54 . . . . 54 . . . . 57 . . . . 59 . . . . 61 . . . . 61 . . . . 65 . . . . 74 83 86 86 87 88 88 90 91 93 97 97 101 112 116 127
List of Figures
2-1 Fritzing diagram of haptic display and electrical connections
12C SCL (green),
12C SDA (yellow), power (red), ground
(black), and digital outputs (pink) . . . . 30 2-2 Example participant wearing the experimental device and
op-erating the G U I . . . . 31 2-3 Average perceived Location Accuracy and standard error for
each foot and attention state (pooled across Type and Order) 33
2-4 Perceived vibration Type Accuracy mean and standard error for each Location, Type, and Foot (pooled across Attention) 35 2-5 Percentage of undetected vibrations for each subject and
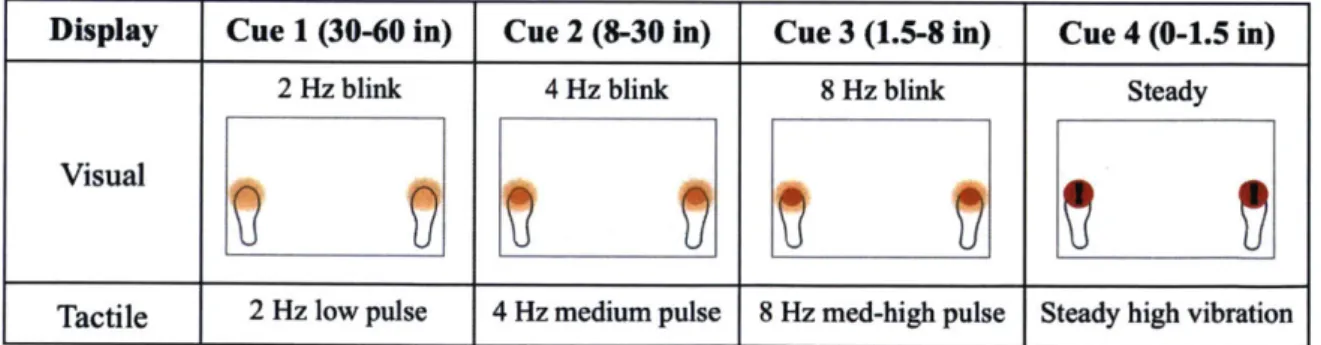
vi-bration Location . . . . 37 3-1 Display cue characteristics for each level and modality . . . . 44
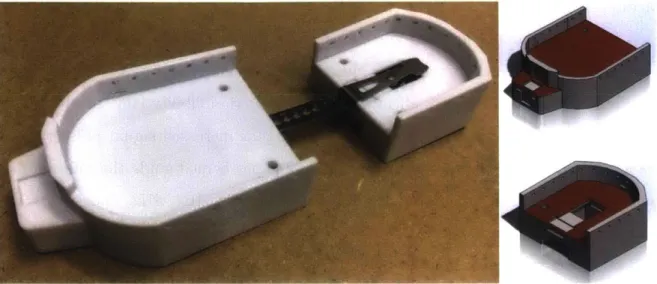
3-2 The vibrotactile boot base assembly (left) and CAD models of the 3D-printed front base (top right) and back base (bottom rig h t) . . . . 46
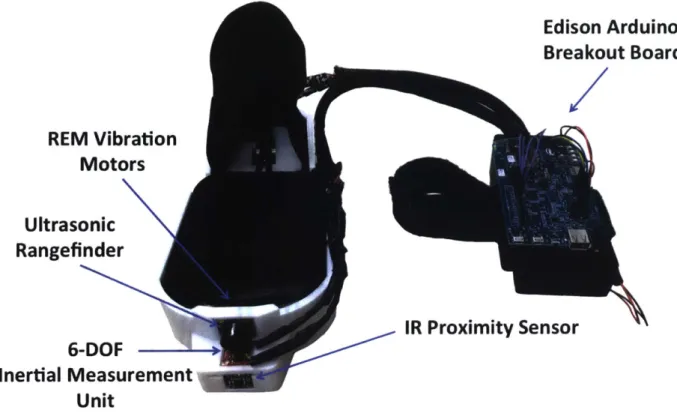
3-3 The vibrotactile boot and integrated electronics . . . . 47
3-4 Fritzing diagram of electrical connections for the vibrotac-tile boot, showing connections for I2C SCL (green), I2C SDA
(yellow), power (red), ground (black), digital outputs (pink), analog input (blue), and serial RX/TX (grey). Connectors are not show n. . . . . 48
3-6 A participant wearing the augmented Epson Moverio BT-200 Smart Glasses with attached shields ... 51
4-1 The obstacle blocks with retroreflective markers ... 55 4-2 An example user wearing the multi-modal display (left) and
the motion capture layout (right) with obstacle (OB) and associated starting point locations for experimental trials (1-3) and training trials (T1-T4). Each square in the grid is approximately 23x23 inches. . . . . 56 4-3 The initial head-level state Ho for each participant based on
initial position marker readings (left) and the geometry show-ing the head-down angle measurement H (right) . . . . 58 4-4 NASA TLX Overall Workload scores for all sixteen subjects
and display conditions . . . . 61 4-5 NASA TLX Workload averages for all workload types and
display conditions . . . . 62 4-6 NASA TLX Workload scores for mental and temporal
work-load types, where shapes denote significance groupings. Black circles represent overall mean and standard deviation while grey circles represent individual participant means. . . . . 62
4-7 Post-Experiment Survey workload rankings (Scale of 1-5 in-creasing with workload), where shapes denote significance groupings. Black circles represent overall mean and standard deviation while grey circles represent individual participant m ean s. . . . . 64 4-8 Histogram data of participant responses to display preferences 65
4-9 Normalized Completion Time for all display conditions, where shapes denote significance groupings. Black circles represent overall mean and standard deviation while grey circles repre-sent individual participant means (pooled across Order, Lo-cation, Size, and Sex). . . . . 67
4-10 Head-Down Percentage of Trial for all display conditions, where shapes denote significance groupings. Black circles rep-resent overall mean and standard deviation while grey circles represent individual participant means (pooled across Order, Location, Size, and Sex). . . . . 68
4-11 Toe Clearance and Toe-Off Distance for all display conditions,
where shapes denote significance groupings. Black circles rep-resent overall mean and standard deviation while grey circles represent individual participant means (pooled across Order, Location, Size, and Sex). . . . . 70
4-12 Step characteristics for all display conditions, where shapes denote significance groupings. Black circles represent over-all mean and standard deviation while grey circles represent individual participant means (pooled across Order, Location, Size, and Sex). . . . . 72 A-i Normalized Completion Time for all sixteen subjects and
dis-play conditions . . . . 96 A-2 Head-Down Percentage of Trial for all sixteen subjects and
List of Tables
2.1 Non-parametric tests used to determine effects of independent variables on non-spherical dependent variables . . . . 32 2.2 Statistics from a Friedman test on the effect of Vibration Location
on Perceived Vibration Location Accuracy (pooled across Attention, Type, Order, and Foot) . . . . 33 2.3 Statistics from Wilcoxon Signed Rank and Rank Sum tests on the
effects of Attention and Order on Perceived Vibration Type Accuracy (pooled across Location, Type, and Foot) . . . . 34 2.4 Statistics from a Friedman test on the effect of Vibration Type on
Per-ceived Vibration Type Accuracy (pooled across Attention, Location, O rder, and Foot) . . . . 35 2.5 Statistics from a Friedman test on the interaction of Foot*Location on
Perceived Vibration Type Accuracy (pooled across Attention, Type, and O rder) . . . . 36 2.6 Percentages of undetected vibrations across all trials and participants.
All dashed cells and cells not shown have zero undetected responses for those trials. . . . . 36 4.1 Non-parametric tests used to determine effects of select independent
variables on non-spherical motion capture metrics . . . . 60
4.2 Statistics from Friedman tests on the effect of display (d.f.=3) on
NASA TLX Workload Scores, where asterisks denote significant p-values 63 4.3 Statistics from a Friedman test on Survey Workload scores . . . . 63
4.4 Statistical results from a Friedman test on display preference rankings 64 4.5 Significant effects on Normalized Completion Time . . . . 66 4.6 Significant effects on Head-Down Percentage of Trial . . . . 68 4.7 Statistics from a Friedman test on the effect of Display on Toe Clearance 69 4.8 Statistics from a Friedman test on the effect of Display on Toe-Off
D istance . . . . 70 4.9 Statistics from a Friedman test on the effect of Display on Number of
Steps... ... 71
4.10 Statistics from a Friedman test on the effect of Display on Normalized Average Step Length . . . . 71 4.11 Statistics from a Friedman test on the effect of Display on Normalized
Step Length Variance . . . . 71 4.12 Statistics from Wilcoxon Rank Sum tests on the effect of Order on step
characteristics . . . . 73 4.13 Statistics from Wilcoxon Signed Rank tests on the effect of Size on
step characteristics . . . . 73 4.14 Percentage of trials with a leading right foot for each Display and Order
level . . . . 74 4.15 Contingency Table for obstacle Size and Collision frequency with
(ex-pected cell total) and [chi-square statistic] for each cell . . . . 74 A. 1 Contingency table containing frequency data for lead foot between TO
and VT displays . . . . 93 A.2 Contingency table containing frequency data for lead foot between TO
and NC displays . . . . 93 A.3 Repeated Measures ANOVA table for Normalized Completion Time,
where asterisks denote significant p-values . . . . 94 A.4 Repeated Measures ANOVA table for Head-Down Percentage of Trial,
Chapter 1
Introduction
1.1
Future Manned Missions to Mars
Future manned missions to Mars and the Moon are projected to involve space and surface operations that impose much higher risk and workload on astronauts than sim-ilar activities on Earth; the most complex of these operations involve Extra-Vehicular Activity (EVA), which occurs when astronauts exit the protected environment of the spacecraft and enter the vacuum of space or the thin atmosphere of another planet while wearing a bulky, pressurized spacesuit
11].
These activities are challenging due to the perceptual restrictions placed on somatosensory and proprioceptive feedback from altered gravity and the pressurized suit, visual restrictions from the helmet, and the absence of auditory information from the environment12].
Somatosensory feedback involves physical sensations such as pressure, pain, or temperature, and pro-prioceptive feedback involves the kinaesthetic sense of limb position, orientation, and movement. Surface EVA operations on Mars will include assembly and construction of structures, geologic exploration, and protective shelter excavation[1].
These activ-ities come with serious risk of injury or damage to imperative life-support equipment since trips and falls are likely to occur on unfamiliar, rocky terrain.As if the task of locomoting while wearing a bulky spacesuit in a different gravito-inertial environment is not already difficult for a healthy person, the six to twelve month trip to Mars could cause physiological changes to astronauts that further
in-crease task difficulty. Long-duration spaceflight has various detrimental effects on the human body, including muscoskeletal deconditioning
[3,
4, 5] and sensorimotor system alterations that affect locomotor function 16, 7, 8, 9]. These studies sug-gest that changes in locomotion post-flight include impaired multi-joint coordina-tion, increased sway, decreased postural control, decreased head-trunk coordinacoordina-tion, decreased agility, and impaired neuromuscular activation of lower limbs. Addition-ally, studies show that sensorimotor adaptation to microgravity environments and the resultant visual-vestibular reweighting alters static and dynamic balance stability during locomotion [9, 8, 10, 11]. Peters et al. [12] suggests that long-duration space-flight modifies dynamic visual acuity and gaze stabilization due to alterations in the vestibular-ocular reflex (VOR). Additionally, researchers have found that head-trunk coordination is modified during walking and obstacle avoidance post-flight[131
and there is an increased risk of tripping due to changes in gait (i.e. less toe clearance) after returning to Earth[14].
Since astronauts's bodies will likely be affected in these ways while in transit to Mars, the task of planetary exploration after landing on Mars becomes even more precarious.Falls on the moon throughout the Apollo missions were common due to the al-tered human locomotion from the pressurized suit and reduced gravity. There is approximately twice as much gravity on Mars compared to the moon and the Mar-tian terrain is far less forgiving. An unanticipated fall could puncture or damage critical life-support equipment, risking astronaut safety and mission timelines. Due to the physically demanding nature of suited surface exploration in combination with restricted time, resources, and perceptual capabilities of crewmembers, a critical need has been identified to design interfaces for supporting task performance and minimiz-ing hazards durminimiz-ing operations
[1].
The information necessary to efficently carry out a surface EVA extends far beyond what can be directly seen and felt through the suit, so presenting useful and relevant information to astronauts via displays could improve terrain traversal performance and safety. Of particular interest is the devel-opment of a multi-modal information presentation device to aid in the task of obstacle avoidance during surface exploration and way-finding. The term multi-modal is usedto describe information that is displayed over multiple input modalities, typically considering visual, auditory, and/or tactile displays. To assist astronauts in safely traversing to another crewmember, station, or rover while navigating through rugged terrain, multi-modal interfaces must be assessed to understand how the presentation of information affects cognitive function and operational performance [15].
1.2
Multi-Modal Information Presentation
One of the major challenges in the field of Human Factors is in understanding how to present critical information in the most efficient way possible while minimizing workload and distraction. An increasingly popular method for improving informa-tion delivery is the use of multisensory devices [16]. These devices present information to the user via multiple sensory modalities in order to support quick and robust in-terpretation through sensory reinforcement. The idea of presenting information to multiple modalities to improve task performance and information processing was first presented by Navon and Gopher in 1979 [17]. Research on this topic provoked the development of Wickens' Multiple Resource Theory (MRT) [18], which asserts that there are multiple pools of attentional resources that are drawn from to perform a task, including resources allocated to sensory input stages, cognitive processing, and response selection. MRT asserts an existence of dissimilar cognitive resources for processing sensory information from different modalities, implying that cognitive workload may be reduced through distributing information across different sensory modalities. Van Erp et al. [191 suggests that this distribution of information across other modalities offloads the often overworked visual channel, reducing cognitive pro-cessing efforts required for effective task performance. Rather than consider the per-spective of interference within the processing stages due to information coming from
various input modalities, multi-modal displays follow MRT through considering the
enhancement of processing due to synergistic information coming from the different attentional input resources. As a result, the hypothesis is that multi-modal infor-mation presentation could induce more robust inforinfor-mation processing and improve
task performance, particularly in circumstances when the primary modality (usually vision) is overloaded.
Support for the benefits of multi-modal information presentation was first shown in several studies that distributed concurrent tasks across both the visual and audi-tory modalities, showing performance benefits for presenting redundant information as well as complementary information [18]. These results have made visual-audial displays a popular choice for decades. However, studies have more recently shown performance benefits of adding tactile cues to visual cues, a combination that is shown to result in faster reaction times than visual cues alone in simulation experiments of operator performance, decision-making, and alert recognition
[20,
21, 22, 231. Three meta-analyses of multi-modal cues for task interruption (i.e. combinations of audi-tory, visual, and tactile stimuli) showed faster response time and improved response accuracy for displays involving tactile warnings compared to those with auditory warnings[241.
While this makes tactile cues an appropriate choice for alarms and alerts, the addition of tactile cues to visual cues has also been shown to enhance operator performance in studies simulating more complex tasks such as communi-cations, driving, land navigation, teleoperation in virtual reality environments, and spatial orientation in flight [16]. An important factor in increasing multi-sensory in-tegration is spatio-temporal and/or semantic congruency, referring to display logic where redundant information is given across the different sensory channels. A study utilizing a tactile belt and visual display to present five standard military arm and hand signals demonstrated slower response times when the visual-tactile cues were incongruent (i.e. in different directions or mismatching information)[251.
A review of multiple studies utilizing visual-tactile cues to improve cognitive performance across various domains also suggested support for the benefit of information congruency, as redundant cues improved response speed and accuracy while conflicting cues were distracting to users and induced response error1261.
Multi-modal alerts and threat warnings are also shown to enhance perception of risk more efficiently than unimodal cues. One study [27] used a tactile torso belt to apply unique vibrations corresponding to the direction (i.e. front, back, right, or left)
of a threat during combat simulation; results showed that response time was reduced and threat detection precision increased when either the tactile cues or 3D audio cues were presented along with visual cues. Another study examined unimodal, bi-modal, and tri-modal alerts incorporating vibrotactile, audial, and visual signals, and found that bi-modal and tri-modal cues were perceived as more urgent than unimodal cues
128].
A review of displays utilizing multi-modal alerts and warnings also found support for the notion that multi-modal cues are more effective in conveying risk[19].
1.2.1
Vibrotactile Displays
The auditory system and associated cognitive pathways have a sophisticated ability in translating sound sensation to meaning (e.g. language) and learning new informa-tion mappings. However, the use of tactile channels for informainforma-tion mapping has not been characterized as thoroughly, and could be of great use in intuitively conveying alerts about surface features, inclination, and obstacles in a path. Other advantages of tactile cues include its omnidirectionality (i.e. signal salience regardless of spatial orientation and attentional load), ability to be perceived simultaneously with visual and auditory signals, and the small number of competing demands for this resource [23]. The auditory channel has the potential to be highly loaded during EVA op-erations due to radio communication protocols, so the addition of tactile cues may be a more appropriate design choice in this operational scenario. Elliot et al. [16] points out that many studies have demonstrated tactile cue success for waypoint land navigation, especially during low visibility conditions or when attention was focused on surrounding ground terrain. It has been hypothesized that tactile information can complement or replace other senses when interference is present in the primary modality (e.g. glares on visual displays or limited range of view) [26]. Additionally, studies utilizing a tactile display on the torso for direction commands and spatial orientation assistance have demonstrated faster reaction times, improved situation awareness, and increased stability during navigation tasks that burden the visual channel compared to using visual cues alone
[29].
that the placement of tactors correspond with task demands [16]. As a result, it's hypothesized that tactile presentation to the front of the feet may be most intuitive and task-relevant during surface obstacle avoidance. Cutaneous afferent inputs from the feet during walking are naturally involved in reflexes that alter swing limb tra-jectory to avoid stumbling and falling [301, but this feedback is mostly unavailable to the perceptually impoverished astronaut during an EVA. Since vibrotactile displays on the feet are uncommon, there is a need to better understand applications of tactile cues to the feet individually and in combination with other modalities. Vibrotactile displays for alerts, bodypart orientation, and directional navigation tasks have been used to guide successful task performance on the arms [31, 32, 33, 34, 35, 361, shoulder [37], and waist [38, 39, 40, 41, 42]; the tactile cues in these studies ranged from single vibratory alerts to multiple location and vibration patterns, conveying information such as navigation direction (up to four directions), position targeting, trajectory following, forearm rotation, arm/hand gestures, and joint angle errors for body ori-entation corrections. In all cases, no more than 5-10 unique vibratory signals were used. One of the studies used a vibrotactile bracelet to guide forearm orientation, and found higher accuracy in visuotactile-guided trajectories compared to visually-guided
trajectories
[321.
While the arms, shoulder, and waist have shown successful vibrotactile detection and comprehension for various tasks, there have been very few applications specifically utilizing the feet. One study successfully demonstrated the ability of a sandal-like vibration interface to promote and maintain a specific walking pace through mapping vibration pulse rate to a predetermined step rate [43]. Another study used vibrat-ing toe rvibrat-ings to signal direction changes while walkvibrat-ing towards a preset destination, where the toe ring on the right or left foot would vibrate to indicate a turn in the corresponding direction
[441.
Other navigation studies have used vibrotactile signals to command direction changes (right/left) or inform approximate distances to a des-tination, but none have tried to convey detailed information about small obstacles directly in one's walking path, which may require increased information presentation on this sensory channel. The task of active obstacle avoidance presents differentchal-lenges than those in simple navigation since different information would be needed; task-relevant information may include the distance to obstacle(s), location of obsta-cle(s), and size of obstacle(s). Additionally, different information would be required for different strategies (e.g. stepping over an obstacle versus walking around it). To narrow the scope of this problem, the current body of work focuses on information display for the strategy of approaching and stepping over an obstacle. Stepping over an object is believed to be more challenging than walking around an object, as suc-cessful obstacle avoidance requires real-time visual recognition of foot placement in the approach phase
[45].
Since advanced haptic technologies have emerged only in the last decade and their applications in mapping information to human feet in particular are not well stud-ied, it isn't clear what kind of information mapping characteristics (i.e. vibration frequencies, patterns, or locations) would be best to support robust cue salience. Factors that affect vibration perception include signal features (e.g. frequency, du-ration, and temporal/ spatial distance) as well as individual factors such as gender and age [46]. Regarding frequency, a feature that determines intensity, vibrations ranging from 50 to 300 Hz have been found to be the most detectable on the skin [471. Although, most vibration perception research has examined detection thresh-olds for the fingers, hands, and torso, while little research has been done specifically with the feet. Some studies have assessed vibration perception at the sole of the foot [48, 49, 50] and top of the foot [46, 51], supporting detection capabilities within the 20 to 250 Hz range. These findings support the notion that the sensory systems of the feet enable sufficient vibrotactile perception, although research has not examined perception thresholds at the locations of interest for the multi-modal device (i.e. the front, back, lateral, and medial sides of the foot).
Before vibrotactile signals can be implemented in a multi-modal navigational aid, it is necessary to first understand the tactile perception capabilities of the feet for the locations and signal types under consideration, in particular during states of divided attention. The detection and comprehension of the vibrotactile signals must be robust enough to withstand various cognitive and perceptual loads since the practical use
of such an interface would undoubtedly occur while the user is multi-tasking. Load theory
[52,
53, 54] suggests that perceptual and cognitive demands (or loads) each have a limited capacity beyond which selective attention can fail, negatively affecting sensory perception and cognitive performance. Fitousi and Wenger155]
emphasize that most modern research attributes failures in attention and task performance to overloaded sensory channels and/or overloaded cognitive resources. A reduction in perceptual and attentional capacity can also take place during excessive workload; this phenomenon is referred to as attentional narrowing, and is characterized by an involuntary reduction in the range of cues able to be perceived by an individual156].
In the case of an astronaut under high cognitive and visual load from multi-tasking while navigating unknown terrain, it is therefore imperative that the vibrotactile stimuli carrying critical information be salient enough to enable adequate perception and comprehension during narrowed attentional focus. This need for cue salience also justifies the consideration of a multi-modal interface, as inputs to multiple sensory modalities increase the likelihood of cue perception and comprehension; if one modal-ity is overloaded and perceptually narrowed, other modalities are still able to receive the information.1.3
Human Obstacle Avoidance Strategy
While performing an EVA, astronauts wear a helmet that occludes regions of the field of view. Obstacle avoidance studies have previously shown that when the lower visual field is restricted with basketball goggles and obstacle position cues in the environment are provided (i.e. vertical poles next to the obstacle), foot placement before the obstacle returns to the optimal values seen for full vision conditions [57, 58]. This phenomenon suggests that visual information of obstacle location relative to the self compensated for the loss of visual information about lower limb movement. Several obstacle avoidance studies examining the visual control of foot placement have shown that people need these cues about an approaching obstacle within at least two steps prior to the obstacle in order to maintain balance and avoid collisions. Some
of these studies used an eye tracker mounted on the head to determine gaze fixation throughout obstacle avoidance tasks, and found that people fixate their gaze two steps ahead on average [59, 60]. Other studies demonstrated that removing obstacle information within two steps distance did not affect foot placement or strategy [61, 45, 62, 63]. Obstacle avoidance studies have also confirmed that high failure rates in avoiding obstacles are not caused by inappropriate limb elevation, but incorrect foot placement before the obstacle [45, 64]. While general target location is important during approach, research by Rietdyk et al.
[58]
demonstrated that for a single-foot targeting task, the foot-relative-to-target information was more important than the absolute target-location in the environment. These results can provide guidance on the development of multi-modal displays for obstacle avoidance and suggest that cues provided at least two steps prior to an oncoming obstacle would aid participants in stepping over obstacles while minimizing head down time. It is expected that surface mission operations will involve tasks that require one to keep most of their attention on features ahead (e.g. following a rover, walking to another crewmember or structure, etc.), so it would be beneficial if one could do so without having to continuously divert their focus to the ground to avoid tripping over unanticipated objects. As a result, it was determined that obstacle proximity to the front of the foot would be the most relevant information to present during obstacle avoidance tasks with limited lower vision.1.4
Project Objectives and Hypotheses
The primary objective of the current work was to examine the effectiveness of a visual-tactile display for a surface obstacle avoidance scenario similar to what astronauts may encounter during future missions to Mars. This was accomplished through exper-imentally evaluating the differences in obstacle avoidance performance and workload during use of unimodal information displays (visual only and tactile only), a multi-modal information display (visual-tactile combination), and no display. In order to carry out the experiments, a multi-modal information presentation device capable of
providing meaningful input to both the visual and tactile modalities was designed and developed. Since vibrotactile displays for the feet are uncommon, a preliminary study evaluating the vibrotactile perception capabilities of the feet was performed in order to guide adequate design of the tactile information mapping for the device. The body of work in this thesis presents results from the vibrotactile perception study (Chapter 2), the design and development of the multi-modal interface device (Chap-ter 3), and results from an analysis of obstacle avoidance performance across different information display conditions (Chapter 4).
Aside from obstacle collision frequency, the most operationally relevant measure of performance for this study was head-down time, where less head-down time was associated with better task performance, as the task priorities consisted of 1) avoiding contact with an obstacle and 2) reducing head-down time. These priorities were relevant to the operational scenario of interest (a suited astronaut navigating rocky terrain on Mars) since astronauts will need to keep their attention and focus on completing EVA tasks as opposed to keeping their focus on the ground. For the vibration perception study, the hypotheses were that attention could alter perception accuracy, and that certain vibration locations and signal properties may enable better perception accuracy than others. For the obstacle avoidance study with the multi-modal device, the main hypothesis was that real-time obstacle proximity information could enable visually-restricted individuals to avoid obstacles without continuously looking down at the ground. The presentation of cues beyond two steps distance to an obstacle and during approach could alter the gait accordingly and guide optimal foot placement before step-over. It was also hypothesized that the use of multi-modal cues (i.e. visual-tactile) might result in better obstacle avoidance performance compared to unimodal (i.e. tactile only or visual only) cues.
Experiment 1: Vibrotactile Perception of the Feet
* H1A: Attentional loads may negatively affect vibration perception accuracy " H1B: Specific locations on the foot may promote better vibration perception
* H10 : Specific types of vibration signals may be more perceivable than others
Experiment 2: Analysis of the Multi-modal Information Device on Obsta-cle Avoidance Performance
" H2A: Real-time obstacle location and proximity cues can decrease head-down time during obstacle avoidance
" H2B: Multi-modal cues may decrease head-down time more than unimodal cues during obstacle avoidance
" H2c: Real-time obstacle location and proximity cues may alter the gait strategy during obstacle avoidance
Chapter 2
Examination of Vibrotactile
Perception Thresholds of the Feet
Before the vibrotactile display could be implemented on novel locations of the foot, it was necessary to first understand the tactile perception capabilities of the feet for the locations and signal types under consideration, in particular during states of divided attention. The detection of the perceived tactile signal must be robust enough to withstand various cognitive and perceptual loads since the practical use of such an interface would undoubtedly occur while the user is multi-tasking. In order to better understand how to incorporate tactile signals for robust signal detection in the mul-timodal interface device, this study examined four types of vibrations at six different locations per foot under varying attention loads. Independent variables consisted of vibration signal Type (High, Low, Increase, Decrease), Location (1-6), Attention state (Focused or Distracted), Foot (Right or Left) and Order of attention condition assignment. The dependent variables were perceived Location Accuracy (ability to detect vibration at a specific location), and perceived vibration Type Accuracy (abil-ity to detect the type of vibration signal). It was hypothesized that attentional load would negatively affect perception accuracy due to attentional narrowing, and that certain locations and vibration types may be more detectable than others.
2.1
Experimental Methods
2.1.1
Participants
The participants consisted of ten healthy adults (3 females, 7 males) between the ages of 19 and 27 (M=23.3, SD=2.4). The experimental protocol was approved by the MIT Committee on the Use of Humans as Experimental Subjects (COUHES) and all participants provided written consent. Participants were excluded from the study if they reported irregularity or abnormalities with tactile perception on the feet or any injuries to the lower extremities. All participants were compensated with $20 USD. Participants were mostly right-handed (8 of 10), while one was left-handed and one was ambidextrous.
2.1.2
Materials
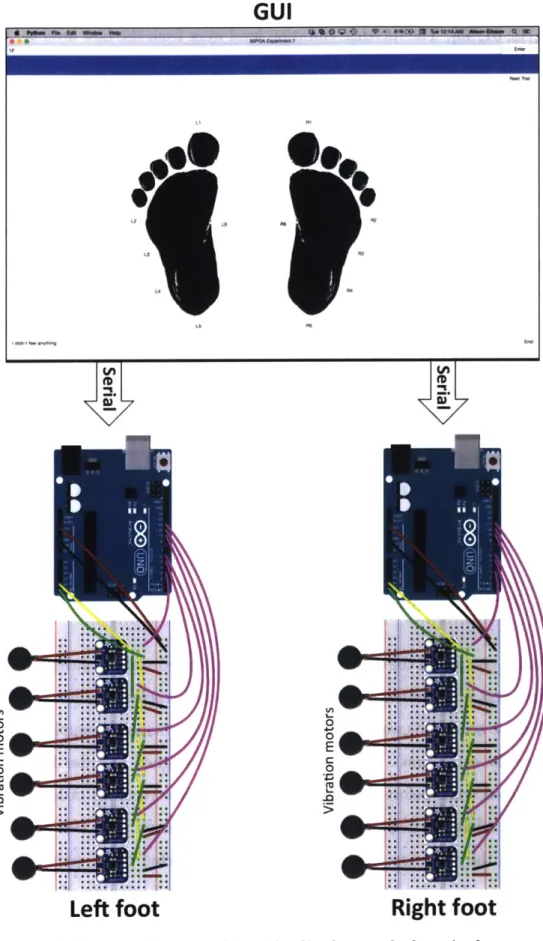
A custom haptic display was developed that applied four kinds of vibrations at six locations on each foot: one on the tip of the big toe, three on the lateral side, one on the back of the heel, and one in the center of the medial side of the foot (Fig. 2-1). Locations on the perimeter of the foot were selected as they provided regions where obstacle contact may occur and would be intuitive in conveying obstacle proximity to the foot. While little is known about the perceptual characteristics on the front of the big toe (Location 1), heel (Location 5), and medial part of the foot (Location 6), it's been suggested that cutaneous reflexes from stimulation of the sural nerve (lateral side of foot, Locations 2-4) during walking stabilize gait against perturbations from uneven terrain or obstacle collision 165]. Additionally, the lateral side of the foot would likely encounter more obstacles compared to the medial side, so half of the locations were assigned here. Vibrations were created by small haptic motors (Vibrating Mini Motor Disc, Adafruit, New York City, NY) of 10mm diameter and 2.7mm thickness. All vibrations were 1.5 seconds in duration and consisted of one of the four vibration levels at an amplitude of roughly 0.8-1.2g: High (11000 RPM), Low (2750 RPM), Increase and Decrease. This amplitude and frequency range is typical
for vibrotactile displays, including the few that have been applied to different parts of the foot [48, 51, 49]. The Increase vibration level went from the Low level to the High level and the Decrease vibration level did the opposite. Each of the haptic motors were controlled by an individual driver board (DRV2605, Texas Instruments, Dallas, TX), and all driver boards for the same foot were connected in series through a digital 12
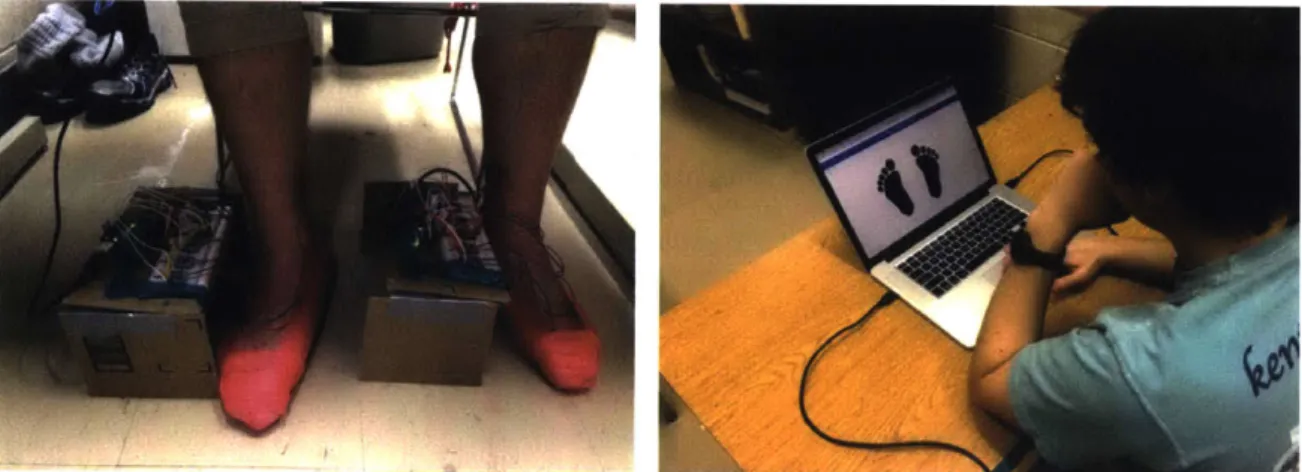
C line. The driver boards received input in the form of a Pulse Width Modulation (PWM) signal from the digital output pins on a microcontroller (Arduino UNO, Arduino, Massimo, Italy). The High vibration level had a 100% duty cyle at 5V while the Low vibration level had a 25% duty cycle at 5V. The haptic motors were placed on participants' feet with double-sided tape and reinforced with athletic wrap for the duration of the experiment (Fig. 2-2). Participants used a custom graphical user interface (GUI) to complete the experiment, (Fig. 2-1), which commanded the motors via serial ports and recorded participant responses for each trial. The buttons around the foot icons on the GUI were for vibration location responses, while the buttons on the right side were for vibration type responses. The Python code for the GUI and the C code for the microcontroller algorithm can be found in Appendix A.
2.1.3
Experimental Protocol
Participants completed the experiment while in a focused state of attention (Focused condition) and in a distracted state of attention (Distracted condition), where the order of these conditions were counterbalanced (i.e. participants completed the trials for one or the other first). Participants randomly assigned to order DF performed the Distracted trials before the Focused trials, and vice versa for order FD. During the Focused trials, participants were instructed to focus on their feet and pay close attention to the vibration sensations. For the Distracted trials, participants were presented a random number between 0 and 100 at the beginning of each trial and instructed to count up from that number in increments of three until they felt the vibration.
IGU
0 FOL.i4.
--Left foot
0 4a 0 E 0 'r.. O4
: t::-o ..t. .A.O:Right foot
Figure 2-1: Fritzing diagram of haptic display and electrical connections
12C SCL (green), 12C SDA (yellow), power (red), ground (black), and
digital outputs (pink)
ED a' 0 0 E C 0
a
i
Four different vibration levels for six different locations per foot resulted in 48 unique vibration combinations, and participants experienced each combination for six trials during each attention condition, totaling to 576 trials overall. The 288 trials for each attention condition (Focused or Distracted) were randomized in a pre-determined order. The numbers used in the Distracted trials were the same for all participants to maintain the total difficulty of each trial (e.g. some numbers may be harder to count up from). To ensure that participants could not predict when the vibration would occur during each trial, each vibration took place at a random point in time between 2-7 seconds after pressing the "Next Trial" button on the GUI. Once a vibration was felt, participants selected the location on the foot where they perceived the vibration and then selected the type of vibration felt. Each response was recorded and deemed correct or incorrect, but participants did not receive this feedback. If a participant did not perceive a vibration, they were instructed to select a button labeled "I didn't feel it", and that trial's response was recorded as undetected.
Figure 2-2: Example participant wearing the experimental device and operating the GUI
2.1.4
Statistical Methods
Independent variables consisted of Attention (Focused, Distracted), Order (FD or DF), Type (High, Low, Increase, Decrease), Location (1-6) and Foot (Right, Left). Order was the only between-subject variable and the rest were within-subject vari-ables. Each trial resulted in two measurements: perceived vibration location and
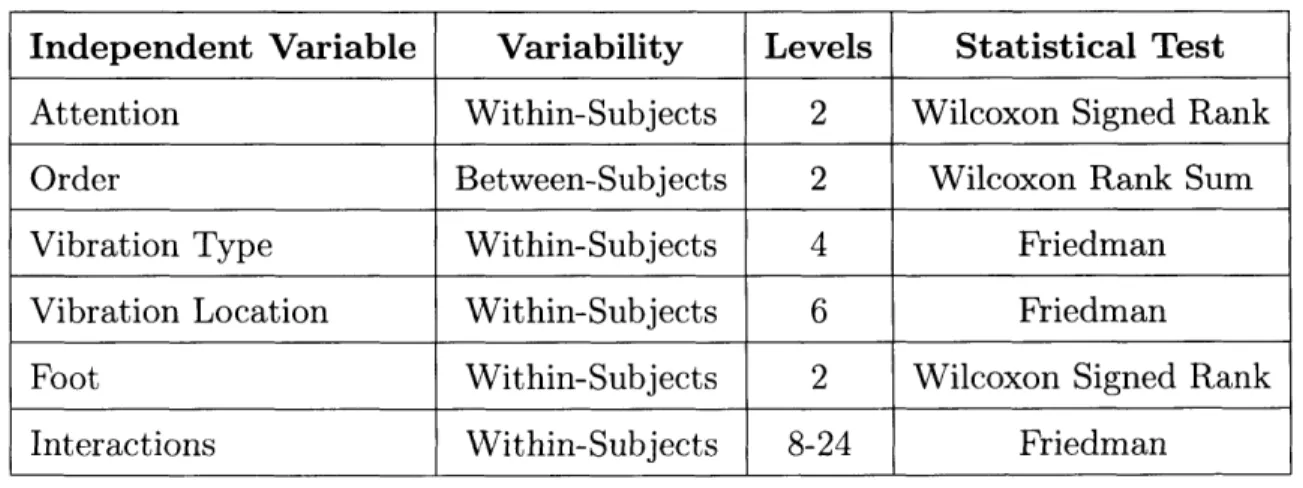
perceived vibration type. The location responses were used to calculate perceived Location Accuracy scores while the vibration type responses were used to calculate perceived Type Accuracy scores. As a result, each participant had two separate accu-racy scores (i.e. Type and Location) for each of the 48 unique vibration combinations. Each accuracy score was independently calculated by dividing the number of correct responses by the total number of trials for that type/location combination (i.e. six). An undetected trial counted as an incorrect response in both calculations for accu-racy. The independent variables of Type and Location did not pass Mauchly's Test of Sphericity, an important assumption in a Repeated Measures Analysis of Variance (RMANOVA), so non-parametric tests were performed. These tests included the Wilcoxon Signed Rank, Wilcoxon Ranked Sum, and the Friedman test (Table 2.1). All post-hoc tests utilized a Bonferroni Correction and the family significance level was a = 0.05. Effect sizes for significant pairwise differences were measured with Hedges' g.
Table 2.1: Non-parametric tests used to determine effects of independent variables on non-spherical dependent variables
Independent Variable Variability Levels Statistical Test
Attention Within-Subjects 2 Wilcoxon Signed Rank
Order Between-Subjects 2 Wilcoxon Rank Sum
Vibration Type Within-Subjects 4 Friedman
Vibration Location Within-Subjects 6 Friedman
Foot Within-Subjects 2 Wilcoxon Signed Rank
Interactions Within-Subjects 8-24 Friedman
2.2
Results
2.2.1
Perceived Location Accuracy
Overall, participants performed well in discriminating the locations where vibrations occurred (Fig. 2-3). A Friedman test supported a significant main effect of Location
on Location Accuracy (Table 2.2). Post-hoc tests support significantly less accuracy for Location 3 compared to Location 1 (p=0.0163, g=1.0), Location 5 (p=0.0331, g=0.91), and Location 6 (p=0.0045, g=1.04). On the right foot, the lower accuracy seen for Location 3 can mostly be attributed to undetected Low vibrations here (discussed further in next sections). On the left foot, lower accuracy is a result of participants confusing Location 3 with neighboring Locations 2 and/or 4.
Table 2.2: Statistics from a Friedman test on the effect of Vibration Location on Perceived Vibration Location Accuracy (pooled across
Attention, Type, Order, and Foot)
Source SS d.f. MS Chi-Sq. p-value
Vibration Location 2547.99 5 509.60 69.09 <0.0001
Interactions 1819.89 45 40.44 -
-Error 4114.13 180 22.86
-Total 8482.00 239 - -
-Left Foot Right Foot
1 2 3 4 Location 5 6 100 90 80 I S 70 60 50 40 1 2 3 4 Location
Figure 2-3: Average perceived Location Accuracy each foot and attention state (pooled across
5 6
and standard error for Type and Order)
100 I 90* 80 70 - 60- 50-40 -e-Foamed. -e-- Distacted
2.2.2
Perceived Type Accuracy
Wilcoxon Signed Rank and Rank Sum tests support significant main effects of Atten-tion and Order on Type Accuracy (Table 2.4). Participants had higher accuracy in discriminating vibration types during Focused trials (M=79.82%, SD=z27.98%) com-pared to Distracted trials (M=70.76%, SD=32.78%), with a p <0.0001 and small effect size of g=0.30. Additionally, those assigned to Order DF (Mean=80.34%, SD=32.78%) had higher accuracy scores than those in Order FD (Mean=70.24%, SD=27.80%), with a p <0.0001 and small effect size of g=0.33.
Table 2.3: Statistics from Wilcoxon Signed Rank and Rank Sum tests on the effects of Attention and Order on Perceived Vibration Type
Accuracy (pooled across Location, Type, and Foot)
Variable Level Mean SD Rank p-value
Focused 79.82% 27.98%
AttentionDistracted 70.76% 32.78% Signed Rank: 30272 <.0001
FD 70.24% 32.78%
Order Rank Sum: 210835 <.0001
DF 80.34% 27.80%
A Friedman test supported a significant effect of Type on Type Accuracy (Table 2.3). Accuracy scores are higher for the static vibrations of High and Low than those for dynamic vibrations of Increase and Decrease (Fig. 2-4). While post-hoc tests did not show significant pairwise comparisons, a contrast test (Wilcoxon Signed Rank) comparing static vibrations (Low and High pooled scores) and dynamic vibrations (Increase and Decrease pooled scores) supported a significant difference (p <0.0001, g-=0.95).
Table 2.4: Statistics from a Friedman test on the effect of Vibration Type on Perceived Vibration Type Accuracy (pooled across Attention,
Location, Order, and Foot)
Source SS d.f. MS Chi-Sq. p-value
Vibration Type 125897.78 3 41965.93 188.45 <0.0001 Interactions 141152.81 27 5227.88 - -Error 367617.92 920 399.58 -Total 634668.50 959 - - -100 90 80 1 0 70 60 50 40 In1 Left Foot -o -Hgh LOW -. --Increase .ruase 100 90 80 Right Foot 70 [ 0 60 50 40 [ 4n 1 2 3 4 5 6 1 2 3 4 5 6 Location Location
Figure 2-4: Perceived vibration Type Accuracy mean and standard error for each Location, Type, and Foot (pooled across Attention)
A significant interaction between Foot and Location was supported by a Friedman test (Table 2.5). Post-hoc tests do not show any significant pairwise comparisons. The significant omnibus test may have been influenced by lower Vibration Type Accuracy at Location 3 for Increase and Low vibrations on the right foot, as the overall mean for Location 3 on the right foot was lower than the rest (Fig. 2-4). A possible explanation for this phenomenon is highlighted in the next section.
Table 2.5: Statistics from a Friedman test on the interaction of Foot*Location on Perceived Vibration Type Accuracy (pooled across
Attention, Type, and Order)
Source SS d.f. MS Chi-Sq. p-value
Foot*Location 18453.76 11.00 1677.61 27.62 0.0037
Interaction 45947.49 99.00 464.12 -
-Error 570267.25 840.00 678.89 -
-Total 634668.50 959.00 - -
-2.2.3
Undetected Vibrations
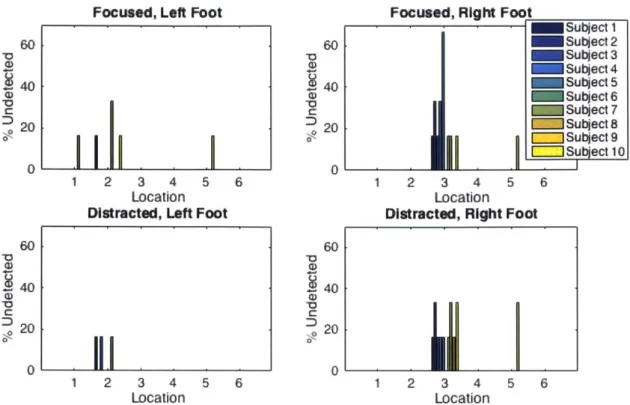
Vibrations at select locations were sometimes undetected, and occurred most fre-quently (i.e. approximately 20% of the time) for Low vibrations at Location 3 on the right foot (Table 2.6). While some participants occasionally did not detect vibrations at other locations, the majority of participants had difficulty perceiving Low vibra-tions at Location 3 on the right foot (Fig. 2-5). It is important to take these data into consideration while examining the main effect of Location on vibration Loca-tion Accuracy and the interacLoca-tion of LocaLoca-tion and Foot on vibraLoca-tion Type Accuracy, as an undetected vibration response resulted in an incorrect score for each accuracy type. While Location 3 sometimes caused location discrimination difficulties on the left foot, the undetected Low vibrations on the right foot at Location 3 certainly contributed to the lower accuracy scores seen for this Location, Type, and Foot.
Table 2.6: Percentages of undetected vibrations across all trials and participants. All dashed cells and cells not shown have zero undetected
responses for those trials.
Focused Distracted R3 R5 Li L2 L5 R3 R5 L2 High - - 1.7% - - - - -Low 21.7% 1.7% - 6.7% - 20% 3.3% 5% Type Increase - - - - - - - -Decrease - - - - 1.7% - -
-60 4) 140 "a C 0 60 ~4 "a C =)20 0 a) 4) 0-60 40 20 Focused, Left Foot
1 2 3 4 5 6
Location Distracted, Left Foot
1 2 3 4 5 6 Location V a) a) V C -o 60 40 20 0
Focused, Right Foot
Subject I Su3ect 2 Subject 3 1 2 3Sub4e5t4 Subject 5 Subject 6 Subject 7 Subject 8 Subject 9 =Subject 10 1 2 3 4 5 6 Location
Distracted, Right Foot
1 2 3 4 5 6
Location
Figure 2-5: Percentage of undetected vibrations for each subject and vibration Location
2.3
Discussion
This study examined the effect of Attention, Foot, vibration Location, and vibration Type on vibrotactile foot perception. It was hypothesized that distracted attention states would decrease perception accuracy due to limited attentional resources, and that certain vibrations types would be easier to detect than others. Overall, these results provide useful implications for vibrotactile interface design for the feet.
Results show that tactile perception of vibration patterns (i.e. Type) is degraded during distracted states of attention. Mean Type Accuracy was approximately 9% lower during the distracted trials, although the small effect size may be due to pooling of other variables. This has implications when designing interfaces that map criti-cal information to sensory signals. Detection of time criticriti-cal signals must be robust enough to eliminate ambiguity and ensure adequate signal interpretation. While at-tention state affected perceived vibration Type Accuracy in the current study, it did
not significantly affect perceived Location Accuracy. This implies that signal detec-tion was robust, but comprehension of secondary informadetec-tion was slightly impaired (i.e. small effect size). Therefore, when designing vibrotactile information presenta-tion devices, it may be more reliable to use locapresenta-tion to convey critical informapresenta-tion while other details in the signal can provide additional sub-critical information; for example, in the context of obstacle avoidance, vibration location could convey the location of an obstacle while the vibration signal type could convey proximity to the obstacle. Once the user is adequately notified of the presence and location of the item (critical component), they could choose to interrupt current tasks to examine additional details of the obstacle (sub-critical components) if signal type perception wasn't salient. It's important to note that small effect sizes may be a result of pooling data across groups for non-parametric tests, which results in higher overall variability.
The significant effect of Order on Type Accuracy is an interesting finding. Par-ticipants who completed Distracted trials first (Order DF) were 10% more accurate on average in distinguishing vibration types than those who completed the Focused trials first (Order FD). The effect size was small (g=0.33), although could have been due to the pooling of other variables. Type Accuracy did not show any trend with time or trial number, but nonetheless there may be some effect of attention on learn-ing and/or detection over time. For example, if participants became tired or their feet became less sensitive over time (each set of trials consisted of 288 vibrations), it's possible that ending the experiment with the information processing load of the Distracted trials could have further impaired perception.
With average perceived Location Accuracy scores close to 100% for most foot lo-cations, vibrations at these locations are promising for applications in tactile displays. Although, limitations exist with the locations on the lateral side of the foot. Sensa-tion in this area may not have fine enough locaSensa-tion resoluSensa-tion, as some participants often confused it with neighboring Locations 2 or 4 on both feet. Additionally, this location may be less sensitive, as participants often did not feel the Low vibration here on the right foot, which contributed to the lower perceived Location Accuracy for Location 3 and lower perceived Type Accuracy for Location 3 on the right foot.
The poor detectability at this location may also have been due to a mechanical issue with that particular vibration motor; it is possible that the Low vibration level of this motor was different from that of the other motors (e.g. lower magnitude). Detection difficulties at other locations were much less common and specific to the participant. Subject-specificity of tactile thresholds on other foot locations has been observed in previous research [50, 46]. Going forward, it may be favorable to only include one or two locations on the lateral side of the foot for vibrotactile inputs (i.e. Locations 2 and/or 4).
User abilities in perceived vibration Type Accuracy vary by Type -static vibration types (High and Low) were more easily detected than dynamic vibration types (In-crease and De(In-crease). On average, the static types were detected with higher accuracy by roughly 26% and a contrast between the two sets (i.e. static vs dynamic) had a large effect size. Participants reported occasional difficulty in detecting the difference between High vibrations and the dynamic vibrations (Increase and Decrease), which was observed in their trial responses. Participants stated that they usually selected High during these moments of confusion, which is consistent with lower accuracy for dynamic vibrations, with Decrease types being the hardest to distinguish. Partici-pants reported that when a vibration started at the High level and then decreased, it was harder to detect this change than in the case for an increasing vibration, which could be due to the cutaneous sensation of the High level desensitizing the skin to the proceeding lower levels. A study simulating a monitoring task for an anesthesiologist in an operating room employed a tactile display to indicate changes in patient blood pressure, and results showed that tactile "change blindness" (i.e. failure to recognize a change in signal) occurred more often when the change in vibration intensity was gradual as opposed to discrete [66]. These results suggest that decreasing vibration signals are not adequately detectable and should not be used for critical informa-tion presentainforma-tion. It is hypothesized that if the Decrease type was removed from the current study, perceived Type Accuracy for High vibrations may have been higher than those for Low vibrations, especially since High levels were rarely undetected. Regarding the Increase vibration type, distinguishing these from High types may be
easier than is the case for Decrease types, but there is still insufficient evidence that it's reliable enough to convey critical information in a haptic interface application.
Vibrations were rarely undetected except for those of type Low at Location 3 on the right foot, which had an unusually high occurrence (about 20% of all R3-Low trials). It is unclear why the undetected signals are only for the right foot. The vast majority of participants were right-handed, so it is possible that the lateral side of the dominant foot is less sensitive and has a higher tactile detection threshold, but this is just speculation. The Low, Increase, and Decrease vibration types on the Right foot appear to have more variability in perceived Type Accuracy across locations, suggesting that the perception capabilities of the Right and Left feet do differ in some ways. It is also worth speculating that this phenomenon could have been device related (e.g. the motor at this location was below specification during Low vibrations). While the same type of motor was used at each location, it would be useful to confirm consistent vibration output levels with an accelerometer in the future.
2.4
Implications for Vibrotactile Displays
Overall, results demonstrate that the haptic perception capabilities of the feet for selected locations and vibration types is sufficient for use in a vibrotactile interface. High and Low vibrations are successfully perceived at most of the locations examined. Careful consideration should be taken when utilizing quickly increasing/decreasing continuous vibrations or multiple locations on the lateral side of the foot. Most im-portantly, signal perception should be robust enough to withstand attentional loading, so vibrotactile signal location should convey the critical information while the more subtle signal properties (e.g. intensity, duration, and patterns) can supplement with less critical information. Future work could examine different locations on the foot, different sizes in applied vibration area, or alternate dynamic patterns such as pulsing vibrations with unique interval timing.
of the multi-modal device for obstacle avoidance, where sensory reinforcement via visual channels was also incorporated. To narrow the large scope of an obstacle avoidance task, which could involve walking around an obstacle or stepping over it, the current body of work focused on multi-modal information display for the strategy of approaching and stepping over an obstacle. As a result, only one location from the current perception study was selected for use in the device - the front of the foot. Other locations examined in the current perception study could certainly be utilized in a version that supports the strategy of walking around an obstacle (e.g. vibrations on the perimeter of the foot could help guide participants away and/or around obstacles). While the current application of interest involves a wearable in-terface for obstacle avoidance, the growing range of computing devices, computational power and input/output capabilities opens doors for numerous haptic applications in human-computer interaction