DETERMINATION OF 3-D BORON DISTRIBUTION
ABOLGHAASEM FADAAT
B.S. (Met.E.), Arya Mehr University
(1976)
SUBMITTED IN PARTIAL FULFILLMENT OF THE REQUIREMENTS FOR THE
DEGREES OF
MASTER OF SCIENCE IN NUCLEAR ENGINEERING
MASTER OF SCIENCE IN MATERIALS SCIENCE AND ENGINEERING at the
MASSACHUSETTS INSTITUTE OF TECHNOLOGY JUNE 1978
(© MASSACHUSETTS INSTITUTE OF TECHNOLOGY
Sighature redacted
Signature of Author ... Teo ieee qn .. . mnDepartment of Nuclear Engineering,
Si t d t d= 28, 1978
ignature r Sos
Certified by .. 9 € redacte : es74A
&; Lo acted
-Certified by .... 1g cee es
} oo Thesis Supervisor
Signature redacted
Accepted by . . #3 : sk meee
Chairman { Department Committee on
Graduate Students
ARCHIVES
MASSACHUSETTS INSTITUTE OF TECHNOLORYJUL 30 1979
LIBRARIES
by
and1078&
DETERMINATION OF 3-D BORON DISTRIBUTION
ABOLGHAASEM FADAAI
Submitted to the Department of Nuclear Engineering on June 28, 197¢ in partial fulfillment of the requirements for the Degrees of Master of Science in Nuclear Engineering
and Materials Science and Engineering.
ABSTRACT
The technique of boron autoradiography has been used to study the spatial distribution of boron in splat cooled 316
stain-less steels. The products from the *B(n,o0) ’Li reaction produce tracks in a cellulose acetobutyrate replica exposed to a thermal-neutron flux while in contact with the specimen.
The tracks are revealed by etching in aqueous KOH at 50°C. Track density is proportional to boron content. A track size
of v 0.2 um is obtained when the replica is etched in 50% KOH at 50°C for 10 minutes. A resolution of ~ 0.3 um is obtained
if the replica is studied in a TEM, making the technique
capable of studying boron distribution in small-grained
materials.
For splat cooled specimens of stainless steel containing as high as 500 appm boron no detectable segregation was observed. This was also true for specimens which were
heated for 90 minutes at 575°C. Presence of precipitates in the specimens is believed to be due to different
impuri-ties, such as S and 0, and not because of boron. Electron energy loss spectrometry attached to a STEM didn't detect
any boron in the precipitates.
The final conclusion supported by both boron autoradiography
and electron microscopy, is that a uniform distribution of by
boron is obtained if the ss alloy, containing as high as 500
appmB, is splat cooled from the melt.
Thesis Supervisor: 0. K. Harling
Title: Director of MIT Research Reactor
Thesis Supervisor: N. J. Grant
TABLE OF CONTENTS ABSTRACT . . TABLE OF CONTENTS 4 LIST OF FIGURES 5 LIST OF TABLES . ¥ ACKNOWLEDGEMENTS . 8 CHAPTER 1: INTRODUCTION 9 CHAPTER 2: BORON AUTORADIOGRAPHY 18
2.1 Particle Track Etching 18
2.2 Helium Ion Formation . . 24
2.3 Diameter of Damaged Zone 27
2.4 Track Formation Mechanism . 28
2.5 Experimental Procedure . 30 CHAPTER 3: ELECTRON MICROSCOPY OF THE SPECIMENS 34
3.1 Direct Examination of Specimens 34
3.1.1 Specimen Preparation . . 35
3.2 Particle Extraction Technique . 37 3.2.1 Extraction Replica Preparation
Technique . . 38
CHAPTER 4: RESULTS AND DISCUSSION . . . 39
4 1 Results of Electron Microscopy . ; 40
4.2 Particle Extraction Method Results 46
4.3 Boron Autoradiography Results . . . ; 49
4.3.1 Dependence of Fission Particle
Track Size on Etching Time . . . 49
4.3.2 Track Density . . : ; 50
4.2.3 Boron Distribution - 50
4.4 Discussion . . ‘ 57
CHAPTER 5: SUMMARY - 62
LIST OF FIGURES
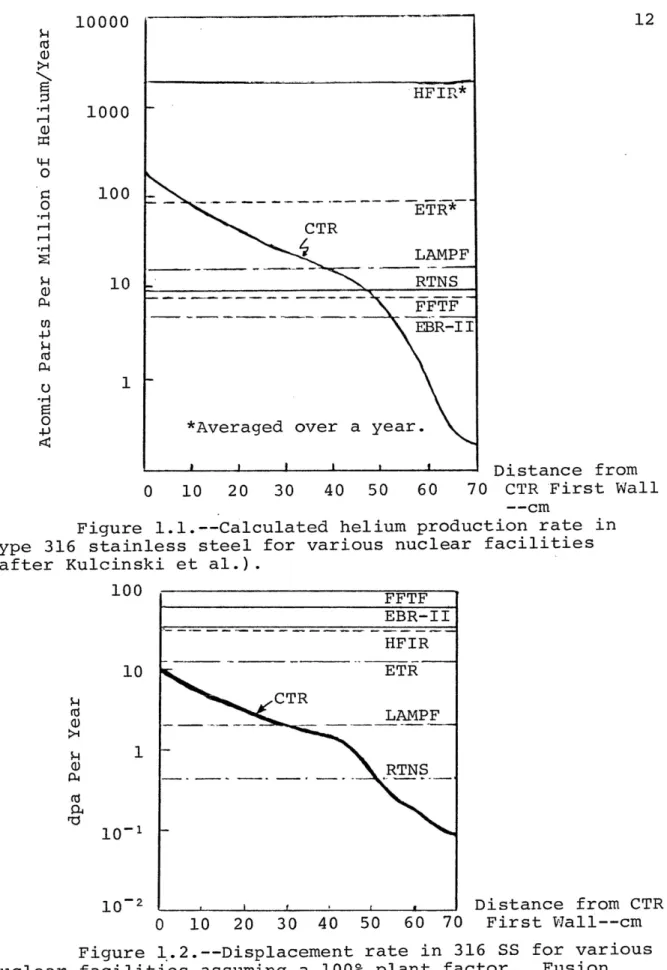
1.1 Calculated helium production rate in 316 SS 12
1.2 Displacement rate in 316 SS . 12 1.3 Calculated helium to displacement ratio . 14 2.1 The atomic character of a plastic track v 19 2.2 o-particles with their paths . 23 2.2 The solid solubility of boron in high purity iron . 25
2.4 Method of preparing the cellulose acetobutyrate film 31
“.1 A schematic illustration of voltage/current curve
for an electropolishing solution . . 36
4.1 TEM Micrograph of splat cooled 316 SS containing
100 appm B . Cw ’ 41
4.2 Distribution of elements in 316 SS 41
4,% STEM micrographs of splat cooled 316 SS with
100 appm B 42 4 / Distribution of elements in a precipitate of
316 SS containing 100 appm B i * 4
4.5 STEM micrographs of splat cooled 316 SS with
500 appm B . e % 0B - ® 2 + 3 0
4.6 STEM micrograph and X-ray analysis of 316 SS
containing 0.5 wt.% B 47
4.7% STEM microstructure of an extraction replica 8
4.8 Boron autoradiograph of splat cooled 316 SS
with 100 appm B . : . 1
4.9 Boron autoradiograph of splat cooled 316 SS
with 500 appm B ~1 — 4. 4 + = 5.
-~~
wl
0
4.10 Optical autoradiograph of 316 SS containing
0.5 wt.% B . . 53
4.11 SEM autoradiographs of 316 SS containing 0.5 wt. %B 54
4.12 TEM autoradiograph of 316 SS containing 0.5 wt. % B 55 4.13 TEM autoradiographs of 316 SS with 0.5 wt. % B . 56 4.14 Boron distribution in a heat treated splat cooled
316 ss . ~8
4.15 TEM boron autoradiographs of an air cooled,
heat treated 316 SS containing 500 appm B . ~9 5.1 TEM micrograph and autoradiograph of splat cooled
LIST OF TABLES
1.1 Calculated helium production rates 10
1.2 Calculated maximum displacement rates ; 11
1.3 Existing irradiation facilities 15
1.4 Different tricks for simulation . Co. 17
2.1 Diverse applications of etched particles tracks ’ 21 3.1 Electropolishing conditions for 316 SS . 37 4.1 Chemical composition of 316 SS (w/o) . 39 4.2 Variation of damage track size with etching time . 49
ACKNOWLEDGEMENTS
TI would like to express my sincere appreciation to Professor O. K. Harling and Professor N. J. Grant for their
valuable guidance and patience throughout the course of this
research.
A special note of appreciation is given to Miss. S.
West, who prepared the splat cooled alloys.
I would also like to thank the staff of the M.I.T.
Reactor for their cooperation in carrying out the research.
CHAPTER 1
INTRODUCTION
Controlled thermonuclear reactor (CTR) is considered
to be a major source of energy for the future. Research is
going on in different fields of CTR development. An impor-tant part of this work is the development of proper materials
which will be used in fusion power reactors.
The structural components of a CTR, especially its first wall, will be subjected to a very severe high tempera-ture and irradiation environment for long periods of time.
The safe and economic operation of a CTR will, to a large extent, depend on how successfully materials are chosen that can retain adequate mechanical and physical properties under such severe conditions.
Many materials problems associated with fusion
reactors have become apparent through reactor design studies and experiments in conventional fission reactors. Such
studies have shown that simultaneous generation of radiation damage and helium is one of the most important problems which must be resolved before construction of commercial fusion
reactors.
It is obvious that we must know the quantitative
values of the displacement and transmutation rates in
potential CTR materials. Since high power fusion reactors will not be available until at least the late 1980s, ‘l)
therefore we must try to simulate reactor conditions the best we can in current irradiation facilities and test the
potential materials under these simulated conditions to see
if they will meet the design requirements.
Doran, Kulcinski, and Abdu 2) have calculated gas
and damage production rates for several CTR designs. Their
calculated results for five suggested materials in different
nuclear facilities are given in Tables 1.1 and 1.2 and
Figures 1.1 and 1.2. The displacement rates in the first
wall of a fusion system vary from a low of 2.3 X 10~7 dpa/s
Table 1.1.--Calculated helium production rates for typical
nuclear facilities (after Kulcinski et al.).
appm/s x 107 a D : 316 SS” 316 SS Pp CTR (1 MW/m?) “4 N / 5 15 18 130 FFTF £.5 N 3.53 0.95 0.15 5.5 EBR-IT 1.5 N 0.31 0.57 0.097 2.5 HF IR 2.6 1330 0.57 1.0 0.15 5.8 ETR 0.61 48 0.15 0.27 0.030 1.3 RTNS 2.9 N 0.34 0.68 0.81 5.9 LAMPF 5.1 N 0.62 1.2 1.3 9.1
primary reactions only.
Phyelium (appm/s x 107) contribution from ®Ni(n,a)¥®Ni
(n,0) after one year of irradiation.
N = negligible.
10
1 Table 1.2.--Calculated maximum displacement rates for typical
nuclear facilities (after Kulcinski et al.).
dpa/s x 10° 316 SS "1 CTR (1 MW/m?) 0 v3 vg Ton FFTF (400 MW) 25 16 EK 34 49 EBR-IT (62.5 MW) 14 9.0 9.6 17 24 HFIR (100 Mw) 14 7.8 8.4 16 19 ETR (175 MW) 5.1 3.2 3.5 6.6 8.4 RTNS (2 x 10% n/cm? /s, 14 Mev) 0.14 0.1 0.12 0.12 0.24 LAMPF (2 x 10Y“n/cm® /sec, total) 0.84 0.6 N.6 1.1 1.4
to 5.4 x 1077 dpa/s in aluminum. In all cases considered in these calculations, fission reactors yielded higher
dis-placements rates than that expected for a CTR first wall and blanket at 1 MW/m? wall loading. For the gas production rates
(especially He) the situation is much different and there are dramatic differences between the gas production rates of
various materials in the same reactors. The more important
point is that the helium production rate is much greater in
a CTR first wall than in the current fission radiation
facilities. In fact, nonfusion sources cannot generate enough helium to duplicate the production rates in the first 40 to
50 cm of such a blanket. On the other hand, fission reactors
may be able to duplicate the helium production rates up to
nn 7 MW/m? by the use of various tra =.
1
#. Cb Mo ¥ A
(0 - 1000 1 IT;
5
i» inn t ’ MPz LAMPF |
§00m.opEONS,
- oT Em + EBR-IT :, oyP
= *Averaged over a year.
issn * sesseddeassessedle : © Distance from
0 10 20 30 40 50 60 70 CTR First Wall
—-Ccm
Figure l.1l.--Calculated helium production rate in
Type 316 stainless steel for various nuclear facilities
(after Kulcinski et al.).
nNmm———l,Spm}Seemm————fei
TT TFET
EBR-IIHFIR
10 Ns . - ETRy Ce
0 L2MPF oHCO
a, Co } PTNS © Q, o1071
i072 . _.. _____ _ _ _ _) Distance from CTR
0 10 20 30 40 50 60 70 First Wall--cm
Figure 1l.2.--Displacement rate in 316 SS for various nuclear facilities assuming a 100% plant factor. Fusion reactor has a first wall loading of 1 Mw/m? (after Kulcinski et al.). 10000 1z Cau LoL Cir “UL CTR
The problem of duplicating CTR helium generation
rates in a fission reactor is the major difficulty in simu-lation of CTR conditions. The important parameter is the helium to displacement ratio which has to be simulated in
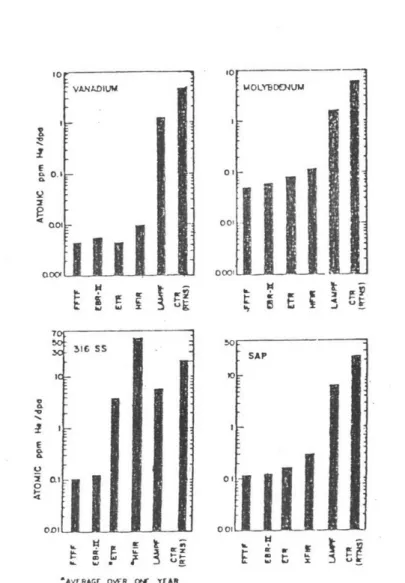
the conventional facilities. Figure 1.3 shows the calculated ratio for different materials in different facilities. It shows that for most CTR designs the ratio is between 7:1
appm He/dpa and 15:1 appm He/dpa.
Existing irradiation facilities are not capable of
simulating the proper ratio of helium to dpa. Table 1.33) summarizes the features of some existing facilities. In order to overcome the main difficulty, which is helium generation, different "tricks" have been used and some of
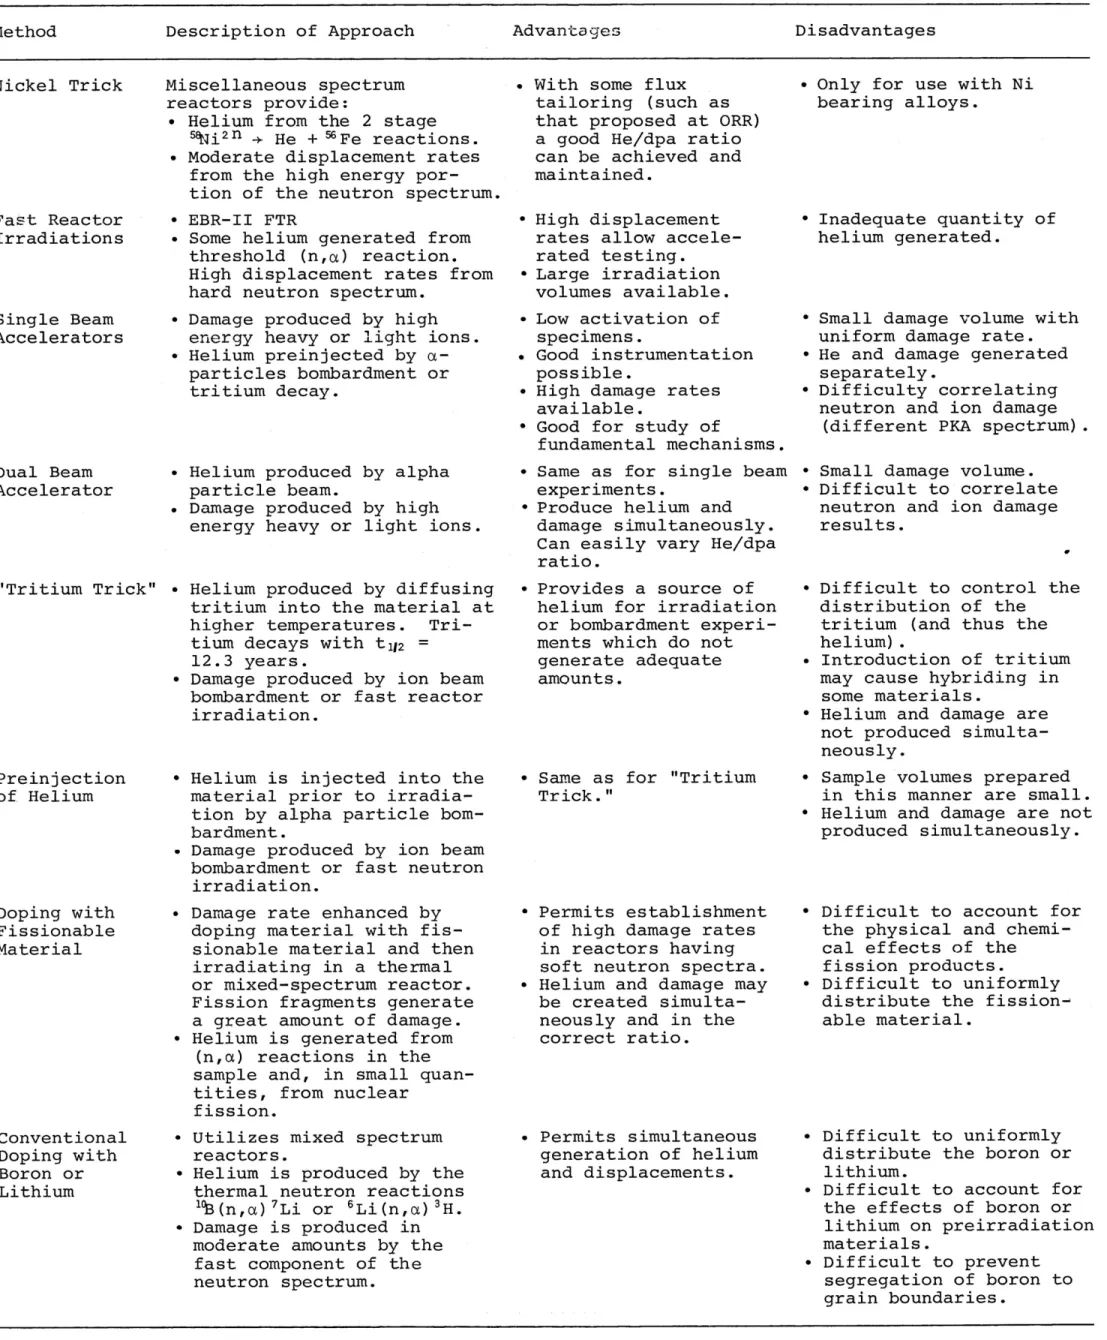
them are shown in Table 1.4.3) Doping with boron or
lithium is one of the techniques used. The biggest problem
with boron doping of conventional ingot alloy products is the segregation and precipitation of boron at grain bounda-ries which subsequently affects the mechanical properties of the materials. (¥ Furthermore, we must get a uniform
distri-bution of generated helium in the material. Since the purpose of boron doping is to provide a mechanism for synergistic
helium and damage production, it is important that the boron be homogeneously distributed throughout the alloy at least
on the scale of the alpha particle range, i.e., 1-2 um. The use of rapid quenching from the melt offers the possibility
of a uniform distribution of boron at a useful concentration. 13
J 19 | VANADIUM " MOLYBDENUM oak 0:
‘ek oo!
JH
[eXe 0 ls bx oc ss 5 ® 2 = 2EERE: EEE REL
rn,
= XE SAP
iC -ol on- | || i |
oD! ool -A vs « 49 = t x7 > ow E tE gf x 3E Eo sz f 3cf
"AVERAGE OVER ONC YEAR
Figure l1l.3.--Calculated helium to displacement ratio
in various nuclear facilities (after Kulcinski et al.).
18
Table 1.3.--Existing irradiation facilities for potential use in CTR first wall studies
Facility Positive Features Negative Features
A. Fission reactors
1. High flux mixed 1. Can produce dpa and helium at real time up to 1. Does not match CTR neutron energy spectrum reactors n 2 MW/m? and at accelerated rates below this spectrum.
(¢ ¥ 1 x 10™ in for alloys containing nickel.
n/cm? sec of fast . Can't product relevant helium concen-neutrons and ~ Instrumentation available to actively control trations in materials that do not thermal neutrons). during irradiation the temperatures, stresses, contain nickel.
and chemical environments relevant to CTRs. 3. Can conduct in situ measurements,
4. Have the large experimental volume necessary
for the required test matrix.
5. High duty factor.
2. Fast neutron 1. Can produce dpa greatly accelerated over that 1. Can't produce relevant helium
concen-reactors in a CTR at 1 MW/m? trations in any structural material.
2. Large experimental volume. 2. No capability for in situ measurements. 3. Passive temperature and stress control; active 3. Currently no active control of
tempera-control may be possible later. ture and stress of chemical environment.
1. Good simulation of the CTR neutron energy spectrum for regions beyond the first wall.
B. Ion accelerators 1. Highly accelerated dpa rates, good for swelling 1. Extremely difficult to conduct mechani-studies. cal properties mechani-studies.
2. Can actively control temperature, stress, and 2. Time dependence of kinetic processes
chemical environment. must be established. 3. Can conduct in situ measurements.
9
This can be done by splat cooling with cooling rates up to
108°Cc/s.
This new boron doping technique has been suggested by Professor O. K. Harling, Director of M.I.T. Reactor
Lab-oratory, and its study has been approved by the U.S.
Department of Energy. In order to carry out the project, techniques for the determination of the boron distribution must be established. Establishing the techniques for 316 stainless steels (316 SS) and similar materials is the
objec-tive of this thesis. This is one of the first tasks of the
approved project.
Boron autoradiography has been found to be a useful
tool to study boron distribution. It has proved successful for slow cooled alloys with a grain size of the order of
50 um. In this work we have tried to apply this technique
to splat cooled 316 SS, and to optimize the resolution to
make the technique useful for fine grain sizes. In Chapter
2 we will discuss different aspects of boron autoradiography
technique.
Chapter 3 covers different electron microscopy
techniques used for direct examination of specimens.
Particle extraction techniques will also be covered in this chapter. In Chapter 4 results will be discussed and compared. Chapter 5 covers the summary of the whole work.
Table l.4.--Different tricks used to simulate CTR environment.
Method Description of Approach Advantages Disadvantages
Nickel Trick Miscellaneous spectrum » With some flux » Only for use with Ni reactors provide: tailoring (such as bearing alloys.
» Helium from the 2 stage that proposed at ORR)
9yi2 » He + ¥Fe reactions. a good He/dpa ratio - Moderate displacement rates can be achieved and
from the high energy por- maintained. tion of the neutron spectrum.
Fast Reactor - EBR-II FTR * High displacement » Inadequate quantity of
Irradiations Some helium generated from rates allow accele- helium generated.
threshold (n,o) reaction. rated testing.
High displacement rates from + Large irradiation
hard neutron svectrum. volumes available.
Single Beam - Damage produced by high e Low activation of * Small damage volume with Accelerators energy heavy or light ions. specimens. uniform damage rate.
» Helium preinjected by o- » Good instrumentation » He and damage generated particles bombardment or possible. separately.
tritium decav. » High damage rates » Difficulty correlating available. neutron and ion damage » Good for study of (different PKA spectrum)
fundamental mechanisms.
Dual Beam » Helium produced by alpha » Same as for single beam * Small damage volume. Accelerator particle beam. experiments. » Difficult to correlate
Damage produced by high » Produce helium and neutron and ion damage
energy heavy or light ions. damage simultaneously. results. Can easily vary He/dpa
ratio.
"Tritium Trick” - Helium produced by diffusing Provides a source of » Difficult to control the
tritium into the material at helium for irradiation distribution of the higher temperatures. Tri- or bombardment experi- tritium (and thus the
tium decays with ty, = ments which do not helium).
12.3 years. generate adequate » Introduction of tritium
Damage produced by ion beam amounts. may cause hybriding in
bombardment or fast reactor some materials.
irradiation. * Helium and damage are
not produced
simulta-neously.
Preinjection » Helium is injected into the + Same as for "Tritium » Sample volumes prepared of Helium material prior to irradia- Trick." in this manner are small.
tion by alpha particle bom- » Helium and damage are not
bardment. produced simultaneously.
- Damage produced by ion beam bombardment or fast neutron
irradiation.
Doping with - Damage rate enhanced by *» Permits establishment » Difficult to account for Fissionable doping material with fis- of high damage rates the physical and
chemi-Material sionable material and then in reactors having cal effects of the irradiating in a thermal soft neutron spectra. fission products.
or mixed-spectrum reactor. e Helium and damage may » Difficult to uniformly
Fission fragments generate be created simulta- distribute the fission-a grefission-at fission-amount of dfission-amfission-age. neously fission-and in the fission-able mfission-aterifission-al.
Helium is generated from correct ratio. (n,a) reactions in the
sample and, in small
quan-tities, from nuclear fission.
Conventional » Utilizes mixed spectrum » Permits simultaneous e Difficult to uniformly
Doping with reactors. generation of helium distribute the boron or
Boron or » Helium is produced by the and displacements. lithium.
Lithium thermal neutron reactions » Difficult to account for
B(n,a)’Li or ®*Li(n,a) ®H. the effects of boron or
Damage is produced in lithium on preirradiation
moderate amounts by the materials.
fast component of the » Difficult to prevent
neutron spectrum. segregation of boron to
CHAPTER 2
BORON AUTORADIOGRAPHY
2.1 Particle Track Etching
The passage of heavily ionizing, nuclear particles
through the most insulating solids creates narrow paths of
intense damage on an atomic scale. These damage tracks can be revealed and seen in an optical microscope if they are
treated with a properly chosen chemical reagent that
preferen-tially attacks the damaged zones. This simple technique has
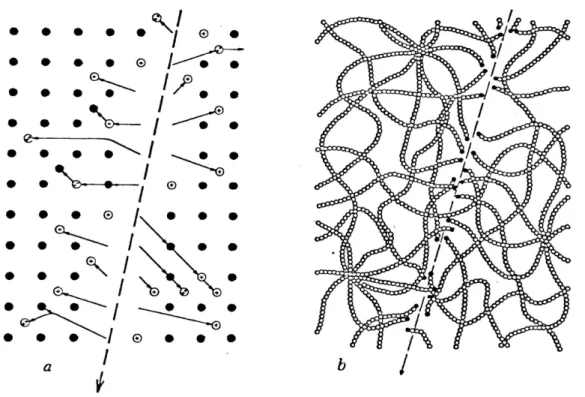
been used in a wide variety of technical fields. Figure 2.1 shows the envisioned character of tracks in crystalline and
polymeric solids.
The first direct photographs of damage trails created
by ?®U fission fragments were TEM micrographs of mica’?
published in 1959. Since then, this technique has found diverse applications in science and technology. The
appli-cations range from semiconductor electronics to aerosol
sampling, identification of microbiological particles,
nuclear engineering, mine safety, neutron radiography,
uranium exploration, sewage disposal, and securing nuclearreactors for safety use. Fission track dating is a powerful
tool for age measurements of natural ainerals. t®
Determina-tion of the distribuDetermina-tion of plutonium and other transuranium
19 ® ® ® ® ® ® ) LT " ® © 5 » © o | Oa f + ® oe oo oo ’ oe oT ” © o No Ce ~ @— - , . ® © eo oo ~~ . o oo ‘ nl ~® ; Bode ® ® “oe ® ® LJ r ®e ©® eo © In ® oO oo Lx woo a . 4 5» ® 2 & ~- [ Nee Ce Co : x, SN : . ® oe eo | ‘ ° ¢
ee. | % 2% >
®e ee eo ®e © eo ee ~- / TTT— 3 | : » ¢ oN © eo eo eo 2 of vl /Figure 2.1.--The atomic character of a particle track in (a) a crystal and (b) a polymer. In the crystal the damage consists of continuous disorder composed of vacant lattice
sites and of interstitial ions or atoms. In the polymer new chain ends and other chemically reactive sites are formed
3
elements in bone sizssuet? in another application of particle
track etching technique. A most recent application is the study and measurement of sputtering of avaniun'®’® and someother elements 10) by different ions. Study of the boron distribution in different alloys has its own importance both in nuclear technology and in metallurgy. Table 2.1
summarizes (11) the different applications of this technique. In recent years it has become recognized that the presence of boron up to ppm level in steels and other alloys
can greatly influence physical and mechanical properties of these materials. (1%) As examples, boron has important
effects on steels used for nuclear-reactor construction, 13) and on creep, (12/153) feacave, 8 and other properties of
steels. The low atomic number of this element has made it very difficult to determine its content with an electronprobe microanalyzer. There was, therefore, a need for new methods of determining boron distribution on a microscopic scale in order to understand its behavior.
Hughes and Rogers (17) were the first people who developed the boron autoradiography technique to overcome
the difficulty in determining boron distribution. The tech-nique is based on the ability of some plastics to record the
passage of charged particles of certain energies and in this case use is made of the reaction of the YB isotope with
thermal neutrons which results in the production of one helium and one lithium ion for each boron that undergoes
21 Table 2.l1.--Diverse applications of etched particle tracks
Science Application
Anthropology Age of Bed , Olduvai Gorge. Age of man-made glasses. Uranium in fossil bone.
Archaeology Uranium content of ancient glasses.
Astrophysics Ultraheavy cosmic rays: abundance measurements. Detection of Pu in early solar system.
Avionics Flight times and altitudes of birds.
Biophysics Size, count, and identify bacteria, viruses, and other small
particles.
Botany Distribution of boron in leaves.
Cosmic Ray Physics Identification of heavy cosmic rays. Energy spectrum of heavy solar flare particles.
Chemistry Distribution and quantity of fissionable elements [or those with (n,a) reactions] (U, Th, Pu, Li, B, N, 0).
Cytology Isolation of malignant cells.
Elementary Particle Physics Magnetic monopole searches.
Geochemistry Distribution in nature of U, B, Li.
Geochronology Fission track dating.
Geophysics Measure rate of ocean bottom spreading in N. Atlantic. Membrane Physics Flow behavior in fine holes.
Metallurgy Locate impurities and boron-rich precipitates in metallurgical structures.
Meteoritics and Selenology Erosion and ablation of meteorites. Early chronology and thermal history. Surface exposure times on moon. Accretion, erosion, and stirring on the moon.
Nuclear Physics High resolution particle identification. Study heavy particle
reactions. Measure cross-sections, lifetimes. Spallation studies.Radiation Biology Heavy particle exposure of astronauts.
Solid State Physics Neutron-sensitive plate for neutron diffraction studies.
Defect identification, channeling, and blocking studies.
Nature of particle tracks in solids.
Superfluidity Test understanding of suverfluid rock through small, uniform holes.
Superconductivity Behavior of fine wires of known geometry.
Solar Physics Energy and composition of solar nuclei.
Accelerator Engineering Beam attenuator for Superhilac.
Alloy development Structure of new superconducting alloys.
Altimetry Integrating barometer.
Dosimetry Count neutrons, protons, heavy particles.
Environmental studies and Aerosol filtration. Personnel radiation dosimetry. Personnel Radiation Protection dosimetry in space. Nuclear detonation detection. 2®Pu
detec-tion in bone, urine, etc. Uranium measurements in water
supplies. Tracer studies on sewage distribution in ocean waters,
Filtration Nuclepore filters for cytology, bacteria removal, etc.
Gem diamond manufacture Boron and nitrogen distributions mapped in relation to color.
Imaging Neutron, proton, and heavy ion radiography.
Medical technology DeBlois-Bean virus counter; diagnostic radiography.
Nuclear engineering Leak detection in fuel rods. Neutron dosimetry. a-Radiography to give Pu-U distribution in fuel rods. 2?*Pu particle size
analysis.
fission. If the ions are allowed to impinge upon an appro-priate plastic detector before they have lost too much
energy, then they leave a damage trail in the plastic
identifiable by subsequence chemical treatment.
The plastic detectors have to be insensitive to
other radiations such as gamma and beta rays and neutron radiations. A number of plastics have found suitable as
detectors for low energy a-particles and the best include cellulose nitrate and cellulose acetobutyrate (CAB). In
general, the sample is mounted and polished and then placed in close contact with a film of plastic detector. The
assembly is heated and then exposed to a suitable source of thermal neutrons. Then the film is removed and etched
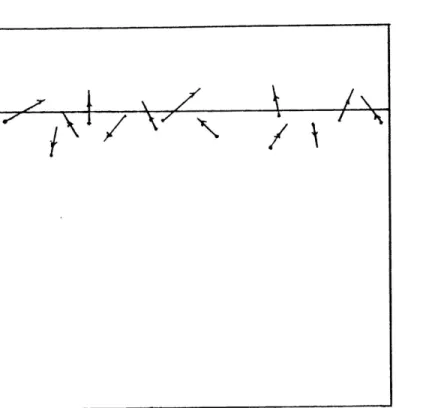
to reveal the tracks. Figure 2.2 shows the paths of the
o-particles.
This technique has found many applications in physical
and mechanical metallurgy and also in nuclear materials research. Boron segregation to grain boundaries and its
precipitation have been successfully studied by using this
sechnigue. (Fo-21) Another application is quantitative
analy-sis of boron in solids, (22) which is based on track density
measurement in the plastic film. Track density is directly
proportional to the boron content of the material. The best accuracy is * 10% for concentrations of boron greater than
30 ppm. The errors are larger at lower levels of boron (due to the increasing background).
23
—
Figure 2.2.--a-particles with their paths at
specimen-plastic film interface.7
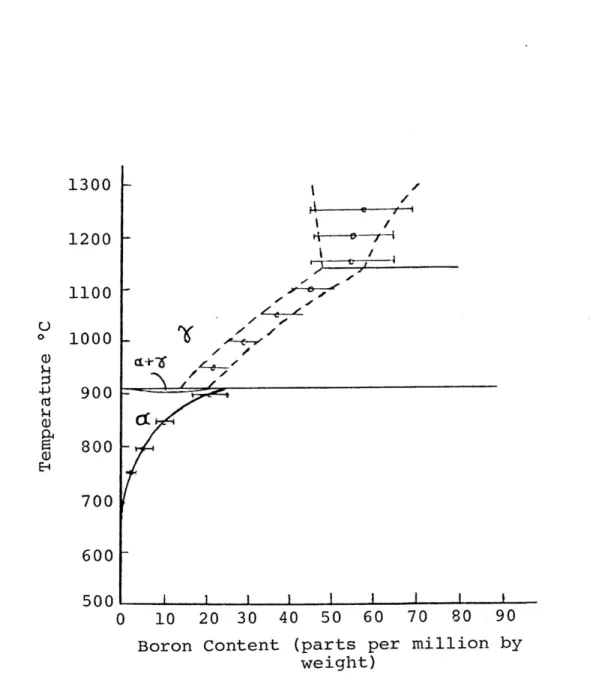
Recently, boron autoradiography has been adopted as the major analytical tool in a collaborated projected with the University of Cambridge to determine the solubility of
boron in high-purity iron. ¢%3) The results are shown in Figure 2.3. The work has been extended to determine the effect of other interstitial elements on boron solubility
2.2 Helium Ion Formation
Natural boron contains 18.8 % YB and 81.2% “YB. The lighter isotope reacts with thermal neutrons with a high cross-section of 3840 barns. The boron fission reactions
ave 29.
93.7% == 'Li; (0.83 Mev) + "He, (1.48 Mev)
By. + in,
6.33 == ‘Li; (1.01 Mev) + “He, (1.79 Mev).
So, in a constant thermal flux, the change of boron-10
con-centration with time is
dc
B _ _ A .
at =~Cs©=Op)
where deh is the thermal neutron flux, d is the reaction cross-section, and Cy is the concentration of boron-10 in
the sample. If Cy is the initial concentration of boron-10,
the concentration of boron-10 at time t is
Cy = Cp exp(- da - Ap t) : 2¢
(L
25
1300 | |
$commmiiios
\ / 1200 eyI
1100 }
$1000 I.
0)o. 900
-L800;
Ei700 |
600 |
soob—© cavttb O 10 20 30 40 50 60 70 80 90Boron Content (parts per million by
weight)
Figure 2.3.--The solid solubility of boron in high-purity iron as determined by boron autoradiography.
26
(5
(4
(5
(6) And, if Ng is the initial number of boron-10 atoms, the
number of boron-10 atoms at time t is
Np = Np exp(- d Sep t) ™)
and the number of oa-particles produced is
Ny = Np|1 - exp(- a + bey, t)] 7)
For all of the boron autoradiography experiments, the product of 4d - Pip « t is much less than unity, so the number of a-particles can be approximated by
N, "8g ¢& oy )
The track density, o,. in the plastic detector ispropor-tional to the total number of YB fissions which have taken place; thus the track density can be presented as
\ #4 Moy ®t =
where K is a constant which can be experimentally measured
for different materials. In addition to a-particles, lithium
ions make some contribution to the track density.
Fortunately, only three other naturally occurring
isotopes have significant n,a cross-sections for thermalneutrons, namely °Li, 0, and #S, which generally give no
significant contribution to p,. On the other hand, major27 fast neutrons, thus for radiography experiments, the fast component of the neutron flux has to be kept as low as
possible.
The range of the 1.48 and 1.79 Mev oa-particles have been calculated in different materials, using those methods in conjunction with the known range of these particles in air (23) (0.73 and 0.88 cm, respectively). From the results, it appears that the average range of a-particles produced from boron-10 fissions is about 2.4 ym for steels. The range is about 1.2 um for lithium particles.
2.3 Diameter of the Damaged Zone
Characterizing the extent of the most intensely damaged region of the core is an important step in the
understanding of the nature of a particle track. Transmission electron microscopy gives upper limits on the diameter of the
region of intense damage along fission particle tracks. TEM observations give a value of nv 50 R for mica. ‘29 The most
detailed and quantitative evaluation of diameters come from
measurements by C. P. Bean and co-workers of electrical
conductivity across thin detector membranes while transverse particle tracks are being etched through them. Typical
results on mica give a radius of 33 R. The same technique
28
L haw.
2.4 Track Formation Mechanism
Particle tracks are narrow, stable, chemically reactive centers of strain that are composed mainly of displaced atoms rather than of electronic defects. They are not formed in good electronic conductors. Any detailed theory of how tracks form must fit this information.
2.4.1 General Description of Heavy Ion
Energy Depositibnin Solids
A fast atom of atomic number z moving through a solid
would rapidly become an ion by being stripped of all or some portion of its orbital electrons. This stripping is a result of interaction of the electrons surrounding the moving atom
and those around the atoms that make up the solid. From these
interactions the ion gets a net positive charge z*, an
empirical form for which is given py 12%)
z* = z[1l - exp(l - 130 g8/z%3)] 7)
where RB is the speed v of the ion relative to that of light. In moving in the solid, the ion undergoes two types of colli-sions; at high speeds, where z* % z, the dominant interaction
is the electrical force between the ion and the electron.
This force either 1) excites electrons to higher energy
levels or 2) loosens them from their atoms and ejects them.
In any solid process (2), ionization creates charge centers.
The ejected electron, called a delta ray, can produce further
2
original or primary ionization and excitation occur close to the path of the ions while the secondary ionization and
exci-tation are spread over larger radial distances from the core of the track.
When an ion slows down in passing through the solid, atomic collision becomes important. Below Vv 50 Kev/amu atomic
collisions become the more dominant mode of energy loss. Many
theories based on the partition of energy into atomic and
electronic stopping have been developed. 29)
It is important to know the relative importance a) of the primary damage that results from the excitation and ioni-zation caused by heavy ions and b) of that part of the
secon-dary damage that is caused by delta rays during their passage
close to the path of the ion. For inorganic solids, such as detectors, the secondary effects of delta rays are unimpor-tant, and primary ionization appears to be the major source
of track damage.
For plastics, such as cellulose acetate butyrate, the
effect of delta rays cannot be neglected. It has been shown
by different measurements and calculations that the damage-track-radius is ~~ 100 to 200 R, well outside the region of primary excitation and ionization. It is not known definately
what the relative importance of primary ionization is for polymers, but it is probable that both primary and secondary ionization contribute in the polymers and consequently will
need to be considered in a complete theory, which is not
wy
}
developed yet. Primary plus secondary damage cheery 3% has
given a promising set of calculations which has started to provide a complete theory about the energy distribution around a particle track. This theory has found that the proportion of energy loss in primary processes is about 40% of the total at 1 Mev/amu and diminishes monotonically with increasing energy to 30%, 25%, and 20% at 10 Mev/amu, 100
Mev/amu, and 1000 Mev/amu, respectively. A book by Fleischer
et ar. (I) gives more details about track formation mechanisms and the different theories suggested.
2.5 ExperimentalProcedure
Specimens for examination were as small as possible, generally 3 x 3 x 0.2 mm, to minimize the total radioactivity
induced in them. They were mounted in fully cured bakelite, which has a very low neutron-absorption cross-section, is
insoluble in methyl isobutyl ketone, and can withstand a
temperature as high as 150°C. If the bakelite was not fully cured, the films adhered tenaciously to it. The specimens were then polished by standard metallographic polishing proce-durec.
The plastic detector was cellulose acetate butyrate
(CAB) with 17% butyryl content, bought from the Aldrich
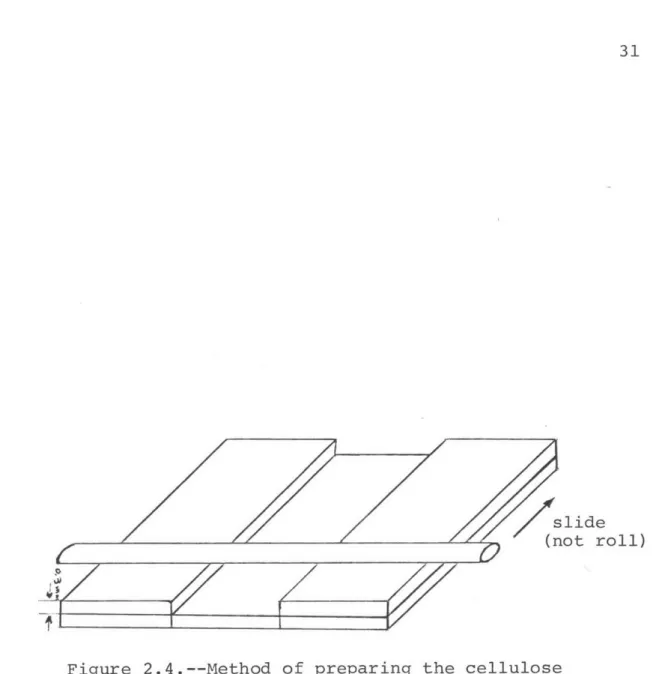
Chemical Company. The film was prepared from a 20 wt./wt. % solution of CAB in methyl ethyl ketone. A pool of solution was spread across a carefully cleaned microscopic slide by
means of a clean, dry rod, as shown in Figure 2.4. The rod 3C
a
Pr slide
{not roll)
6
L-Figure 2.4.--Method of preparing the cellulose
acetate butyrate film.
2
was pushed, not rolled, across the slide, producing flawless
film less than 50 pu thick when dry. The film was dried in a horizontal position in a dust-free desiccator.
When dry, a small area of film was cut and detached
from the slide. Then it was applied to the specimen surface using a minimum amount of methyl isobutyl ketone to give a
good contact. The upper surface of the film was not wet with
methyl isobutyl ketone as a perfect surface facilitated inter-pretation. A preliminary replication was performed to remove dust particles and clean the surface. The film on the
speci-men was dried in a desiccator. The assembly was then heated at 145° + 2°C for at least one hour. Specimens (in poly-thene capsules) were then irradiated in' 2pH2 facility of MITR-II. This facility has a thermal-neutron flux of 8.11 x 10"
n/sec » cm? and a very high ratio of thermal-neutron to fast-neutron flux
(thermal: fast3x10%). The temperature in the facility is ~v 42°C. After irradiation the specimens were soaked in
dis-tilled water for a few minutes in order to remove the CAB
film from it easily and without damage. For development, the
film was floated image-side down in 50% KOH at 50°C for 5-30 minutes.
The film was washed in distilled water and dried, then it was mounted under cover slips held in position with
adhesive-paper tape. The film was then directly examined
in an optical microscope. Tracks were visible with a resolu-tion of ~ 1.5 um. But this resoluresolu-tion was not high enough
-LN
Ps
for splat cooled 316 stainless steels which had a grain size
of v 2 uy. Thus use of transmission electron microscopy and
scanning electron microscopy was considered to be helpful for
better resolution. For study in an SEM the film was shadowed with a layer of gold which had a thickness of ~ 300 &. The
film was then studied in an SEM which gave a fission track resolution of ~ 0.7 u.
The film was too thick to be directly examined in a
TEM, but when it was dissolved overnight in methyl ethyl
ketone, a sufficiently thin replica (probably of cellulose) remained. Thus was formed by a complex reaction at the
plastic surface in contact with alkali. After rinsing with
fresh solvent the cellulose replica was picked up on a
general EM grid and examined at 2-20 K magnification at 100 Kev. The replica was not stable enough in the electron
microscope but we were able to get good images of the tracks. Stability and ease of handling were increased, however, when the etched surface of CAB film was coated with 300 R of gold
or carbon by normal evaporation techniques before dissolution of the CAB film. A fission track resolution of 0.3 yu was achieved by using TEM.
CHAPTER 3
ELECTRON MICROSCOPY OF THE SPECIMENS
3.1 Direct Examination of Specimens
The electron microscope is a well-established research tool which is used to study the microstructure
of various alloys and materials. Studying of splat cooled 316 SS made it necessary to use different electron microscopy
techniques. In the early stages of this work, TEM indicated the presence of precipitates not only on grain boundaries,
but inside grains. It was not possible to get a clear
dif-fraction pattern because of the small grain size of the
samples which resulted in severe line broadening; the amount
of precipitated phases was on the low side.
Scanning transmission electron microscopy (STEM) was tried next. A Vacuum Generator Model (VG HB5) was used. This
microscope is a powerful instrument with different
micro-analysis attachments. Energy dispersive X-ray micro-analysis
permits the semiquantitative analysis of small volumes of a specimen by analysis of X-rays emitted when the electron beam strikes the specimen. With the microscope operating at
100 Kv, the technique is capable of detecting elements with atomic numbers z, greater than 10. The technique failed to detect boron (z = 5) in the precipitates which we ultimately
wish to characterize. However, it was able to detect other elements such as S and Si in some of the precipitates.
3.1.1 Specimen Preparation
The requirements for a crystalline electron microscope
specimen are simple; it should be approximately parallel
sided, thin (usually 500-5000 RA), and have a clean surface.
The last requirement is particularly important for, apart from
the obvious disadvantage of having a thin layer of nonrepre-sentative material on the specimen surface, such surfaces show
no contrast and can reduce the transparency of a specimen due
to strong diffuse scattering of the electrons. 31) The most
widely used method for specimen preparation is
polishing, which has been used in this research. The electro-polishing solution consists of an oxidizing agent and a
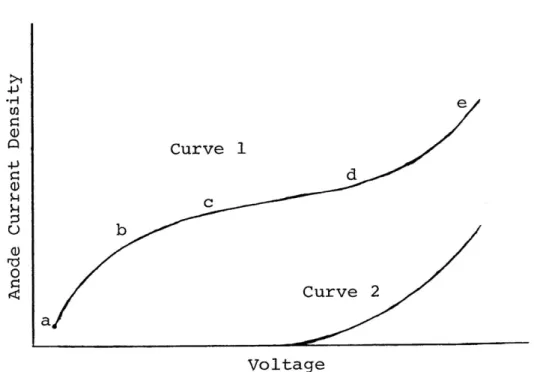
solvent for products of oxidation. The basic curve describing the performance of an electropolishing solution is shown in
Figure 3.1. The part of curve 1 from a to b is associated with attack at the most reactive points on the anode. The segment cd represents the polishing plateau, where the anode rapidly develops a high polish. On the length de the polishing action
is still maintained but the smoothness of the specimen tends to be damaged by gas evolution at the anodes which causes
pitting of the specimen. The electropolishing used in this research was carried out on the plateau of curve 1.
The electropolishing solution and operating conditions
for 316 SS are given in Table 3.1. The low temperature of
36 - la VE by >
+
;
a oe Cur~ra J¢
Ko
z Curve 2
at
Voltage
Figure 3.1.--A schematic illustration of voltage/
current curve for a typical electropolishing solution with
37
Table 3.1.--Electropolishing conditions for 316 SS
Electropolishing solution: buthanol 150 cc methanol 250 cc
perchloric
acid 20 cc Temperature: T = -50°C to -40°C
Voltage: V = 22-24 v
Time for polishing
each specimen: t = 5-10 minutes
v =50°C was attained by using a mixture of dry ice and acetone. After electropolishing, each specimen is washed in methanol and then dried on the filter and kept in a
desiccator.
3.2 Particle Extraction Technique
Selective extraction of phases is a well established
technique for the study of precipitates in materials. In
this technique precipitates are extracted from the surface
of a specimen and relocated on a carbon replica; then this
replica is examined in an electron microscope. Because of various instrumental attachments on the STEM, this microscope was selected. Again the energy dispersive X-ray analysis was
not able to detect boron in the particles. Therefore we
tried electron energy loss spectrometry. The energy analysis of transmitted electrons gives an electron energy loss
38
The technique has been able to detect boron in boron
altriae 3 which contains about 40% boron. This technique
is a new one at MIT and is still under development. NO measureable boron signal was observable above the rather
large background from the edge of the peak which contains electrons of the incident energy.
3.2.1 ExtractionReplica Preparation Technique
The specimen (316 SS) was mounted in bakelite and
then polished by standard metallographic polishing procedures.
The specimen was then slightly etched in Kalling's Reagent(5 grams CuCl,, 100 cc HCl, 100 cc Ethyl Alcohol, and 100 cc
Distilled Water). The etching solution etches the matrix while precipitates may remain unetched. The specimen was
then dried and shadowed with a ~ 300 & thick carbon film
using a conventional vacuum evaporation technique. The
carbon-shadowed specimen was then dropped in Kalling's
Reagent, specimen side up. When the carbon film started to separate, the specimen was removed from the etching
solution and dropped into distilled water. The carbon films which retain the particles and replicas of the surface of the
sample were taken from the water, while being supported on
general E.M. grids. The samples produced by this method were studied by STEM using electron energy loss spectrometry.
CHAPTER 4
RESULTS AND DISCUSSION
The work has been concentrated on reactor grade 316
austenitic stainless steel with various boron contents, mainly with 100 and 500 appm boron. This material was
obtained from the Hanford Engineering Development Laboratory.
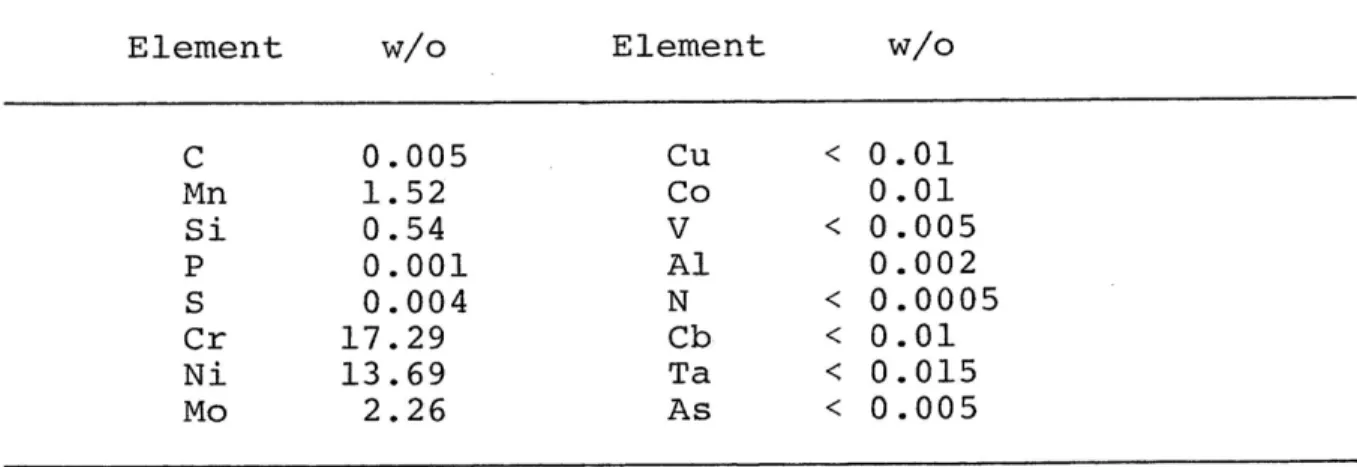
The chemical composition of this alloy is given in Table 4.1.
Table 4.1.--Chemical composition of alloy used (316 SS).
Element a Element Ce C 0.005 Zu . 0.01 Mn 1.52 Co 0.01 Si 0.54 AY . 0.005 P 0.001 Al 0.002 S 0.004 N { 0.0005 Cr 17.29 Cb 0.01 Ni 13.69 Ta . 0.015 Mo 2.26 As « 0.005
The material was melted and the desired amount of boron was
added to it. After being remelted several times to get a uniform distribution of boron, the alloy was quenched from
the melt with a cooling rate of ~ 10°°C/sec, using the piston and anvil technique. The splat cooled samples had a thickness
of v 0.5 mm and a diameter of v 5 cm. From splat cooled materials produced in this way, specimens for electron
W/GC W/O
40 microscopy, the extraction technique and boron autoradiog-raphy were made and studied.
4.1 Results of Electron Microscopy
All splat cooled specimens were found to have a grain
size of about 2 uy. Samples with 100 and 500 appm boron were studied. Some work was also done on commercial 316 SS with
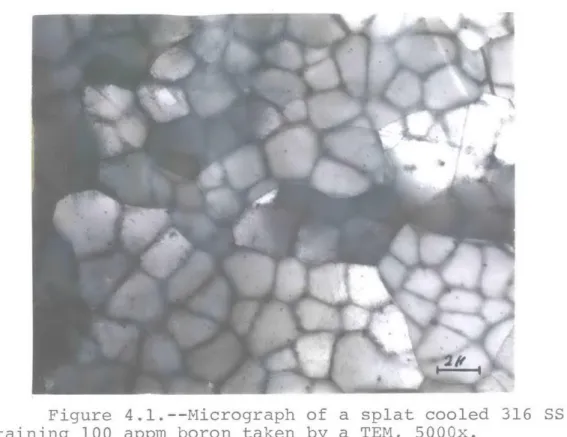
0.5% boron. The microstructure of splat cooled 316 SS with 100 appm boron content is shown in Figure 4.1, and the typical
energy dispersive X-ray analysis of this alloy is shown in Figure 4.2. Different peaks correspond to different elements
in the alloy, namely, Si, Mo, Cr, Mn, Fe, and Ni. As can be
seen, boron and carbon because of their low atomic weight, and minor elements because of their low concentrations, are not
detected. The presence of precipitates is easily seen in
Figure 4.1. This is the case for all three different samples.
In order to study and detect these precipitates STEM was used. The results can be summarized as follows:
1). Splat Cooled 316 SS + 100 appm B
At least two different precipitates were found. Bright field and dark field STEM images of the specimen
are shown in Figures 4.3a and 4.3b, respectively. The size of the precipitates are as large as 1500 A. All precipitates
are rich in Si and Ti. Those which are bright in dark field
images are also rich in Cr. In both precipitates Fe, Cr, and Ni are the major elements. The major difference between the
41
Figure 4.l1.--Micrograph of a splat cooled 316 SS containing 100 appm boron taken by a TEM, 5000x.
Figure 4.2.--Distribution of elements in 316 SS: 1) Si,
2) Mo (La), 3) Cr (Ko), 4) Mn (Ka), 5) Fe (Ka), 6) Fe (KB), 7) Ni (Ka), 8) Ni (KB), and 9) Mo (Ka).
)
Figure 4.3.--STEM micrographs of splat cooled 316 SS
with 100 appm B: a) bright field image, 5000x; b) dark field
image, 5000x.
4 =
two kinds of precipitates comes from their chromium content.
The first type of these precipitates has more chromium.
"igure 4.4 shows energy dispersive X-ray analysis of the first kind of these precipitates. The six highest peaks
represent Mo, Cr, Mn, Fe (K,,), Fe (Kg 1)» and Ni. These
precipitates are found inside grains as well as on grain
boundaries.
2) Splat Cooled 316 SS + 500 appm B
Samples with 500 appm B have fewer precipitates than samples with 100 appm B. The precipitates are smaller too,
with a size not greater than ~ 1000 A. Bright field and dark
field STEM images of a small part of the specimen are shown in Figure 4.5. Two different types of precipitates were found which are identical in Cr, Fe, and Ni content. Dark
precipi-tates (in bright field) have more Mo than bright precipiprecipi-tates; both precipitates have significant amounts of Si and probably
S in them. Also, an individual large precipitate (v 0.3 u)
was found which was very rich in Si. This type precipitate, which was very rare, is probably a silicate.
3) Splat Cooled 316 SS + 24500 appm Boron
In this alloy, boron exists as a major alloying element (0.5 wt. %). In addition to precipitates similar
to those found in specimens with 100 and 500 appm boron
content, very small precipitates with a thickness of ~~ 200
1
Figure 4.4.--Distribution of elements in a precipitate
for 316 SS sample containing 100 appm B: 1) SiKy, 2) MoLg,
3) MoL,, 4) TiK,, 5) CrK,, 6) MnK,, 7) FeK,, 8) FeKg, 9) Nik,
Figure 4.5.--Bright field (a) and dark field (b) STEM micrographs of splat cooled 316 SS containing 500 appm B,
100000x.
46
These precipitates are completely different from those in specimens with 100 and 500 appm B. Bright field STEM images
of a small section of the specimen can be seen in Figure 4.6a. Figure 4.6b shows the result of energy dispersive X-ray
analysis of these precipitates. They only contain Mo, Cr,
Mn, Fe, and Ni. Chrome and iron are the major elements in
the precipitates, corresponding to the two highest peaks. These precipitates are very probable to be boride or boro-carbide. These small precipitates were not found in the
splat cooled specimens with 100 and 500 appm B.
All three different specimens have large similar precipitates with Ti and Si in them as well as Cr, Fe, and
Ni. The only important difference comes from high boron concentration of 24500 appm (0.5 wt. 2) which has resulted in small precipitates rich in Fe and Cr.
4.2 Particle Extraction Method Results
Work has been done on the splat cooled specimens with 100 and 500 appm boron using the STEM and its important attachment, electron energy loss spectrometry. The technique has difficulties in detecting light elements such as boron but it has been able to detect boron in boron nitride (32) (which contains 44% boron). Many precipitates were examined but no boron peak was observed. Microscopic structure of a replica from splat cooled 316 SS with 500 appm B is shown in Figure 4.7. The precipitates are dark in bright field image and
“7
Figure 4.6.--a) STEM microstructure of splat cooled
316 88 + 0.5 wt. % B, 100000x%; b) X-ray analysis of
precipi-kates on grain boundaries.:1IMoKky 2)CrKx 3)MnKg 4) FeKy
5) FeK, 6)NiK, 7)NiK,
Figure 4.7.--STEM microstructure of an extraction
replica of 316 SS with 500 appm B, 50000x; a) bright field,
b) dark field.
49
2 5 ;
ne 2u 3u
bright in dark field image.
4.3 Boron Autoradiography Results
Specimens with 100 appm B and 500 appm B and 0.5 wt. % B were studied. Those with 100 and 500 appm B were splat
cooled samples with Vv 2 um grain size, but specimens with
0.5 wt. % B were conventionally cooled from melt in air,
resulting in a grain size of 10-25 um.
4.3.1 Dependence of Fission ParticleTrackSize
onEtching Time
TEM gives the opportunity to study the effect of
etching time on track size. Heat treatment of the plastic
film and specimen assembly has also some effect on track size. A two hour heat treatment at 145 + 2°C was determined
to be a good combination of time and temperature. Using this heating condition different etching times were used to study the dependence of track size on etching times. The results
are shown in Table 4.2. The etching temperature is 50 + 2°C.
Table 4.2.--Variation of damage track size with etching time.
Etching time (min)
Track size (um) under-etched under-etched under-etched
Etching time (mim) 19 "a ca
Track size (um) nv 0.2 0 nv 0.6 1 v9.8
145°C and a 10 minute etch at 50°C are a satisfactory
combi-natinn.
4.3.2 Track Density
Track density depends on two important parameters. boron concentration and thermal neutron fluence. Track
density can be easily found by counting the number of tracks
in a selected area. The linear dependence of track density
on the product of Npoept was apparent. The relation can be
expressed as
0. = 8 x 10⁷% Noo, yp * (tracks/cm?) .
Ng is the boron concentration (appm). This result is
consis-tent with other results. 1%)
4.3.3 Boron Distribution
Boron distribution using plastic replicas was studied
by optical microscopy, scanning electron microscopy, and
transmission electron microscopy. First, an optical
micro-scope was used to study boron distribution in the splat cooled samples. Because of the limited resolution of the optical microscope (nv 1-2 uy), it is apparent that we see a uniform boron distribution in such a microscope for splat cooled specimens. Figures 4.8 and 4.9 show the distribution of boron in samples with 100 appm and 500 appm boron,
respec-tively. The resolution of ~ 2 py is a good one, if the grain size is much larger than 2 py. In this case, boron distribution
51
Figure 4.8.--Boron autoradicgraph of splat cooled 316
SS with 100 appm B taken by an optical microscope. The fluence
ig 9.6 % 10¥n » em™2, 500m.
Figure 4.9.--Boron autoradiograph of splat cooled 316
SS with 500 appm B taken by an optical microscope. The fluence
57 can be easily studied. The result on 316 SS containing 0.5
wt. % boron which has been cooled in air is shown in Figure 4.10 at two different magnifications. Boron segregation to
grain boundaries is clearly demonstrated.
A much better resolution was obtained when an SEM was used. Figure 4.11 illustrates boron segregation to grain boundaries in an air cooled 316 SS containing 0.5 wt. % boron. The conditions are the same as those used for boron
autoradiographs in Figure 4.10. The track size is less than 0.7 yu and the minimum distance between two distinguishable
tracks is nv 0.5 py which is considered to be the resolution
of the SEM. The plastic replica is unstable in the SEM
especially at high voltages. This difficulty limits the
resolution because the optimum resolution is obtained at
the highest voltage.
A resolution of ~ 0.3 py is obtained if a TEM is used. In the TEM, specimens are more stable than in the SEM, but still there is some instability especially at high
magnifica-tions. Figure 4.12 illustrates boron autoradiographs of the same sample used for Figure 4.11. Another air cooled 316 SS specimen containing 0.5 wt. 2% boron was irradiated for only
30 sec and the plastic detector was etched for 10 min in 50%
KOH at 50°C. Boron autoradiographs of this specimen observed
in the TEM are shown in Figure 4.13. This demonstrates boron distribution very nicely. Thickness of boron rich grain
Figure 4.10.--Optical autoradiograph of air cooled 316 SS containing 0.5 wt. $ B. The fluence is 6 x 10% n -cm™ 2%: a) 500x: b) 1000x.
4
Figure 4.11.--SEM autoradiographs demonstrating boron
distribution in 316 SS containing 0.5 wt. % boron. The fluence is 6 x 10¥®n + cm™2?; a) 1700x; b) 5000x.
Figure 4.12 .--TEM autoradiograph of 316 SS with 0.5
wt. $ B. The fluence is 6 x 10¥®n « cm™%; 5000x.
)
Figure 4.13.--TEM autoradiographs of 316 SS with 0.5
wt. 2 B. The fluence is 2.4 x 10¥n « cm™%; a) 3000x; b) 6000x. 5¢
1 boundaries is as low as 0.8 u, proving high resolution of the
technique.
With the TEM boron distribution in 316 SS containing
500 appm B was studied. Both air cooled and splat cooled samples were used. Some of the specimens were heated for 90 min at 575°C. No boron segregation was observed in any
of the specimens, even in air cooled samples with a grain
size of 10-25 pu. Figures 4.14 and 4.15 illustrate the results for heat treated splat cooled and air cooled specimens, respec-tivel--.
4.4 Discussion
Boron autoradiography proves to be a strong tool for
the study of the boron distribution in materials. CAB film can detect a-particles with energies in the range of 0.5-2 Mev. The inability of CAB to detect low energy g-particles
(Ea < 0.5 Mev) shows that resolution of the technique is
much better than the ~ 2 yp; a-particle range in steels. On
the other hand, another study 23 has shown that the particles
detected by autoradiography originate from the surface of the sample and not from a thin layer at some distance below the
surface. This conclusion shows that the resolution is very high and is in fact limited by track size, which can be as
low as 0.3 ym. Therefore, a high resolution of ~ 0.3 ym can
be obtained when a transmission electron microscope is used. This high resolution makes it feasible to study boron
distri-bution in alloys with small grain size down to ~ 2 um. As was 5°
58
Figure 4.14.--Boron distribution in a heat treated
(90 min at 575°C) splat cooled 316 SS; a) 500 appm B, 3000x;
Figure 4.15.--TEM boron autoradiographs of an air cooled, heated (90 min at 575°C) 316 SS with 500 appm B
showing uniform boron distribution; a) 9000x; b) 27000x.
)
mentioned before, the plastic film is unstable in the TEM, but
if it is shadowed with a thin layer of carbon or gold, its
stability increases. Of course, there is always a possibility to lose the sample in the microscope, therefore great care
must be exercised, especially when one is using high
magnifi-cations.
Study of stainless steels containing 500 appm B shows that no segregation is obtained even when the sample is cooled
in air. This indicates that when 316 SS containing as high as 500 appm B is splat cooled from the melt no detectable boron segregation occurs. The effect of heat treatment has to be
studied in details; however, the specimens which were heated
for 90 minutes at 575°C showed no sign of segregation, even
for air cooled samples with 500 appm B.
Direct examination of 316 SS samples and extraction replicas were made by electron microscopy but were not very successful; nevertheless, the results are in agreement with those for boron autoradiography. The presence of elements such as Si and probably S in the precipitates opposes boron
and carbon existence in them. Additional supporting evidence for low boron content in the precipitates comes from the
result of electron energy loss spectrometry which didn't detect any boron on the precipitates. These precipitates
are probably oxides, sulphides, and silicates formed by the
impurities in the specimens.
}
By using much better material with very low impurity content, one should be able to get rid of these unwanted
precipitates. An alloy made from pure Fe, Cr, and Ni might be very useful as an alloy for further study of boron doping
in splat cooled materials.
CHAPTER 5
SUMMARY
There are many materials problems associated with the development of fusion power reactors. In order to overcome these difficulties, fusion reactor conditions have to be
simulated by running different radiation related tests on
the promising materials. Current fission reactors are not capable of such simulation, therefore, researchers have used various tricks to obtain the simulation. A new trick was
presented to the U.S. Department of Energy by Professor O. K. Harling, Director of MIT Research Reactor, in which boron
doped materials are produced by splat cooling, producing
samples with very fine grains of the order of ~ 2 ym in size
and hopefully very homogeneous boron distribution. Samples produced in this manner can be irradiated in a mixed neutron spectrum. Radiation damage is produced by the fast neutrons
and helium is produced by the thermal neutrons from the “B
(n,o0) "Li reaction, simulating the fusion reactor environment. This technique is only useful if boron is uniformly distributed
in the material; therefore, this research has been carried out
to develop a technique for adequately characterizing the boron
distribution in fine grained materials.
At present, the most useful technique for boron dis-tribution study appears to be the boron autoradiography tech-nique, in which a sample in contact with a plastic detector
is irradiated in a thermal neutron environment. Alpha and
lithium particles produced from B(n,a)’Li reactions enter
the plastic film which is placed on the sample. Damagetracks are produced by the fission products. If the plastic film is etched in KOH or NaOH, the tracks will be revealed.
Then the film can be studied by microscopy. Distribution of tracks in the plastic film represents the boron distribution in the boron doped alloy. With an optimized combination of
etching time and temperature, tracks with a size as small as 0.2 um are produced. Track distribution can be studied by optical microscopy with a resolution of Vv 2 um, but if a TEM is used a resolution of » 0.3 um can be obtained. This high
resolution allows us to study boron distribution in specimens with very small grains.
By this technique, boron distribution in 316 SS with
different boron contents was studied. A very severe
segrega-tion for air cooled specimens containing 0.5 wt. % B (24500 appm) , was observed, but for air cooled specimens with 500
appm B content no segregation was observed. The result was
the same for splat cooled specimens containing as high as 500
appm B. Also, no track rich areas were observed for splat
cooled specimens. This implies that no boron rich areas exist in splat cooled samples. Figure 5.1 shows a micrograph and an
3.
Figure 5.1l.--a) A TEM micrograph of a splat cooled
316 SS containing 100 appm B, 10000x; b) Autoradiograph of
the same sample, showing boron fission tracks, 10000x.
65 autoradiograph of a splat cooled 316 SS specimen containing
100 appm B. Table 5.1 summarizes the whole autoradiographic
work which has been done on the specimens. As shown in Table 5.1, boron segregation has only been found in air
cooled 316 SS containing 24500 appm B. Also optical
micro-scope is not useful for splat cooled materials and an electron
microscope must be used for them. The optimum resolution is obtained when the plastic film is etched for 10 minutes in
50% KOH at 50°C. This resolution is ~ 0.3 ym for a TEM.
Electron microscopy was another technique, used to
study the microscopicstructure of the specimens, and especially
to study precipitates. Many precipitates were found in all the specimens. These precipitates were examined by using a
combi-nation of STEM and energy dispersive X-ray analysis. Also, extraction replicas were produced and examined by using elec-tron energy loss spectrometry. This was not completely
successful, but it supports the autoradiographic result that
there is no boron-rich precipitate (boride or borocarbide) in
the specimens. The precipitates are probably oxides, sul-phides, and silicates, resulting from various impurities in the samples.
There are several other future alternatives for the
study of boron distribution in splat cooled steels and other alloys. Electron energy loss spectrometry is under study to make it applicable to the light elements. Secondary ion mass
66 Table 5.1.--Summary of the boron autoradiographic work done on 316 SS
Boron Etching Time Content Fluence in 50% KOH
Sample (appm) Preparation (n » cm™?) at 50°C Microscope Magnification
Air cooled 1) The assembly* is 6 x 10% 25 min optical 200-1000x 1) Severe boron
segrega-commercial heated for 5 hr SEM 1000-5000x tion was observed 316SS 24500 at 145°C | TEM 2000~-20000x along grain
bounda-2) The assembly* is 2.4 x 10⁷% 10 min optical 200-1000x ries.
heated for 2 hr SEM 1000-5000x 2) A resolution of ~ 0.3 at 145°C TEM 2000~-20000x um was obtained in
TEM.
3) A track size of 0.2
um was obtained for
etching time of 10 min.
Splat cooled 1) The assembly* is 9.6 x 10% 10-30 min optical 200-1000x 1) A uniform track
dis-316 SS 100 heated for 2-5 to TEM 2000-20000x tribution was ob-hr at 145°C 4 x 10* served for both
2) The 316 SS speci- 9.6 x 10% 5-15 min TEM 2000-20000x cases. Therefore,
men is heated for to no boron segregation 90 min at 575°C 4 x 10 was observed.
and the assembly* 2) Optical microscope
is heated for 2 hr was not useful for
at 145°C these samples.
Splat cooled 1) The assembly* is 4.8 x 10% 10-30 min optical 200-1000x 1) Grain boundary segre-316 SS 500 heated for 2-5 hr to TEM 2000-20000x gation of boron was
at 145°C 4 x 10% not observed for both
2) The 316 SS speci- 4.8 x 10% 5-15 min TEM 2000-20000x cases.
men is heated for to 2) Optical microscope
90 nin at 575°C 4 x 1o™ was not useful for and the assembly* these samples
is heated for 2
hr at 145°C
Air cooled 1) The assembly* is 4.8 x 10% 5-10 min TEM 2000-20000x 1) In spite of low
316 SS 500 heated for 2 hr to cooling rate which at 145°C a x 1o™ resulted in large
2) The 316 SS speci- 4.8 x 10⁸ 5-10 min TEM 2000-20000x grain size (10-20
men is heated for to um) no segregation 90 min in 575°C, 2 x 10" was observed even for
then the assembly* the second case.
is heated for 2 hr at 145°C
*
which should be useful for boron identification. These
tech-niques with high resolution are not now available at MIT, but they will be in the near future. A combination of these
techniques with boron autoradiography should provide a very
useful tool for studying the boron distribution with a very high resolution, useful for splat cooled materials.
REFERENCES
, Hirsch, R. L., Proceedings, 1972 International Conference
on Nuclear Solutions to World Energy Problems, American
Nuclear Society, Hilsdale, Illinois (1973) : 216.
Kulcinski, G. L., Doron, D. G., and Abdov, M. A., ASTM STP 570 (1976).
3. Private communication with Professor O. K. Harling.
4. Elen, J. D., and Glus, A., J. Nucl. Mater. 34 (1970) :182. 5. Silk, E. C. H., and Barnes, R. S., Phil. Mag. 4 (1959) :695 5. Abdullaev, K. H., Gorbachev, S. K., Perelygin, V. P., and
Treitiakova, S. P., "Determination of the Geological Age of Mica by the Tracks of Uranium Fission Fragments," Dubna Preprint 3 (1966) :2961.
Stover, B. J., and Jee, W. S. S., "Radiobiology of Plutonium," Salt Lake City, J. W. Press (1972) :183.
8. Gregg, R., and Tombrello, T. A., Radiation Effects, Vol. 00 (1977) :paper 131.
9. Weller, R. A., and Tombrello, T. A., Radiation Effects, Vol. 00 (1978) :paper 022.
10. Ollerhead, R. W., Mann, F. M., Kneff, D. W., Switkowski, 7. E., and Tombrello, T. A., Physical Review Letters 36-8
(1976) :439.
11. Fleischer, R. L., Price, P. B., and Walker, R. M.,
"Nuclear Tracks in Solids," University of California
Press (1975).
12. Brownrigg, A., "Boron in Steel," J. Aust. Inst. Met. 18-3
(1973) :124.
13. Grovnes, M., J. Mat., SMLSA, 3, 3 (1968) :614.
14. Lagerquist, M., and Lagneborg, R., Scand. J. Met. 1
(1972) :81.
69
15. williams, T. M., Harries, D. R., and Furnival, F., J. Iron and Steel Inst. (May 1972) :351.
16. Hellstrand, E., Lagneborg, R., Lindbagen, P., Westin, R.,
and Ostberg, G., J. Nucl. Mat. 48 (1973):1.
17. Hughes, J. D. H., and Rogers, G. T., J. Inst. Met. 95 (1967) :299.
18. Kawasaki, S., Hishihuma, A., and Nagasaki, R., J. Nucl.
Mat. 39 (1971) :166.
19. Tanaka, M., and Kawasaki, S., J. Nucl. Mat. 48 (1973) :366. 20. Elen, J. D., and Glas, A., J. Nucl. Mat. 48 (1973) :36. 21. Hughes, J. D. H., Dewey, M. A. P., and Briers, G. W.,
Nature 223 (1969) :498.
22. Garnish, J. D., and Hughes, J. D. H., J. Mat. Sci. 7
(1972) :7.
22. Garnish, J. D., and Hughes, J. D. H., J. Inst. Met. 10 (1973) :108.
24. Derytter, A. J., and Pelfer, P., J. Nucl. Energy 21
(1967) :83.
25. Kaye, G. W. C., and Laby, T. H., "Table of Physical and
Chemical Constants," 13th Ed. (Longmans, Harlow, 1966).
26. Price, P. B., and Walker, R. M., J. Appl. Phys. 33
(1962) : 3407.
27. Desorbo, W., and Humphrey, J. S., Jr. Radiation Effects 3
(1970) : 281.
22, Heckmen, H. H., Perkins, B. L., Simons, W. G., Smith, F. M., and Barkas, W., Phys. Rev. 117 (1960) :544.
29. Linhard, J., Scharff, M., and Schiott, H. E., Kgl. Danske Videnskab. Selskab, Mat. Fys. Medd 33,14 (1963):1.
30. Fain, J., Monnin, M., and Montret, M., Rad Research 57 (1974) :379.
31. Von Borries, B., Z. Naturf. 4a (1954) :52. 32. Private communication with Dr. E. Hall.