Determining Patterns of Cancer Drug Resistance
from Autopsy Patients
by
Elizabeth E. Martin
S.B. Massachusetts Institute of Technology (2018)
Submitted to the Department of Electrical Engineering and Computer
Science
in partial fulfillment of the requirements for the degree of
Master of Engineering in Computer Science and Engineering
at the
MASSACHUSETTS INSTITUTE OF TECHNOLOGY
February 2020
c
○ Massachusetts Institute of Technology 2020. All rights reserved.
Author . . . .
Department of Electrical Engineering and Computer Science
February 1, 2020
Certified by . . . .
Gad Getz
Harvard Medical School Professor of Pathology, Broad Institute Member
Thesis Supervisor
Certified by . . . .
J. Christopher Love
Raymond A. (1921) and Helen E. St. Laurent Professor of Chemical
Engineering, Broad Institute Associate Member
Thesis Supervisor
Accepted by . . . .
Katrina LaCurts
Chairman, Department Committee on Graduate Theses
Determining Patterns of Cancer Drug Resistance from
Autopsy Patients
by
Elizabeth E. Martin
Submitted to the Department of Electrical Engineering and Computer Science on February 1, 2020, in partial fulfillment of the
requirements for the degree of
Master of Engineering in Computer Science and Engineering
Abstract
Determining patterns of drug resistance is fundamentally required for improving clini-cal outcome of cancer treatment. The ability to study multiple samples from different metastatic sites of the same patient is a clinically and analytically challenging task, which has become possible with the advent of “rapid” autopsy procedures (<10 hours from death) conducted on cancer patients through the Massachusetts General Hos-pital (MGH) Rapid Autopsy Program. The dataset of whole-exome, whole genome and transcriptome sequencing data from advanced cancer samples uniquely captures genomic and transcriptomic information from multiple lesions of the same patient for advanced study of how resistance develops on the systemic level. Additionally, previously collected cell-free DNA samples enable the establishment of both a spatial and temporal picture of cancer drug resistance and progression. Using RNA ex-pression and pathway analysis, we can also identify unique transcriptional programs and differentially expressed genes between distinct clones within one patient as well as compare genetically similar clones across patents. This thesis integrates genomic and transcriptomic data through advanced clonal reconstruction methods, as well as clinical information such as cancer type, treatment history, and lesion location and response to investigate how the patient developed resistance to anti-cancer therapy. This thesis concentrates on findings in two cohorts of rapid autopsy patients: ER+ metastatic breast cancer, with a focus on patients treated with a CDK4/6 inhibitor, and cholangiocarcinoma, with a focus on patients with FGFR2-fusions treated with an FGFR-inhibitor. In the ER+ breast cancer cohort, we identified multiple known and potentially novel resistance mechanisms in separate branches of the phylogenetic tree, often converging on distinct mutations in the same resistance genes. In cholan-giocarcinoma, we found high levels of inter- and intra-tumoral heterogeneity in several patients, with a convergence on FGFR2 activating mutations as a form of resistance to FGFR-inhibitor therapy. The richness of the rapid autopsy dataset allows us to develop a fuller picture of convergent resistance mechanisms to therapy in cancer.
Thesis Supervisor: Gad Getz
Title: Harvard Medical School Professor of Pathology, Broad Institute Member Thesis Supervisor: J. Christopher Love
Title: Raymond A. (1921) and Helen E. St. Laurent Professor of Chemical Engineer-ing, Broad Institute Associate Member
Acknowledgments
First and foremost, I would like to thank the all of the members of the Getz Lab for always providing thought-provoking insights. This project would not be the same without the work of the entire lab and all of the feedback I received through lab meetings and conversations with all of you. In particular, I would like to thank Ignaty Leshchiner, Justin Cha, Liudmila Elagina, Oliver Spiro, and Aina Martinez for working closely with me on this project and always spending the time to answer any questions I might have. I would also like to thank Kara Slowik and Brian Danysh in the lab for their organization on collecting and delivering these samples. I thank our IBM collaborators as well, for providing their input and insights during all of our meetings. Thank you to Professor J. Christopher Love for co-advising this thesis.
I would like to thank our Massachusetts General Hospital (MGH) collaborators, particularly Christopher Pinto, Christopher Chen, M.D., and Islam Baiev, for answer-ing my questions about the clinical data and providanswer-ing more information as needed to help us realize the full potential of this data set. I would also like to extend my gratitude towards Dejan Juric, M.D, Lipika Goyal, M.D., and Nabeel Bardeesy, M.D. for entrusting me to work with this incredible data and for helping me to understand the monumental effort that it takes to acquire these samples. For that, I would like to thank the entire Rapid Autopsy Team at MGH. Thank you to the cancer patients who selflessly donated to science.
Of course, none of this could have been doing without Gaddy’s guidance and dedication, which continues to inspire me every day in the lab.
Thank you to my mom, for always believing in me and always encouraging me to continue to solve hard problems. Thank you to my dad, for watching over me and giving me strength every day. And, finally, thank you to my friends, for pulling for me even in my rough moments.
Contents
1 Introduction 13 1.1 Motivation . . . 13 1.2 Unsolved Problems . . . 14 1.2.1 Thesis Goals . . . 15 1.2.2 Outline . . . 162 Heterogeneity in Cancer and Methods 19 2.1 Tumor Heterogeneity and Drug Resistance in Cancer . . . 19
2.2 Rapid Autopsy Program DNA Sequencing and Analysis . . . 25
2.3 Downstream Analysis . . . 31
2.3.1 PhylogicNDT . . . 31
2.3.2 MutSigCV . . . 35
2.3.3 Mutational Signature Analysis . . . 35
2.3.4 Clonal Separation of Samples . . . 36
2.4 RNA-Seq Analysis . . . 37
2.4.1 Dimensionality Reduction and Clustering Techniques . . . 39
2.4.2 Differential Expression Analysis . . . 41
2.4.3 Gene Set Enrichment Analysis . . . 41
3 Breast Cancer Study Introduction 43 3.1 Background on Breast Cancer Subtypes . . . 43
3.2 Estrogen Receptor Positive Breast Cancer Treatments . . . 45
4 Findings in ER+ Metastatic Breast Cancer Autopsies 51
4.1 Cohort and Hypothesis . . . 51
4.2 Results . . . 53
4.2.1 Convergent ESR1 alterations are present in several patients . 53 4.2.2 KMT2C chromatin modifier mutations exhibit patterns of clonal convergence. . . 60
4.2.3 KRAS subclonal mutations appear in several patients. . . 62
4.2.4 Intrinsic vs. Acquired Resistance . . . 65
4.2.5 Cohort Level Analysis . . . 67
4.3 Conclusions . . . 68
5 Cholangiocarcinoma Study Introduction 77 5.1 Background on Biliary Tract Cancers . . . 77
5.2 Targeted Treatments in ICC . . . 78
6 Findings in Cholangiocarcinoma Autopsy Cohort 81 6.1 Cohort and Hypothesis . . . 81
6.2 Results . . . 82
6.2.1 Patient 1939 demonstrates clonal shifts in different regions of the body . . . 82
6.2.2 Patient 1542 shows a high level of intertumor clonal heterogeneity. 85 6.2.3 Patient 1187 acquires resistance through FGFR2 binding site alterations. . . 86
6.2.4 Cohort level analysis at the clonal level identifies recurrent FGFR2 alterations, as well as potentially novel resistant al-terations. . . 87
6.3 Conclusions . . . 88
7 Conclusion 95 7.1 Contributions . . . 95
List of Figures
2-1 Clonal convergence of resistance mechanisms in cancer drug resistance,
adapted from [1] . . . 21
2-2 Clonal convergence on PTEN loss as a mechanism of resistance in ER+ breast cancer treated with a PI3K inhibitor, adapted from [2]. . . 24
2-3 Overview of CGA Pipeline [3] . . . 27
2-4 Mutect1 Variant Classification Filters [4] . . . 28
2-5 Absolute Method, adpated from [5]. . . 30
2-6 Phylogic Method, adapted from [6]. . . 32
2-7 Example Phylogic figure [6]. . . 34
2-8 Gene Set Enrichment Analysis, adapted from [7]. . . 42
3-1 CDK4/6 Inhibitors and the Estrogen Pathway [8] . . . 49
3-2 CDK4/6 Inhibitors Chemical Structure [9] . . . 49
4-1 Swimmer’s Plot with All Breast Cancer Autopsy Patients . . . 53
4-2 Swimmer’s Plot with CDK4-Treated Breast Cancer Autopsy Patients 53 4-3 Convergent ESR1 mutations: Patient 1644 . . . 55
4-4 Convergent ESR1 mutations: Patient 1035 . . . 56
4-5 Patient 1002: Pre-treatment and Post-treatment Biopsies . . . 57
4-6 Gene Set Enrichment Analysis (GSEA) in patients with ESR1 muta-tions vs. patients without an ESR1 mutation . . . 58
4-7 Expression levels (TPM values) of ER/RB1 pathway genes in 6 ER+ breast cancer patients . . . 59
4-9 Convergent KMT2C mutations: Patient 2389 . . . 62
4-10 KRAS subclonal mutations: Patient 1598 . . . 69
4-11 KRAS subclonal mutations: Patient 2974 . . . 70
4-12 Gene Set Enrichment Analysis (GSEA) in patients with KRAS muta-tions vs. patients without a KRAS mutation . . . 70
4-13 t-SNE Clustering Plots of CDK4/6 Patients . . . 71
4-14 Gene Set Enrichment Analysis (GSEA) in patients with KRAS muta-tions vs. patients without a KRAS mutation . . . 72
4-15 Intrinsic Resistance: Patient 1078 . . . 73
4-16 MutSigCV using CDK4/6-treated subclones . . . 74
4-17 Mutational Signatures LegoPlot . . . 75
4-18 Mutational Signatures Sample Activities . . . 75
6-1 Swimmer’s Plot with All Cholangiocarcinoma Autopsy Patients . . . 83
6-2 Swimmer’s Plot with FGFR2 -fusion positive Cholangiocarcinoma Pa-tients treated with an FGFRi . . . 83
6-3 Patient 1939 demonstrates a pattern of clonal shifting throughout dif-ferent areas of the body. . . 90
6-4 Patient 1542 shows a high level of intertumoral heterogeneity . . . 91
6-5 Patient 1187 acquires resistance through gaining FGFR binding site mutations . . . 92
6-6 MutSigCV using FGFRi-treated subclones from patients with FGFR2 fusions . . . 93
6-7 RNA expression clustering of ICC patients treated with FGFRi treat-ments . . . 93
List of Tables
4.1 Full Data Table with all breast datatypes, patients, and samples . . . 52 6.1 Full Data Table with all cholangio datatypes, patients, and samples . 82
Chapter 1
Introduction
1.1
Motivation
As many new cancer therapies enter the market, the field of cancer research has increasingly turned toward identifying patterns and mechanisms of drug resistance. Cancer is a disease that results from the accumulation of mutations over time [10]. Cells can accumulate many benign, “passenger” mutations over the course of a lifetime, but once a malignant, driver mutation is acquired and replicated, cells are at risk of becoming cancerous. Driver mutations are mutations that allow cells to develop a phenotype that allows for increased growth such as suppression of cell death, increased cellular replication, or dysregulation of the normal cell cycle checkpoints. While the original malignant driver mutations arise before any treatment of the disease, cancer can evolve in response to treatment in a manner that allows the cancer to continue to grow. In metastatic disease, each lesion can develop their own resistance mechanism in order to evade the effects of a targeted treatment [11]. While cancer originates from one cell and tissue of origin, once the cells acquire mutations or change their states such they can travel to other locations in the body, the disease becomes metastatic and much more difficult to treat effectively.
Curing metastatic disease involves combating resistant clones that emerge from the clonal heterogeneity among metastatic lesions that may exist prior to therapy or that evolve in response to it. Studies such as the Cancer Genome Atlas (TCGA)
have contributed to our current knowledge and understanding of primary diseases, but much is still unknown about the evolution of cancers under the pressures of targeted treatment. New studies have begun to scratch the surface of unlocking some of the possible mechanisms behind drug resistance in cancer, but much remains to be learned [12]. Chemotherapy, surgery, and radiation were the standard of care until researchers were able to develop therapies specifically targeted toward the driver of cancer.
Additionally, identifying outgrowing mechanisms of direct resistance to cancer therapy remains a challenge, since it can be difficult to determine the specific alter-ation that ultimately led to the outgrowth of the disease. Using rapid autopsy studies, it is possible to determine the genetic makeup of many lesions in the body at the time of death. It can be difficult to determine which event(s) contributed to resistance at the time of autopsy, however we can use serial blood biopsies at timepoints prior to death to examine changes in the cancer landscape on treatment [13].
1.2
Unsolved Problems
Drug resistance to cancer therapies presents fundamental problems to those working toward a cure for the disease. The unsolved problems of drug resistance in cancer include:
∙ Cancers can have intrinsic resistance to a drug or can acquire secondary resis-tance following a course of therapy or several courses of therapy.
∙ It can be difficult to distinguish where and when a malignant clone spread as a result of a specific treatment.
∙ Different lesions may have different ways of evading the cancer therapies and a single lesion can have a different mutational landscape than other metastatic lesions.
The standard of research for the problem of drug resistance and cancer hetero-geneity has been to take serial tissue biopsies pre- and post- treatment, however, this
does not allow clinicians or researchers to obtain a full picture of the disease. By only sampling single lesions, possible resistance mutations might be missed, which could affect treatment decisions. Additionally, metastatic and post-treatment samples are rarely available since standard clinical guidelines often do not recommend additional biopsy procedures because they can put the patient at greater risk than necessary. This limits the ability to observe how the treatment changes the molecular makeup of the cancer in the majority of patients.
The motivation behind studying data from rapid autopsies is to develop a more complete picture of the disease by sampling many lesions at the time of death. In this thesis, we will be examining the data taken from patient autopsies, enabling advanced analysis of disease progression until death. Tissue samples were taken from multiple lesions in the patient’s body, which allows us to analyze the genomic differences between each of the lesions. Sampling many lesions can give us a picture of how the cancer spread throughout the body. Coupling the genomic data with treatment and progression information will provide information about which clones were selected for under treatment pressure. We aim to use this data to discover novel resistance genes, which will allow new treatments and drug combinations to be pursued for cancer patients with metastatic disease.
Additionally, blood samples taken over the course of treatment include cell-free tumor DNA samples, which will provide a temporal picture of the cancer. Using this information, we can identify which clones were selected for over the time of treatment. With only autopsy specimens, it can be difficult to identify which mutations arose in response to which treatments, since all of the patients were on multiple therapies throughout their disease. The addition of cfDNA samples in our analysis allows us to develop a spatial and temporal picture of cancer drug resistance in a single patient.
1.2.1
Thesis Goals
This work will employ genomic and transcriptomic analysis methods on rapid autopsy data in order to elucidate novel mechanisms of drug resistance to cancer therapy. This research contributes to the field of drug resistance to cancer therapy as a whole, as
well as the cancer-specific fields of metastatic breast cancer and cholangiocarcinoma. This work is of clinical relevance, as we identify actionable mutations and pathway regulation mechanisms that might affect the course of treatment for future patients with these alterations.
The goal of this thesis is to expand the current landscape of drug resistance to cancer therapy through examining both the spatial and temporal heterogeneity of cancers at through cell-free DNA before death and tissue at time of autopsy. In rapid autopsies, data is collected close to the time of death, such that genetic material is not degraded. Multiple lesions from many locations in the disease are collected, allowing for the reconstruction of the migration of the different genetic clones of the cancer throughout the body. In many cases, cell-free DNA was taken from patients in the form of blood prior to treatment and death. The integration of cfDNA samples into the analysis provides a temporal picture of how the disease developed directly in response to a specific therapy can be obtained. This work will highlight muta-tional patterns exhibited in estrogen-receptor positive metastatic breast cancer and cholangiocarcinoma, respectively. Specifically, we focus on ER+ breast cancer cases treated with a CDK4/6-inhibitor, a relatively novel drug with proven efficacy, but yet unknown resistance mechanisms. In cholangiocarcinoma, we focus on the subset of patients with FGFR2 gene fusions who were treated with a novel FGFR inhibitor in order to better characterize resistance mechanisms in this poorly treatable disease.
1.2.2
Outline
Chapter 2 provides background on the state of the field of drug resistance in cancer, including previous studies done using both autopsies and cell-free DNA to examine the genomic landscape of cancer. This chapter includes a discussion of the data types present in the cohort, as well as a background on the methods and tools used to analyze each specific data type. Chapter 3 delves more deeply into the known genomic landscape of breast cancer, treatments given for breast cancer, and known resistance mechanisms to those treatments, with a focus on estrogen-receptor positive metastatic disease. Chapter 4 presents a discussion of the findings in the breast cancer rapid
autopsies, highlighting the presence of convergent resistance mechanisms in many cases. Chapter 5 provides background on the landscape of cholangiocarcinoma. The results from the rapid autopsy study in cholangiocarcinoma are presented in Chapter 6, focusing on the response of the cancers treated with a specific FGFR inhibitor. Chapter 7 concludes with the major findings of this thesis and future work.
Chapter 2
Heterogeneity in Cancer and Methods
2.1
Tumor Heterogeneity and Drug Resistance in
Cancer
The pace of cancer research has accelerated in the past decade due to the application of next generation sequencing and the development of better methods to analyze large quantities of cancer genome data. With the advent of next-generation sequencing, studying the cancer genome is more accessible and detailed than ever before. The ability to distinguish features unique to specific cancers and determine the molecular makeup of cancers has produced important new findings in recent years. The Cancer Genome Atlas project (TCGA) was a landmark study that studied cohorts of primary tumors with matched normal samples from 33 different tumor types [14]. While the TCGA greatly advanced the field of cancer research and cancer treatment in many tumor types, the study was generally limited to primary tumors and had few samples from metastatic tumors. Now that mechanisms of primary resistance to chemotherapy and targeted treatments have been identified, it is more crucial to study and understand secondary mechanisms of resistance that evolve after initial rounds of treatment and/or metastatic spread of the disease.
Each tumor in metastatic disease is likely to have some of its own distinct mu-tations [15]. The extent of intratumor heterogeneity varies between types of cancers
and presents challenges for treatment of metastatic disease [15]. Genomic instability in cancers results in the accumulation of many somatic alterations, some of which are dominant when tumors are treatment-naive. Many factors can allow for one of these smaller somatic alterations to grow out and be selected for as the dominant clone [16]. One metastatic tumor might respond better to a drug than another tumor, while yet another tumor harboring different mutations might be unaffected by the drug entirely and continue to grow and spread uninhibited. In most previous studies, it has also been difficult to determine the true extent of intratumor heterogeneity, since not all tumors are biopsied in living patients. This kind of sampling bias can lead to difficulty in distinguishing clonal mutations, or mutations shared by all lesions, from subclonal mutations, which are only present in a subset of lesions. The inability to differentiate between these two mutational populations can lead to difficulty in predicting drug re-sponse [17]. In the autopsy project, multiple lesions from each patient were sampled, which will provide higher confidence in the distinction between clonal and subclonal mutational populations.
A greater understanding of the molecular background of cancers has resulted in the advent of targeted therapies as a new standard in cancer treatment [18]. Cancer treatments historically consisted of surgeries, radiation therapies, and chemother-apy—treatments that are not typically tailored to an individual patient’s disease. While targeted therapies have had success in treatments, patients often relapse when the cancer adapts and changes in response to the drug. While targeted therapies have had success in patients, patients often relapse when the cancer adapts and changes in response to the drug. Pre-existing tumor heterogeneity plays a role in drug resistance as well. Smaller mutational subpopulations that have an advantageous resistance mu-tation can grow out in response to therapy, presenting new clinical challenges. The evolutionary patterns behind these mutational responses are unknown but have the potential to be predicted [17].
Cancer drug resistance is thought to exhibit convergent behavior, with acquired resistance mechanisms often activating the same set of pathways being targeted (Fig-ure 2-1). Pathway reactivation is one of the most commonly seen convergent
mecha-nisms of resistance. Pathways are reactivated when the original effector mechamecha-nisms that produced the cancer are re-engaged downstream of the drug target [1]. For ex-ample, the protein target of a drug can acquire secondary mutations that are in cis with the original oncogenic mutation such that the protein target is not affected by the drug and is made oncogeneic again. In the case of ER+ breast cancer, this kind of pathway activation can occur through mutations in the ESR1 gene during treat-ment with drugs targeting the estrogen pathway, such as Selective Estrogen Receptor Degraders (SERDs). This type of convergent behavior enables the original oncogenic pathway to continue oncogenic function despite targeted treatment.
Figure 2-1: Clonal convergence of resistance mechanisms in cancer drug resistance, adapted from [1]
Other convergent mechanisms of resistance include pathway bypass and pathway indifference. Pathway bypass occurs when cells recruit a parallel pathway that con-verges on the same downstream output as the pathway targeted by the drug. Path-way indifference is a different form of convergence than alternative pathPath-way activation which describes a change in cell state independent of the index oncogenic pathway that confers drug resistance despite the efficacy of the drug to its target protein. An example of cell state switching is when cancer changes subtypes over the course of treatment or when cells switch from epithelial to mesenchymal [1]. Therapeutically
overcoming this type of convergent drug resistance is still a question in the field. One field of thought is that a “dependency-based” combinatorial drug strategy might be able to overcome convergence-based resistance which would combine drugs that tar-get parallel dependencies. A drawback to this idea is that many oncogenic alterations remain poorly druggable and that high doses of combination treatments can be too toxic for patients to sustainably handle. Integrating immunotherapy into treatment regimens poses a new clinical method of treating convergent resistance mechanisms with manageable levels of toxicity [1].
Several previous studies across many cancer types have shown evidence for baseline tumor heterogeneity and the presence of clonal convergence on a resistance mechanism in response to targeted treatment. First-generation EGFR tyrosine kinase inhibitors were developed for lung cancers with EGFR mutations, however initial treatment with many of these drugs inevitably leads to drug resistance, leading to the development of second- and third-generation inhibitors [19]. EGFR𝑇 790𝑀 is the most common recur-rent alteration seen in response to these drugs, with 50%-65% of patients acquiring this point mutation, suggesting that clones with this mutation are selected for upon EGFR targeted therapy [15]. This also suggests that a drug with specific activity against EGFR𝑇 790𝑀 might be effective as a first-line therapy in patients that have this mutation present at baseline. BRAF -mutant melanomas, treated with MAPK pathway inhibitor drugs that target BRAF, show pathway reactivation through the recruitment of upstream effectors that are able to reactivate the MAPK pathway independent of BRAF [8]. In both of these cases, the cancers are able to rescue the function of the original oncogenic pathway in response to therapy. A selective tyrosine kinase (TRK) inhibitor was recently approved to treat patients with TRK gene fusions in a variety of cancer types, however patients gained off-target resistant alterations that converged to activate the MAPK pathway, such as KRAS𝐺12𝐷 and MEK amplification [20]. This is an example of the cancer adapting to activate a different oncogenic pathway in response to blockage of the original pathway.
In a study recently published about a woman with metastatic non-small cell lung cancer (NSCLC), the authors showed that her cancer adapted in response to the
ther-apies given. Upon initial sequencing, her cancer showed a rearrangement in the ALK gene, for which she was given a first-line treatment of crizotinib, the first targeted ALK-inhibitor tested in the clinic [12]. However, patients generally develop resis-tance to crizotinib within the first year or two after the beginning of treatment [12]. After showing a worsening disease, she continued to be treated with crizotinib for five months with the addition of chemotherapy. When biopsy of the lesions showed that she had developed a crizotinib-resistant mutation, she was enrolled in a clinical trial for lorlatinib, a newer ALK -inhibitor. Initially, she responsed to the treatment but months later, when the disease continued to progress, she was taken off lorlatinib. However, sequencing revealed that she had developed two ALK -resistance mutations, one of which suggested that she could again have a positive response to crizotinib. Once she was placed back on the initial drug, she showed rapid improvement [12]. This kind of disease progression highlights how cancers can mutate quickly in response to changing treatments. Most patients do not receive any on- and post-treatment biopsies that enable clinicians to respond to the changing molecular structure of the disease. Through the analysis of autopsy data with the integration of clinical data, we can reveal a picture of how cancer develop and adapt in response to the given treatments.
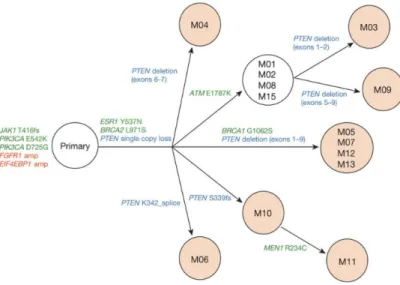
Past rapid autopsy studies have shed new light on studies of patients treated with specific targeted therapies. In a study featuring a woman with metastatic breast cancer, copy number loss of PTEN developed in lesions that grew out over the course of treatment with a PI3K𝛼 inhibitor, BYL719 [10]. After several years of treatment on aromatase inhibitors and ER antagonists, biopsy of the primary tumor showed that she harbored a PIK3CA𝐸542𝐾 hot spot mutation, which caused her to be enlisted in a clinical trial testing the efficacy of BYL719. For 9.5 months, she achieved a partial response on the drug until progression was found in the lungs, at which point treatment was discontinued. After rapid autopsy of 14 metastases, a PTEN copy number loss, an ESR1𝑌 537𝑁 mutation, and a BRCA2𝐿971𝑆 mutation were found only in the lesions that developed after BYL719 treatment. An additional PTEN𝑑𝑒𝑙339𝑓 𝑠
not in any of the other lesions that did not progress on the drug. Ten of the fourteen metastatic lesions harbored additional heterogeneous PTEN genomic alterations in addition to a single copy number loss that allowed for loss of PTEN protein expression (Figure 2-2) [10]. Using the rapid autopsy, the authors were able to identify that this cancer was dependent on PI3K pathway activation likely as a result of the clonal PI3KCA mutation present in all lesions. Upon targeted treatment with the PI3K inhibitor, lesions resistant to treatment developed PTEN loss and secondary PTEN loss-of-function mutations as an alternative mechanism of PI3K pathway activation [6]. This important subclonal mechanism of resistance could only have been identified using rapid autopsies, and highlights the enormous advantage rapid autopsies will give us in our pursuit of identifying resistance mechanisms.
Figure 2-2: Clonal convergence on PTEN loss as a mechanism of resistance in ER+ breast cancer treated with a PI3K inhibitor, adapted from [2].
It has been shown that the addition of cell-free DNA samples to a cohort of both pre- and post-treatment biopsy samples and autopsy samples enables the identifica-tion of resistance mechanisms that otherwise would have been missed [13]. In a study of 42 patients with gastrointestinal cancers, patients who had achieved stable disease or a partial drug response had liquid biopsies taken and half the cohort had matched tumor biopsies taken as well. cfDNA taken after progression on treatment identified clinically relevant resistant alterations not detected in the post-progression tumor
biopsies in 78% of cases, while only one of the 23 matched post-progression tissue biopsies identified an alteration unseen in the cfDNA samples [13]. Another patient in this study with gastric cancer underwent a rapid autopsy and had cfDNA samples taken both before and after treatment with an FGFR inhibitor. The patient showed a distinct spatial pattern of clonal expansion, with three different resistant FGFR2 kinase domain mutations present in different liver lesions and the omentum and no resistant FGFR2 mutations seen in the stomach. However, all three FGFR2 muta-tions were present in the post-progression cfDNA, highlighting the ability of cfDNA samples to present a heterogeneous mixture of driver alterations present in different metastatic lesions that are able to shed DNA at different rates [13]. Through studying the cfDNA in our autopsy cohort, we hope to both capture a fuller picture of all of the alterations in tissue that we might not have collected at the time of autopsy and to use serially taken samples to identify clones that might have expanded in response to treatment with a particular drug.
2.2
Rapid Autopsy Program DNA Sequencing and
Analysis
The Rapid Autopsy Program at Massachusetts General Hospital (MGH) is a land-mark program of its type and scale. Developed by Dejan Juric, M.D., the Rapid Autopsy Program works to harvest samples from cancer patients within 10 hours of death to preserve the quality of the tissue post-mortem such that genomic, pro-teomic, and expression data is viable for analysis [21]. We’ve collected DNA and RNA specimens from multiple lesions in each patient at time of autopsy, as well as a matched normal DNA sample from the same patient. For some patients, we also received pre- and post-CDK4/6 treatment biopsies and cell-free DNA samples taken over the course of treatment. The samples are delivered to the Genomics Platform at the Broad Institute, which extracts DNA and performs whole-exome, whole-genome, and transcriptome sequencing. We receive the aligned DNA sequences for analysis.
The DNA and RNA samples are each run through separate analysis pipelines that al-low for the identification of genomic mutations and differences in expression between genes.
From the DNA collected, we generated whole exome data (WES) from every lesion as well as whole genome data (WGS) from one cancer lesion per patient and a matched normal. Whole exome sequencing includes only the exonic, or protein-coding, regions of the genome, while whole genome sequencing provides the DNA sequence of the entire genome including the non-coding and regulatory regions. The advantage to sequencing whole exomes is that they are less expensive to sequence and they take a shorter amount of time to sequence and analyze since there is overall less genomic material in only the exonic regions. Only about 2% of the total genome codes for proteins [22]. However, variations in genes outside of the protein coding regions can have an effect on the expression of protein coding genes. WGS samples show more reliable detection of structural variants and copy number changes [22]. For our purpose, we can use WES to detect potential driver genomic events in protein-coding regions and the single WGS samples for more sensitive copy number and mutational signatures analysis.
The Cancer Genome Analysis (CGA) Group in the Getz Lab has established a state-of-the-art WES analysis pipeline that includes tools for data quality con-trol (QC) and mutational characterization of matched tumor/normal pairs [3]. The pipeline is organized into five areas of analysis: DNA sequence quality control, variant discovery, copy number characterization, variant rescue, annotation and filtering, as outlined in Figure 2-3. Here, I will briefly discuss the tools used in the pipeline as well as their outputs and uses.
Quality control of genomic data is important due to the fact that sequencing data can suffer from artifacts, irregularities, and contamination. For the DNA sequence quality control portion of the pipeline we use Copy Number QC, ContEst, Picard Multiple Sequence Metrics, and Cross Check Lane Fingerprints. An initial step in identifying potential contamination issues is ensuring that every sample comes from the patient or sample that it is supposed to, such that there were no lane or sample
Figure 2-3: Overview of CGA Pipeline [3]
swaps. The Copy Number QC tool is able to detect sample swaps or tumor-normal swaps through comparison of DNA copy number profiles of known patient samples. Cross Check Lane Fingerprints compares genotypes at common SNP sites in order to identify cross-individual sample or lane swaps [23].
Next, the pipeline ensures there is a limited amount of cross-contamination using the ContEst tool, which outputs an estimate of contamination as a fraction which is used in downstream somatic mutation calling tools [24]. DeTiN estimates tumor-in-normal (TiN) contamination to ensure that detection for somatic variants remains appropriately sensitive to cancer-specific somatic mutations [25]. The Picard Mul-tiple Metrics tools provides information about uniformity of base coverage, capture efficiency, single-base sequencing artifacts, and more metrics having to do with the quality of sequencing [23]. Several of these tools help to control for specific DNA damage artifact modes, such as 8-oxoguanine (OxoG) artifacts which arise from oxi-dation events during sequencing library prep [26]. While many of these tools are run at the initial stages of the pipeline, data QC is an ongoing process throughout the pipeline. For example, DeTiN needs variant detection as input in order to assess the amount of tumor-in-normal contamination.
The Variant Discovery part of the pipeline uses MuTect1 for the detection of single-nucleotide variants (SNVs), and Strelka and MuTect2 for detection of insertions and deletions (INDELs). MuTect1 employs a set of six filters and a panel of normal samples (PoN) filter to screen candidate variant sites and uses a matched normal sample from the same patient to identify if a mutation is germ-line or somatic [4]. Figure 2-4 depicts the Mutect1 workflow. Mutect1 is able to identify SNVs with a high level of specificity and sensitivity with a low false positive rate, which is crucial for identifying somatic mutations in cancer, where many alterations are often only present at low allele fractions and exome sequencing depth is limited [4]. Strelka uses a Bayesian model approach to detect INDELs [27]. Mutect2 independently calls INDELs using similar methods to Mutect1 based on haplotypes detected by HaplotypeCaller [28]. The Strelka-called INDELs are then annotated by whether or not they were also called by Mutect2, and the union of the results of the two methods are considered the true set of INDELs. Oncotator is then used to annotate genomic protein variants. Oncotator draws its annotations from various mutational databases [29].
Figure 2-4: Mutect1 Variant Classification Filters [4]
After the initial process of variant discovery, several other downstream filters are run on the mutation calls in order to further decrease false positives. Panel of Nor-mal (PoN) filters are used to reduce the rate of false positive calls by comparing the noise profile observed across many samples, even if no mutations were detected in the normal samples in these sites (ie. low level noise observed across many samples). In
order for this filtering methodology to be successful, there must be a large number of normal samples in the PoN [30]. We use two PoN filters, each with thousands of normal samples, to significantly improve sensitivity to remove common artifacts that arise in this way. To ensure that we are accounting for data-type specific ar-tifacts, we use different PoNs for WES, cell-free DNA WES, and WGS, since each different sequencing type presents some of its own artifacts. We also run the BLAT Realignment Filter, which applies the BLAST-like Alignment tool (BLAT) to each of the candidate mutation’s alternative allele reads in order to vet the quality of the candidate mutation [31]. If a candidate mutation is only supported by reads that are ambiguously mapped, that candidate mutation is removed. The pipeline then employs the Mutation Validator tool, which uses other data, from RNA-sequencing or whole genome sequencing, to corroborate the somatic mutation calls [32]. In the current pipeline, Mutation Validator is used to annotate the SNVs and INDELs that successfully passed through these filters, but the results are not used to further filter the variant calls [32]. Because we have additional RNA and whole genome sequencing for samples in our cohort, we can use Mutation Validator to filter mutations that are not supported by all sequencing methods.
In addition to somatic SNV and INDEL mutation calls, the CGA pipeline uses several tools for copy number characterization [3]. Copy number alterations can be important drivers of cancer, since chromosomal regions of copy gains or losses can lead to cancerous phenotypes. Copy number alterations such as whole genome duplication, loss of heterozygosity, and homozygous deletions, among others, can help drive cancer. The Allelic CapSeg tool is used to generate a segmented allelic copy ratio profile [33]. Allelic CapSeg only determines the allelic copy ratio because inferring the absolute copy number is difficult due to differing tumor purities and tumor heterogeneity in cancer samples [5]. A tool called ABSOLUTE was developed with the aim of using the segment copy ratios and mutation allele fractions to infer the absolute cellular copy number of DNA segments, as well as the number of mutated alleles at that location (Figure 2-5) [5]. ABSOLUTE produces several possible solutions for the tumor purity of the sample and corresponding copy number profiles. At this step, a
manual review is required in order to ensure that the most accurate tumor purity and copy number profile is chosen. In general, we want to have a tumor purity of greater than 5% to ensure sufficient tumor data for downstream analyses. Presence of less than 5% of tumor DNA can be detrimental to the analysis since there is too much normal sample contamination and very little signal from the cancer.
Figure 2-5: Absolute Method, adpated from [5].
ABSOLUTE is the final step of the WES CGA pipeline, and the manually con-firmed output of ABSOLUTE is used in downstream analysis. At the end of the pipeline, every mutation call must be reviewed manually in order to ensure that there are no longer any artifacts remaining in the mutation calls. While the CGA pipeline
filters are able to account for many artifactual mutation calls, manual review is re-quired to ensure that we can be confident in the mutation calls and use more sensitive tools for downstream analysis.
2.3
Downstream Analysis
After the WES CGA pipeline is run for all samples and the samples are determined to be uncontaminated and of high enough quality to continue analysis, the samples are used for more downstream and integrative analyses. We use PhylogicNDT (Phylogic N-dimensional with Timing) to identify shared clonal subpopulations across subsets of samples from the same patient [6]. MutSigCV is a tool used to identify signifi-cant cancer genes with a low false positive rate by accounting for heterogeneity in mutational frequencies across patients [34]. SignatureAnalyzer uses a Bayesian Non-Negative Matrix Factorization (NMF) method which deconvolutes cancer somatic mutation counts into a set of characteristic patterns and infers the activity of each of the discovered signatures across samples [35]. These tools gather more important information about the origins and causes of the cancer cases, as well as determine potentially novel driver mutations. These three tools are described in more detail below.
2.3.1
PhylogicNDT
Phylogic N-Dimensional (PhylogicNDT) with Timing is a comprehensive suite of tools for the analysis of subclonal dynamics in multiple samples from the same patient [6]. Cell populations from multiple samples and timepoints from within the same patient both share somatic mutations and have distinct somatic mutations unique to that sample or to a smaller subset of samples within the patient. Given several samples from different locations in the body and different timepoints over the course of treatment, we can examine the extent of intra-tumoral heterogeneity and clonal spread both over time and throughout the body. The package has several modules with the aim of providing integrative analysis on both the single patient and cohort
level [6]. For the autopsy project, we employ the Clustering and BuildTree modules in order to construct the phylogeny of a single patient’s cancer [36].
Figure 2-6: Phylogic Method, adapted from [6].
PhylogicNDT runs on several samples from the same patient using the output tumor purities, copy number profiles, and joint mutation calls from the CGA pipeline [6]. The direct input into PhylogicNDT are the ’forcecalled’ mutation call files from ABSOLUTE (ie. evidence supporting a mutation is gathered in every sample from an individual at all mutated positions detected in any of the samples). In the clustering module of PhylogicNDT, the posterior distributions on the CCF values associated with each mutation for each sample are subject to a Dirichlet Process (DP) where the distributions over the number of clusters, the CCF value of each cluster in each sample, and the assignment of mutations to clusters are sampled via a Markov Chain Monte-Carlo (MCMC) Gibbs sampler [6]. After the DP is initialized with a prior distribution, each mutation is first assigned to its own independent cluster. At every iteration of the MCMC, the sampler removes one of the mutations from its cluster and probabilistically assigns it to an already existing cluster or to a new cluster according to a multinomial probability of joining an existing cluster or forming a new cluster. The probabilities are computed against all tumor samples, or dimensions, and correspond to the expressions below:
The probability of joining each of the 𝑘 clusters, where 𝑚𝑖 is the next mutation to be clustered: 𝑃 (𝑚𝑖joins 𝑐𝑘) = |𝑐𝑘| 𝛼 + 𝑛 − 1 ∑︁ 𝑥 𝑃𝑚𝑖· 𝑃𝑐𝑘(𝑥)
and the probability of opening a new cluster:
𝑃 (𝑚𝑖joins 𝑐𝐾+1) = 𝛼 𝛼 + 𝑛 − 1 ∑︁ 𝑥 𝑃𝑚𝑖· 𝑃𝐶(𝑥)
Where the posterior of the CCFs associated with each cluster at any given itera-tion are computed from the multidimensional non-parametric CCF distribuitera-tions of mutations that belong to the cluster [6]. After completing the MCMC process and discarding the initial burn-in iterations, we calculate a posterior both on the number of clusters and the N-dimensional CCF distributions of every mutation based on the average of the CCF distributions along the MCMC chain. The multidimensional CCF posterior distributions for each mutation are then hierarchically clustered based on their similarities. The probability that a mutation belongs to a particular cluster is calculated from the CCF posteriors of the cluster and the mutation.
PhylogicNDT uses the results from the Clustering module in the BuildTree mod-ule, which constructs a ensemble of probable phylogenetic trees that demonstrate the clonal evolution of the patient’s cancer. The BuildTree module uses an MCMC Gibbs sampler that assembles likely tree structures by moving individual branches (subclones) in each iteration according to a multinomial probability of the tree branch being integrated into a specific position within the tree. This multinomial probability is calculated based on the pigeonhole principle, which states that the sum of the CCFs of sibling clones cannot exceed the value of the parent clone’s CCF. The algorithm also accounts for the uncertainty in the assignment of mutations to subclones. For example, if the new position of the clone along the tree implies a parent/child or sib-ling relationship, the concordance with said relationship can be estimated through a convolution of the posterior CCF distributions associated with the respective clusters.
The convolution CCF distribution of all children of a specific clone cannot exceed the posterior CCF distribution of the parent clone, so we use the probabilities of not exceeding the CCF distributions of the parental clones in all possible positions to guide the multinomial sampling. This procedure also orders clones in the more likely parent-child relationship based on their CCF distributions (Figure 2-6).
In the autopsy cases, PhylogicNDT is used to identify and examine the pattern of clonal spread throughout the body, tracking resistant subclones and identifying recurrent alterations that might be causing resistance in multiple subclones (Figure 2-7) [6]. With cell-free DNA samples, we can examine the clonal expansion of resistant subclones over time. In this way, PhylogicNDT will enable the examination of both spatial and temporal heterogeneity in autopsy cases.
Figure 2-7: This example Phylogic Figure shows the spatial heterogeneity of an au-topsy patient with ALK -fusion positive lung cancer treated with an ALK inhibitor. Figure is adapted from [6].
2.3.2
MutSigCV
MutSigCV was developed with the aim of identifying genes that drive cancer based on them having frequencies and patterns of mutations that are unlikely based on the background mutational processes. It was found that there is a large extent of mutational heterogeneity in cancers on the level of the tumor type, among different patients with the same tumor type, and within the genome itself [34]. Importantly, it was found that both gene expression and DNA replication timing are highly corre-lated with somatic mutation frequency across the genome. Genes that often appeared as false positives in cancer genomics studies, such as large genes and olfactory recep-tor genes, have low expression and are late replicating, while known cancer-related genes generally show higher expression levels and replicate earlier in the cell cycle [34]. Earlier methods for detecting significantly mutated genes used a single average genome-wide background mutation rate and a number of category specific mutation rates for a handful of different mutational categories. MutSigCV (Mutation Sig-nificance with Covariates) enables the accounting of gene-specific differences in the background mutation rates, as well as in different tumor categories and patients [34]. MutSigCV is used as a tool in the autopsy analysis to detect potentially novel genes that drive to drug resistance.
2.3.3
Mutational Signature Analysis
Using a Bayesian NMF method, our tool SignatureAnalyzer is able to examine mu-tational processes that operated throughout the life-history of cancers. The somatic mutational landscape of tumor cells reflects the activity of many discrete mutational processes that operate across the lifetime of each cell [35]. Mutational signatures are the patterns of base changes that are associated with these specific mutational pro-cesses that are operating in tumor cells. There are six base substitutions (C>A, C>G, C>T, T>A, T>C, and T>G) and each has 16 possible combinations of neighboring bases. Therefore, there are 96 possible mutation types, or contexts, that can be used to characterize mutational signatures [35]. Non-negative matrix factorization (NMF)
methods have been applied to characterize mutational signatures across multiple dif-ferent tumor types [37]. NMF is a matrix method that takes the matrix 𝑋 with dimensions 96 x 𝑀 , where 𝑀 is the number of samples, and factors it into 𝑊 , the mutational processes present in the cohort, and 𝐾, the number of signatures present in the given cohort [35]. Applying a Bayesian framework to this NMF addresses the issue of inferring the appropriate number of mutational signatures present in a given patient or sample [35, 37]. Applying SignatureAnalyzer to the autopsy cohort allows us to examine the mutational processes present in each patient. Identifying various mutational signatures in different patients might show that a particular signature is responsible for greater drug resistance in one patient versus another.
2.3.4
Clonal Separation of Samples
Through the clustering module of PhylogicNDT, the mutational populations of each patient can be separated into clonal clusters. Each clonal cluster has the same set of core mutations and can be present at different CCFs in each tumor sample. For example, every sample in a given patient shares a truncal clone which is present at 100% CCF in all patient samples. Due to noise, the CCF values may deviate slightly from 100%. However, each tumor sample has a unique set of clones, some of which are shared with other samples and some of which are completely unique to that given tumor sample. In order to identify drivers of resistance, we would like to ignore the cluster of mutations that represents the truncal mutations, since these include the mutations that drove the initial cancer and many other passenger mutations that accumulated from the fertilized egg. We are looking to identify genes that become significantly mutated in response to treatment, so we are not as interested in the mutations that originated the cancer in the primary tumor, which belong to the clonal cluster. Since the tumor samples contain heterogeneous tumor populations, performing analysis on the tumor clones can be more informative when looking to identify mechanisms of cancer drug resistance. Specifically, running MutSigCV on tumor clones can allow for the identification of recurrent resistant alterations. In MutSigCV, every input cluster is treated independently of the other clusters [34].
If there is a gene that is mutated across many clones beyond what is expected by change, MutSigCV will be able to detect that gene as significant.
2.4
RNA-Seq Analysis
RNA sequencing data is typically analyzed using differential expression methodolo-gies, which are used to compare the expression of given genes across sets of samples. We compare the expression of genes under two or more treatments or conditions in or-der to examine the effects of the treatment on the relative transcription of genes. For the rapid autopsy project, we generated bulk-RNA-sequencing data from most of the tumor lesions for which we had DNA data. Some samples had low quality RNA and their RNA was not sequenced. Bulk RNA sequencing data means that the RNA has come from a group of cells as opposed to one single cell. Since there is heterogeneity in the expression of a bulk group of cells, single-cell RNA sequencing can help provide clarity to analyze each different cell type in a mixture of cell populations (immune cells, stromal cells, etc). However, bulk analysis provides an equally valuable picture of the general expression profile of part of a tissue. In many bulk RNA-sequencing studies, PCA or other dimensionality reduction techniques show that samples can cluster together by a given phenotype. Properly analyzing the RNA data taken from each autopsy samples adds a transcriptomic dimension to the genomic picture pro-vided by the DNA analysis. As a first step in the analysis of the RNA data, we apply several clustering techniques in order to obtain results that show biological relevance or identify other separations in the data that might be due to external fac-tors such as batch effects or tissue bias. Principal Components Analysis (PCA) will determine which features of the samples are being pulled out as the most relevant to the clustering algorithm. Other dimensionality reduction clustering techniques used include t-Distributed Stochastic Neighbor Embedding (t-SNE) and Uniform Manifold Approximation and Projection (UMAP).
The bulk RNA sequencing data is first run through a computational pipeline which transforms the BAM files to FASTQ files, which are then aligned to the transcriptome
using the aligner STAR [38]. The conversion from BAM to FASTQ extracts read sequences and base quality scores from the BAM file and outputs them in a FASTQ format which can be used in aligners downstream. The STAR (Spliced Transcripts Alignment to a Reference) aligner is one of the most commonly used tools for the alignment of RNA transcripts to a reference [38]. For downstream analysis, we want to be able to quantify the number of transcripts of specific genes in the samples.
Once the transcripts have aligned to the genome, we use either RNA-Seq by Expectation-Maximization (RSEM) or RNASeQC to extract read counts and FPKM (fragment per kilobase parts per million mapped reads) or TPM (transcripts per mil-lion mapped reads). TPMs are essentially normalized counts, with the raw count values normalized by the known length of each gene and then divided by 1 million, to give the “transcripts per million” metric. This normalization allows for better quan-tification of the data and allows for higher confidence in comparison between samples as opposed to using read counts. RSEM uses an Expectation-Maximization (EM) al-gorithm to estimate the relative abundances of genes or transcripts [39]. RNASeQC uses a similar mapping procedure and also runs some quality control metrics on the data that account for standard biases seen in sequencing [40]. We can compare the relative counts of genes across multiple samples and patients using the output TPM values with other downstream analysis tools. However, we know that some genes are systematically overexpressed in RNA-seq data from cancer cells, such as genes that encode for mitochondrial proteins [41]. In tumors, cells are constantly going through apoptosis and mitochondrial DNA can become more highly expressed [41]. RNASeQC additionally provides quality metrics on the data, such as the overall mapping rate, the duplication rate of mapped reads, and the intronic rate [40]. These metrics are useful in quality control to ensure that the RNA is not degraded or otherwise prob-lematic such that we can trust our downstream analysis. The results of the analysis with either RSEM or RNASeQC are output for each sample with metrics for each gene, which amounts to 56,202 genes in total. From this transcript-level data, we can form a comprehensive picture of how the transcriptome changes across samples and patients.
Potential confounding factors in the analysis of the RNA data from autopsy pa-tients are the fast degradation of RNA transcripts post-mortem and the variability of expression across tissues. RNA transcripts degrade on the order of hours after time of death due to the greater instability of mRNA as compared to DNA, which can remain relatively stable after death. While the rapid autopsy team works diligently to collect patient samples, it is difficult to ensure that the RNA is not degraded beyond use at time of autopsy. Additionally, in normal, healthy people, regions in the body have differences in gene expression due to the functional differences between tissues [42]. The variability of expressed genes in different normal tissues may cause a clustering bias towards regions of the body that the samples were taken from as opposed to any other biological mechanism. For this reason, in several experiments we have labeled the data both by patient label and by location in the body to examine if the data cluster by patient or by location in the body, regardless of which patient the sample is from. If the data cluster mostly by location in the body, then further work must be done to examine the nature of this signal and account for the bias. To additionally account for possible location bias, we used a pathway-based analysis method. Genes in cancer-related pathways generally should not include any location-specific genes. Pathway-based analysis also has the advantage of highlighting sets of genes that have upregulated or downregulated expression in a cancer-specific phenotype.
2.4.1
Dimensionality Reduction and Clustering Techniques
Principal Component Analysis (PCA) is a matrix method that uses a singluar value decomposition after normalization to understand the variance in a matrix of data. PCA projects the data on a (linear) subspace that preserves most of the variation in the data. This is performed by finding the eigenvectors that have the largest eigenvalues associated with the data matrix. The first principal component is the direction that captures the largest variance in the data. Since we want to study the correlation structure in the data, an important preprocessing step is normalizing the data such that the mean of each column (sample) in the data is 0 and its variance is 1, which is called mean centering. Using PCA on all of the RNA samples from a specific
cohort or within a patient will identify the features that explain the greatest amount of variance within that set of samples. We can limit the genes used in the PCA to a specific gene set or pathway in order to identify separations between patients based on a pathway. For example, if one breast cancer patient distinctly separates from the rest of the patients when using only genes related to the PI3K pathway, we can conclude that this patient had some unique behavior of the pathway compared to the rest of the patients. We can examine the genes that are explaining the majority of this variance to conclude if this separation is based on specific biology or if it is an artifact in the data. If the separation seems rooted in biology, we must use different techniques to conclude how that patient is differentially regulating that specific pathway.
t-SNE (t -distributed stochastic neighbor embedding) dimensionality reduction is helpful to visualize the clustering of the data. t-SNE is a technique used to reduce the dimensionality of high dimensional datasets into two dimensions in order to vi-sualize the separation between points in the data [43]. First the algorithm creates a probability distribution over all the features in the dataset, such that similar pairs of data points have a high probability of being picked, and distant pairs of points have a low probability of being picked together. Then the algorithm tries to find an optimal configuration of points in a two-dimensional space such that it minimizes the Kullback-Leibler (K-L) divergence over the distributions [43]. t-SNE uses a Student t-test distribution to compute the similarity between two points in the 2D space, as opposed to a Gaussian distribution [43]. Similar to other methods, t-SNE uses gra-dient descent to optimize the clustering structure [43]. UMAP (Uniform Manifold Approximation and Projection for Dimension Reduction) is another dimensionality reduction technique. It is competitive with t-SNE for clustering visualizations and is able to preserve more of the global structure of the input data while running faster than t-SNE [44]. As opposed to t-SNE, UMAP uses the number of nearest neighbors in the graph instead of perplexity to define cluster distance. Additionally, UMAP uses cross-entropy as the cost function compared to t-SNE, which uses K-L divergence. UMAP works faster than t-SNE because it uses stochastic gradient descent, while t-SNE uses regular gradient descent [44].
In general, using these dimensionality reduction techniques, we expect each sample to be mapped closer to other samples that are from the same patient. However, the clusters might be somewhat diffused since cancer samples are generally very hetero-geneous. The relative distance between patient clusters will help to identify patients that are unique from the others in some way.
2.4.2
Differential Expression Analysis
In differential expression analysis, it is important that gene expression values are able to be compared between samples. Using TPM values normalizes for different sequenc-ing depth by accountsequenc-ing for the number of transcripts. Without this normalization step, read counts are linearly related to the abundance of the target transcript [45]. There are several R software packages that can be used in the field for additional normalization and differential expression analysis. Two of the most commonly used are DESeq and EdgeR [46]. Both DESeq and EdgeR are based on the hypothesis that the majority of genes are not differentially expressed. Both packages model the read count data using the negative binomial (NB) distribution [38]. The two packages dif-fer in their normalization methods. DESeq2 uses the median of the ratios of observed counts to estimate size factors for the normalization of each gene. This normalization method allows for DESeq2 to normalize for genes that might be particularly highly expressed and would otherwise skew the ratio of total read counts [45]. In differential expression analysis it is important to be able to compare counts from different sam-ples, which may have been sequenced to different depths. We have used DESeq2 for the results presented in the autopsy project.
2.4.3
Gene Set Enrichment Analysis
Gene Set Enrichment Analysis (GSEA) evaluates expression data at the level of gene sets, which are often organized into biological pathways or other sets of known bi-ological relevance [7]. The Molecular Signatures Database (MSigDB) maintains the largest collection of gene sets. These gene sets were curated using consensus clustering
to define a “Hallmark” gene set for several of the most well-characterized biological pathways [47]. GSEA considers data that belongs to two distinct, labeled classes and ranks genes based on the correlation between their expression and the class labels using a given metric [7]. GSEA calculates an enrichment score that reflects the ex-tent to which the genes in a given gene set are at the top of the ranked list for one labeled class versus the other. The enrichment score is calculated by walking down the list of ranked genes and adding to a running-sum statistic when genes in the given gene set are encountered and subtracting from the sum when genes not in the gene set are encountered. A P value for the enrichment score is calculated based on how often enrichment scores from a null distribution generated by permuting the labels is greater or equal to the observed enrichment score. In a final step, GSEA calculates a normalized enrichment score for each gene set to adjust the significance level to cor-rect for multiple hypothesis testing in the case where an entire database of gene sets is evaluated. A pictorial description of the GSEA algorithm is outlined in Figure 2-8 [7]. GSEA analysis on our RNA-sequencing data allows us to perform pathway-based analysis on the data and identify patterns of differential pathway regulation in two or more differently labeled or behaving subsets of samples [7].
Chapter 3
Breast Cancer Study Introduction
3.1
Background on Breast Cancer Subtypes
Breast cancer is one of the most common cancers, with over a million cases and 500,00 deaths worldwide [48]. When caught early, before metastasis, breast cancer can largely be treated with surgical resection and localized radiation. At stage II or earlier, breast cancer has a 93% 5-year survival rate for women. However, once breast cancer metastasizes, it can become much more difficult to effectively combat and the 5-year survival rate drops dramatically, to 22% [49]. Therapeutically, breast cancer is generally segmented into three different treatment subtypes: estrogen receptor (ER) positive, human epidermal growth factor (HER2) positive, and triple-negative breast cancers (TNBC). Treatments are based off of these three subtypes and clinicians use different lines of therapy to treat each different subtype of the disease. Within these clinical subtypes, breast cancers can also be categorized into four molecular sub-types: luminal A, luminal B, basal-like, and HER2-enriched. Each of these molecular subtypes shows significant differences in genomic mutations, gene enrichment, and expression profiles.
Treatment-naive triple-negative cases are negative for estrogen and progesterone receptors (ER-/PR-) and are HER2-negative. These cases account for roughly 15% of all breast cancers and are generally treated with chemotherapy. Triple-negative cases fall under the basal-like molecular subtype, showing an enrichment in TP53
mutations, high genomic instability, hypomethylation, and aneuploidy [48]. HER2-positive breast cancers encompass about 20% of all cases and are commonly treated with drugs that directly target and block the HER2 receptor, for example trastuzumab (Herceptin) [50]. Additionally, this clinical subtype can be treated with chemotherapy either as a standalone or adjuvant therapy. The combination of trastuzumab and pertuzumab targets the HER2-HER3 heterodimer. Molecularly, about 50% of these tumors are considered HER2-enriched, with a high frequency of TP53 mutations as well as a high protein and phospho-protein expression of EGFR and HER2 [48]. The other half of HER2 positive cases are luminal subtype cases, and show increased expression of typically luminal genes, such as GATA3, BCL2, and ESR1, compared to the HER2-enriched HER2+ cases.
ER positive (ER+) breast cancers are the most common subtype, encompassing 70% of all cases. ER positive breast cancers can be broken down into two molecular subtypes: luminal A and luminal B [48]. Cancers of the luminal A subtype have the best prognosis, as these tumors are most likely to retain function of the tumor suppressor genes TP53 and RB1. Cancers in the luminal B subtype are also hormone receptor positive and frequently harbor mutations in TP53 and PIK3CA. TP53 mis-sense mutations are predominant in luminal cancers, while nonmis-sense or frameshift mutations are seen more frequently in the basal-like subtype. In both luminal sub-types, PIK3CA is more frequently mutated compared to the other subsub-types, with luminal A cancers harboring PIK3CA mutations in 45% of cases and luminal B sub-types harboring PIK3CA mutations in 29% of cases [48]. ER+ cancers in the luminal A subtype frequently have 𝑃 𝐼𝐾3𝐶𝐴𝐸545𝐾 hotspot alterations. Non-metastatic lumi-nal breast cancers have the best prognosis compared to the other mRNA subtypes [51]. However, when ER+ breast cancer becomes metastatic, the five-year survival rate drops [49]. Therefore, establishing effective treatments to treat metastatic breast cancer is crucial to raise the long term survival rate in these patients.
3.2
Estrogen Receptor Positive Breast Cancer
Treat-ments
Commonly, ER+ metastatic breast cancer cases are initially treated with hormone therapy and then switched to chemotherapy once the cancers have developed resis-tance to hormone therapies. Upon diagnosis, many of these patients undergo surgical resection of the primary tumor, but the cancer can recur as metastatic disease [52]. The estrogen receptor is expressed in normal breast tissue at low levels, but 70% of breast tumors have high expression of ER and show an estrogen dependency for growth and spread [53]. These ER+ tumors generally respond well to hormone ther-apies that target this estrogen dependency. There are three main classes of hormone therapies that target the estrogen receptor in different ways. Additionally, these ther-apies are given selectively to women depending on whether they are post-menopausal or not. Selective Estrogen Receptor Modulators (SERMs) work by blocking the es-trogen receptor in cancer cells but can have different mechanisms of action depending on the target tissue [54]. Tamoxifen, a SERM developed in the 1970s commonly ad-ministered to women with ER+ metastatic breast cancer, works as an anti-estrogen in breast cells. However, it can act as an estrogen agonist in other tissues, such as bones and the uterus, which allows bone density to be maintained in these patients while antagonizing the estrogen receptor in breast and other tissue [54]. Tamoxifen is administered only to women who have not undergone menopause. This drug can increase the risk of developing uterine cancer in postmenopausal women due to its increased estrogen activity in uterine tissue [52]. Five years of treatment with Ta-moxifen reduces the annual death rate by 31% in patients with ER+ breast cancer [55].
Selective Estrogen Receptor Degraders (SERDs) block and damage the estrogen receptor in all tissues, unlike SERMs which have a greater dependence on tissue type. Fulvestrant (Faslodex) is currently the only approved SERD and is approved only for use in post-menopausal women. It is often used to treat advanced metastatic breast cancer after other hormone therapies have stopped working or in combination
![Figure 2-1: Clonal convergence of resistance mechanisms in cancer drug resistance, adapted from [1]](https://thumb-eu.123doks.com/thumbv2/123doknet/14725520.571667/21.918.341.594.430.736/figure-clonal-convergence-resistance-mechanisms-cancer-resistance-adapted.webp)
![Figure 2-3: Overview of CGA Pipeline [3]](https://thumb-eu.123doks.com/thumbv2/123doknet/14725520.571667/27.918.270.654.112.435/figure-overview-of-cga-pipeline.webp)
![Figure 2-8: Gene Set Enrichment Analysis, adapted from [7].](https://thumb-eu.123doks.com/thumbv2/123doknet/14725520.571667/42.918.221.710.683.943/figure-gene-set-enrichment-analysis-adapted.webp)
![Figure 3-1: CDK4/6 Inhibitors and the Estrogen Pathway [8]](https://thumb-eu.123doks.com/thumbv2/123doknet/14725520.571667/49.918.265.652.138.534/figure-cdk-inhibitors-estrogen-pathway.webp)


