ACRYLIC POLYAMPHOLYTE SOLUTIONS FOR PROTEIN
SEPARATIONS
by
Costas S. Patrickios
M.S. in Chemical Engineering Practice Massachusetts Institute of Technology, 1990
Diploma in Chemical Engineering
National Technical University of Athens, Greece, 1988 Subnutted to thte
Department of Chemical Engineering
in partial fulfillment of the requirements for the degree of
Doctor of Philosophy at the
Massachusetts Institute of Technology
February, 1994
e Massachusetts Institute of Technology
Signature of Author
Department of Chemical Engineering
September 29, 1993
Certified by
Professor T. Alan Hatton
Thesis Advisor
and
,i~ 7/ /~rof6ssor Peter T. Lansbury, Jr. 'I ~Thesis Advisor
Accepted by
Professor Robert E. Cohen MASSCH, UN. : Ii.eeDepa rt m e nta l Committee on Graduate Students
ACRYLIC POLYAMPHOLYTE SOLUTIONS FOR PROTEIN SEPARATIONS by
Costas S. Patrickios
Submitted to the Department of Chemical Engineering on September 29, 1993, in partial fulfillment of the
requirements for the degree of Doctor of Philosophy Abstract
AB diblock, ABC triblock and random low-molecular-weight methacrylic polyampholytes were synthesized by Group Transfer Polymerization (GTP). The solution behavior of these novel copolymers was investigated by a variety of methods including static and dynamic light-scattering, Gel Permeation Chromatography (GPC) in tetrahydrofuran, aqueous GPC, anion-exchange chromatography, steady-state pyrene fluorescence, hydrogen-ion titration and turbidimetric titration. The triblock copolymers formed micelles at intermediate pH values as a result of the presence of the hydrophobic block. While the random copolymers did not precipitate at any pH, the triblocks precipitated strongly around the isoelectric pH. It was determined that, at pH 8.5, the anion-exchange affinity of the block polyampholytes was high and that of the random was low probably due to the statistical distribution of the negatively charged residues.
The utilization of aqueous solutions of the triblock polyampholytes for protein separation by coprecipitation and anion-exchange displacement chromatography was explored. Protein partitioning in two-phase aqueous polymer systems formed by a random polyampholyte and poly(vinyl alcohol) was also performed. In coprecipitation, it was observed turbidimetrically that the polyampholyte interacted with the protein of opposite charge without any influence from the protein of the same charge polarity that was also present in the mixture. In anion-exchange displacement chromatography, successful separation and concentration of two very similar proteins, -lactoglobulins A and B, was achieved at the appropriate conditions. For the separation of ovalbumin and chymotrypsinogen by partitioning, a maximum selectivity of 10 was measured.
While homopolyelectrolytes can be used also for protein separation, polyampholytes offer the opportunity of polymer precipitation at the isoelectric point and recycling after the completion of the separation process. This constitutes an attractive process-scale
Acknowledgments
I would like to express my gratitude and appreciation to my thesis advisor, Professor T. Alan Hatton, for his support and technical guidance during these years. I am particularly greatful to Alan for his generosity with my expenses in my many research trips including those to New York, Delaware and to the AIChE and ACS conferences. Also I am very obliged for his positive response and understanding during these thesis-typing/editing days. I thank my coadvisor Professor Peter T. Lansbury, Jr. from the Chemistry Department for his ever-availability and particularly for his advice in several Chemistry issues that came up in the beginning of my work.
Financial support from the Biotechnology Process Engineering Center (BPEC) at MIT is greatfully acknowledged.
I thank my thesis committee members Dr Walter R. Hertler from Du Pont, Professor Steven M. Cramer from RPI and Professors Daniel Blankschtein, Robert E. Cohen and Charles L. Cooney from Chemical Engineering at MIT for their interest in my work. I am particularly indebted to Wally Hertler for his valuable help in polymer synthesis as well as for his subsequent continuous involvement. I hope that my work will contribute in establishing the usefulness of Group Transfer Polymerization that Webster and Hertler invented and explored. I also thank Shawn Glattfelter and Martha Heyman from Wally's lab for their help in polymer synthesis. I am greatful to Steve Cramer for providing know-how, labspace and materials for studying the polyampholytes in their most important application, ion-exchange displacement chromatography of proteins. Steve's enthusiasm for research will always be remembered.
I express my gratitude to Nicholas L. Abbott for his guidance during my first year in our group as well as his continuous help and involvement until he left Boston three months ago. I consider myself very lucky that I enjoyed the privilege of a guru of Nick's caliber.
I want to thank Dr Robert P. Foss, formerly of Du Pont, for his help with the random polyampholytes as well as his guidance in setting up the apparatus for Group Transfer Polymerization at MIT.
Although not an engineer or chemist, equally important and helpful during all these years was Carol Phillips. I want to express my love and appreciation to her.
I want to thank all the colleagues from our group, old and new. From the ones that are gone I particularly want to thank Minos Leodidis. Minos was one of the main reasons that I joined the group. Thanks also go to Ganesh Venkataraman, Patricia Hurter and Brian Kelley. From the new ones I thank Pascalis Alexandridis for his help in different issues, the many discussions we have and the papers we exchange. I also want to thank Gerald Priolaeu and Ed Browne.
I would like to thank my students, Christine J. Jang and Justin A. Strittmatter. Part of this thesis is the result of their work. Also, I would like to thank Professor Sunil Nath from lIT for continuing the polyampholyte-protein interaction studies and obtaining
some interesting and useful results.
Many thanks go to the many friends in the Department. Particularly to Abdul Barakat for our long conversations and friendship. Also thanks go to Stathis
Avgoustiniatos, Peter Kofinas, Alex Koulouris, Cliff Rutt, Gautam Nayar, Leo Lue, Brian Laffey and Mike Pomianek. Thanks also go to all the Greek friends: Babis Papadopoulos, Jorge Papadimitriou, Costas Boussios and Thanassis Tjavaras.
Thanks also go to the RPI group. Particularly to Shishir Gadam for our collaboration. Also to Amitava Kundu and Suresh Vunnum for their friendship and advice. Also I thank Joseph Gerstner for his valuable suggestions in my work there. I would like to thank my roommates in Troy, Guhan Jayaraman and Harish Iyer for their friendship and hospitality and also for our scientific discussions.
I want to thank my family in Cyprus for their support and encouragement during all the years of my graduate and undergraduate studies.
I would like to thank my companion Edna Yamasaki whose love and invaluable
TABLE OF CONTENTS
Title Page ...Abstract ...
Acknowledgments
...
Table of Contents ... List of Figures ... List of Tables ... List of Schemes ... Chapter 1. Introduction ... 1.1 New Polymers 1.2 Materials for HPLC o 1.3 New Protein Separatic. . . 1 . . . 2
..3
· .10 · .14 · .15 . .16 · .16 .17 18 eeee .e..* . *. . . . . .. . . . .*. *. . . . . *. . ®. . . . . . . .* . *. . ... . . . . .*. ********** e e . . . .e.. e.. . . . . . . . )f Biomolecules ... an Techniques Mediated by Ampholytes 1.4 Our Materials ... 1.5 Literature Cited ... Synthesis and Solution Behavior of Random and BlcPolyampholytes
...
2.1 Introduction ... 2.2 Experimental Section ... 2.2.1 Materials ... 2.2.2 Methods ... 2.3 Results and Discussion ... 2.3.1 Polymer Synthesis ... 2.3.2 Molecular Weights ... 2.3.3 Isoelectric Points ...... 19
... 21
ck Methacrylic...
26
... 26
... 31
... 31
... 32
...
35
...
35
...
36
...
36
Chapter 2. · . · . · . · . · . · . I2.3.4 Hydrogen-Ion Titrations 2.3.5 Solubility Curves .... 2.3.6 Light-Scattering ... 2.3.7 Fluorescence ... 2.4 Conclusions ... 2.5 Literature Cited ...
Chapter 3. Aqueous Size Exclusion Chromatography
Polyampholytes
...
...
37
...
38
...
39
...
41
... 42
... 43
. o . . of the Me · · · · .thacr :thacrylic...
64
3.1 Introduction ... 3.2 Experimental Section ... 3.2.1 Materials ... 3.2.2 Methods ... 3.3 Results and Discussion ... 3.4 Conclusions ... 3.5 Literature Cited ... Chapter 4. Anion-Exchange Characterization of the Methacryli 4.1 Introduction ... 4.2 Experimental Section ... 4.2.1 Materials ... 4.2.2 Methods ... 4.3 Results and Discussion ... 4.4 4.5 4.3.1 Gradient Elution 4.3.2 Frontal ExperimentsConclusions
...
Literature Cited ... .. . . . 64 ... 65 ... 65 ... 66 ... 66 ... 69 ... 69 ic Polyampholytes 76...
76
...
78
... 78
... 78
...
80
...
80
... 83
... 87
... 87
. . . . . . . . . . . . . . . . . . . . . . . . . . . . . . . . . . .Chapter 5. Identification of the Electrostatic Interactions Between Triblock Methacrylic Polyampholytes and Proteins
5.1 Introduction ...
5.2 Experimental Section ...
5.2.1 Materials ... 5.2.2 Methods ...
5.3 Results and Discussion ...
5.4 Conclusions ...
5.5 Literature Cited ...
Chapter 6. Protein Complexation with Methacrylic I the Potential for Protein Separation ... 6.1 Introduction ...
6.2 Experimental Section ... 6.2.1 Materials ...
6.2.2 Methods ...
6.3 Results and Discussion ...
6.4 Conclusions ...
6.5 Literature Cited ...
Chapter 7. Triblock Methacrylic Polyampholytes as Protei
Chromatography
...
7.1 Introduction ... 7.2 Experimental Section ... 7.2.1 Materials ... 7.2.2 Apparatus ... 7.2.3 Methods ...7.3 Results and Discussion ...
. ... ... ... .. .... .. .. ... 96
... 96
... 97
...
... 97
... 97
...
99
...
102
...
103
?olyampholytes: Establishing...
116
... 116
... 119
... 119
... 119
...
121
...
126
...
126
in Displacers in Ion-Exchange...
143
... 143
... 145
...
145
...
145
...
146
...
148
7.3.1 Displacements .... 7.3.2 Characteristic Charge 7.3.3 Column Regeneration 7.3.4 Polymer Recycling 7.3.5 Displacer Optimization 7.3.6 Toxicity ...
...
148
...
150
...
151
...
153
...
154
...
155
7.4 Conclusions ... 156 7.5 Literature Cited . ... .... .. .. ... .. .. .. ... 156Chapter 8. Random Acrylic Polyampholytes for Protein Extraction in Two-Phase Aqueous Polymer Systems 8.1 Introduction ... 8.2 Experimental Section 8.2.1 Materials 8.2.2 Methods 8.3 Results and Discussion
...
167
. . . 167...
170
170 170 .... ... .. ... . .. ... ... .. 171 8.3.1 8.3.2 8.3.3Solubility ...
Titration ...
Isoelectric Point 8.3.4 Phase-Behavior of the T 8.3.5 Effect of Polymer Concer 8.3.6 Effect of Salt Concentrati, 8.3.7 Effect of Cation Type...
171
...
171
...
172
ro-Phase System ... 174 itration ... . 175 on ... 176...
178
8.4 Conclusions and Future Directions 179 8.5 Literature Cited 180 Chapter 9. Phase-Behavior of Random and Triblock Methacrylic Polyampholytes with Poly(vinyl alcohol) ... 192 9.1 Introduction ... 192 9.2 Experimental Section
...
193
. . . . . . . .9.3 Results ... 9.4 Discussion ... 9.5 Conclusions ...
9.6 Literature Cited ... Chapter 10. Conclusions and Recommendations
10.1 Conclusions ...
10.2 Another Potential Application 10.3 Degradability ... 10.4 Toxicity ... 10.5 Purification ... 10.6 Viscosity ... 10.7 Surface Tension ... 10.8 Solubilization of DPH .... 10.9 Gels and Stars ... 10.10 Modelling ...
10.11 Characteristic Charge by Isoci 10.12 Literature Cited ...
...
194
...
196
...
198
...
199
...
211
...
211
...
212
...
212
...
213
...
213
...
214
...
214
...
215
...
215
...
216
atic Elution ... 216...
216
LIST OF FIGURES
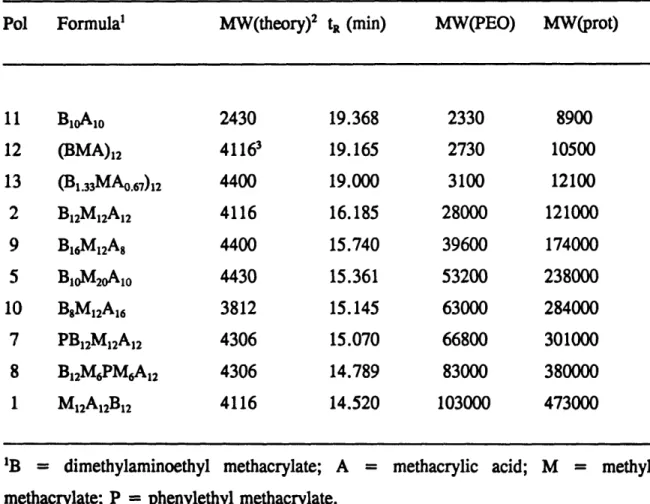
Figure 1.1 Protein separations mediated by ampholyte solutions: (a) isoelectric focusing, (b) chromatofocusing and (c) ampholyte displacement chromatography ... 25 Figure 2.1 Molecular weight distributions of the block copolymers by GPC. Polymer 3 before thermolysis (a); first and first two blocks of Polymer 6 (b), Polymer 9 (c) and Polymer 10 (d) ... 58 Figure 2.2 Experimental isoelectric points of the polyampholytes. The solid line represents a theoretical prediction ... 59 Figure 2.3 Titration of triblock copolymer 2 at different KC1 concentrations . . 60 Figure 2.4 Solubility of triblock copolymer 2 as a function of pH at different KCI
concentrations ... ... 61
Figure 2.5 Hydrodynamic diameter of triblock copolymer 2 at different pH with no added salt ... 62 Figure 2.6 Comparison of the intensity ratio of pyrene fluorescence of triblock polymer 2 and random copolymer 12 ... 63 Figure 3.1 Molecular weight calibration curves with poly(ethylene oxide) standards and
globular proteins ... ... 73
Figure 3.2 Dependence of band broadening on retention time ... 74 Figure 3.3 Comparison of hydrodynamic size determined by QELS with retention time in SEC columns ... 75 Figure 4.1 Elution of the acid-rich triblock polyampholyte by a linear 0.2-1.OM NaCl gradient at pH 8.5 and flow rate of 0.5m~Lmin ... 93 Figure 4.2 Fronts of the acid-rich and base-rich triblock polyampholytes at polymer concentration of 10mg/mL, pH 8.5 and flow rate of 0.2mL/min ... 94 Figure 4.3 Adsorption conformation of a triblock polyampholyte at pH 8.5 ... 95 Figure 5.1 Time-dependence in self-aggregation of Polymer N at different polymer concentrations at pH 6.1 ... 106
Figure 5.2(b) Self-aggregation of 0.01 % Polymer N at different salt concentrations . . . 108 Figure 5.3(a) Optical densities of 0.01% Polymer N (open circles), 0.05 % STI (open triangles) and mixture containing 0.025% STI and 0.005% Polymer N (filled squares)
... · · · 10
Figure 5.3(b) Complexation of 0.025 % STI with 0.005 % Polymer N at different salt concentrations ... 110 Figure 5.4(a) Optical densities of 0.01 % Polymer B (open circles), 0.05 % STI (open triangles) and mixture containing 0.005 % Polymer B and 0.025 % STI (filled squares)
...
111
Figure 5.4(b) Back titrations of Figure 5.4(a). Optical densities of 0.01 % Polymer B (open circles), 0.05% STI (open triangles) and mixture containing 0.005% Polymer B and 0.025% STI (filled squares) ... 112 Figure 5.5 Langmuir plot of the complexation of 0.005% Polymer B with different concentrations of STI at pH 4.8 and 5.1 ... 113 Figure 5.6 Optical densities of 0.01 % Polymer A (open circles) and mixtures of 0.005 % Polymer A with 0.025% (filled triangles) and 0.25% ribonuclease (filled squares) 114 Figure 5.7 Optical densities of 0.01 % Polymer A (open circles), 0.05 % lysozyme (open triangles) and mixture containing 0.025% lysozyme and 0.005% Polymer A (filled squares) ... 115 Figure 6.1 Examples of polyelectrolyte complexation: (a) polycation and polyanion, (b) polycation and protein and (c) polyampholyte and protein ... 132 Figure 6.2 Polyampholyte-protein complexation for protein separation. The net positively charged polyampholyte will form a complex only with the net negatively charged protein ... 133 Figure 6.3(a) Kinetics of aggregation of Polymer N at pH 5.6 and different polymer concentrations. The letter "r" in the legend indicates replication of the experiment. Inset: doublelog and semilogarithmic plot of the same data ... 134 Figure 6.3(b) Pseudosteady-state optical density of aggregated Polymer N at pH 5.6 and at different polymer concentrations ... 135 Figure 6.4(a) Kinetics of aggregation of Polymer N with STI at pH 4.8, at an 1/5 polymer/protein mass concentration ratio and at different total (polymer plus protein)
concentrations. Replication is indicated by letter "r"
Figure 6.4(b) Pseudosteady-state optical density of aggregated mixture of STI with Polymer N at constant protein/polymer concentration ratio. For comparison, the aggregation of pure polymer is replotted from Figure 6.3(b) ... . 137 Figure 6.5 Pseudosteady-state optical density profiles of 0.01% w/w solutions of polyampholytes with no added salt ... 138 Figure 6.6 Pseudosteady-state optical density of a mixture containing 0.05 % w/w STI and 0.01% w/w Polymer N. For comparison, the optical density profile of pure polymer (0.01 %) is replotted from Figure 6.5 ... 139 Figure 6.7 Pseudosteady-state optical densities of binary mixtures of STI (0.05 %) with Polymer A (0.01%), Polymer N (0.01%) and Polymer B (0.01%) ... 140 Figure 6.8 Pseudosteady-state optical density of binary mixtures of Polymer B (0.01 %) with STI (0.05%) and with ribonuclease (0.05%). For comparison, the optical density of pure polymer solution (0.01 %) is also shown ... 141 Figure 6.9 Pseudosteady-state optical density of a tertiary mixture composed of STI (0.05%), ribonuclease (0.05%) and Polymer A (0.01%). The optical densities of the binary mixtures and the polymer are also shown ... 142 Figure 7.1 Displacement separation of -lactoglobulins A and B by 40mg/mL of the acid-rich triblock polyampholyte at pH 7.5 ... 161 Figure 7.2 Displacement separation of -lactoglobulins A and B by 40mg/mL of the acid-rich triblock polyampholyte at pH 8.5 ... 162 Figure 7.3 Displacement separation of f/-lactoglobulins A and B by 14.4mg/mL of poly(methacrylic acid) at pH 8.5 .. ... 163 Figure 7.4 Displacement separation of /g-lactoglobulins A and B by 20mg/mL of the acid-rich triblock polyampholyte at pH 8.5 ... 164 Figure 7.5 Displacement separation of j/-lactoglobulins A and B by 37mg/mL of the neutral triblock polyampholyte at pH 8.5 ... 165 Figure 7.6 Phase diagram of the acid-rich triblock polyampholyte at lOmg/mL 166 Figure 8.1 Solubility and titration curves of polyampholyte 2 ... 184 . .. .. .. .. .. 136
Figure 8.2 Calculated dependence of the isoelectric point on polyampholyte composition ... 185
Figure 8.3 Phase diagram of polyampholyte 1 and PVA as a function of pH and salt
concentration
...
...
...
186
Figure 8.4 Phase diagram of the system containing polyampholyte 1 and PVA at pH 7.2 and 0.1M KC1 ... ... .. ... 187 Figure 8.5 Effect of the tie line length on the partitioning of ovalbumin and chymotrypsinogen in the system polyampholyte 1 and PVA at pH 7.2 and 0.1M KaB8 Figure 8.6 Effect of ionic strength on the phase composition of the system polyampholyte 1 and PVA at pH 7.2. The vertical dotted line denotes the phase
inversion ...
... 189
Figure 8.7 Effect of ionic strength on the partitioning of ovalbumin and chymotrypsinogen in the system containing polyampholyte 1 and PVA at pH 7.2. The vertical dotted line represents the phase inversion ... 190 Figure 8.8 Effect of cation type on the partitioning of ovalbumin and chymotrypsinogen and phase composition of the system containing polyampholyte 2 and PVA at pH 4.6 and
at salinity of 0.1M
..
...
..
..
...
191
Figure 9.1 Phase-behavior of triblock Polymer 9 line denotes the isoelectric point ...
Figure 9.2 Phase-behavior of triblock Polymer 8 line denotes the isoelectric point ...
Figure 9.3 Phase-behavior of triblock Polymer 2 line denotes the isoelectric point ...
Figure 9.4 Phase-behavior of triblock Polymer 1 line denotes the isoelectric point ...
with poly(vinyl alcohol). The dotted
...
201
with poly(vinyl alcohol). The dotted
...
202
with poly(vinyl alcohol). The dotted
...
203
with poly(vinyl alcohol). The dotted
...
204
Figure 9.5 Phase-behavior of triblock Polymer 10 with poly(vinyl alcohol). The dotted line corresponds to the isoelectric point ... 205 Figure 9.6 Phase-behavior of triblock Polymer 5 with poly(vinyl alcohol). The dotted line denotes the isoelectric point ... 206 Figure 9.7 Phase-behavior of random Polymer 13 with poly(vinyl alcohol). The dotted line corresponds to the isoelectric point ... 207
Figure 9.8 Phase-behavior of random Polymer 12 with poly(vinyl alcohol). The dotted line denotes the isoelectric point ... 208 Figure 9.9 Effect of anion type on the phase-behavior of triblock Polymer 2 with
poly(vinyl alcohol) at pH 8.2 209
Figure 9.10 Effect of cation type on the 1 poly(vinyl alcohol) at pH 8.2 ...
Figure 10.1 Concentration-dependence polyampholytes. Effect of pH and polymer
Figure 10.2 Concentration-dependence polyampholytes. Effect of pH and polymer Figure 10.3 Concentration-dependence polyampholytes. Effect of pH and polymer Figure 10.4 Concentration-dependence polyampholytes. Effect of pH and polymer
phase-behavior of of the specific architecture . of the specific architecture . of the surface architecture . of the surface architecture . triblock . . . * . . viscosity ·. . . * . viscosit] · · . .· . tension tension Polymer 2 with
...
210
of the neutral ... 219 y of the basic...
220
of the neutral...
221
of the basic...
222
Figure 10.5 Surface tension of triblock Polymer 2 in 0.01M acetate and at pH 4.5. At a given concentration, the higher value of the surface tension corresponds to the initial reading, while the lower value to the equilibrium reading ... 223
LIST OF TABLES
Table 1.1 Group Transfer Polymerizable monomethacrylates ... 23 Table 1.2 Group Transfer Polymerizable multimethacrylates ... 24 Table 2.1 Architecture, block-sequence, composition and insolubility range of methacrylic polyampholytes (Molecular weight = 4,000) ... 53 Table 2.2 GPC and theoretical molecular weights of the block polyampholytes 54 Table 2.3 Isoelectric points of the polyampholytes ... 55 Table 2.4 Results of static and dynamic light-scattering characterization of Polymers 2 and 12 atpH 5 ... 56
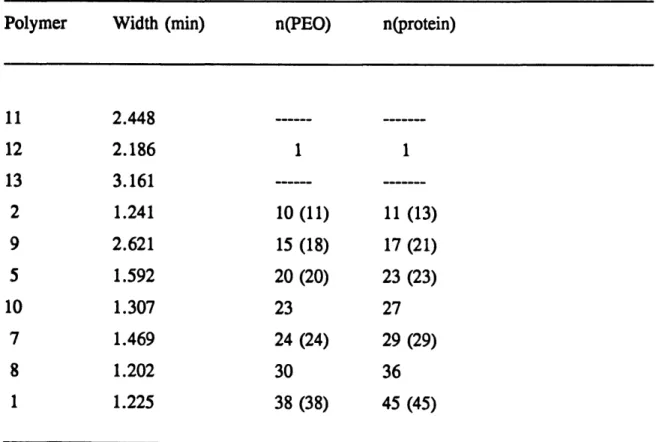
Table 3.2 Peak widths and aggregation numbers of the polyampholytes ... 72
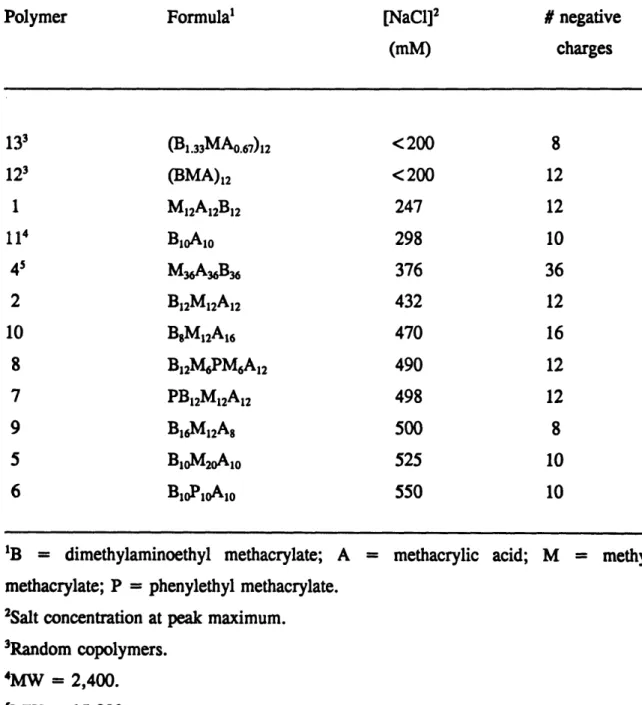
Table 4.1 Salt concentration required for polyampholyte elution at pH 8.5 ... 89
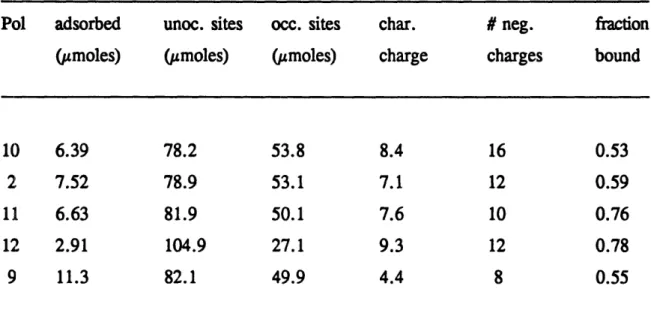
Table 4.2 Adsorptive capacity and characteristic charge of synthetic polyampholytes at
pH8.5
...
... .. .. .. ... 90
Table 4.3 Effect of pH on the adsorptive capacity and characteristic charge of the acid-rich triblock polyampholyte (Polymer 10) ... 91
Table 4.4 Effect of salt concentration on the adsorptive capacity and characteristic charge of the neutral triblock polyampholyte (Polymer 2) at pH 8.5 ... 92
Table 5.1 Properties of the polyampholytes ... 105
Table 6.1 Properties of the synthetic polyampholytes and the proteins ... 131
Table 7.1 Properties of the displacers ... 159
Table 7.2 Frontal characterization of the displacers ... 160
Table 8.1 Characteristics of the acrylic polyampholytes ... 183
Table 9.1 Characteristics of the polyampholytes studied ... 200
SCHEMES Deprotection schemes of pre-methacrylic acid residues ... 57
Chapter 1.
Introduction.
A plethora of new materials have been developed over the past twenty-five years, leading to significant advances in many areas, including the aerospace industry, optoelectronics and, with biocompatibility an important issue, the biomedical field. The recent advances in biotechnology permitting the production of therapeutic and diagnostic proteins on a commercial scale, and to increased demand for industrial biocatalysts, have highlighted the need for more selective protein separation and purification procedures. In this area, too, new materials development can play an important role, as solid support materials for chromatographic operations, for instance, or as solution modifiers to effect the separation of proteins selectively. It is this latter problem that is the subject of this thesis: a new family of synthetic ampholytic polymers has been synthesized and shown to have potential applications in protein separation processes such as ion-exchange displacement chromatography and coprecipitation. The results of this work are reported here.
In the sections that follow, a brief summary of the most important novel polymeric materials is given, the revolution in packing materials of High Performance Liquid Chromatography (HPLC) for biomolecule separation is discussed and the utilization of ampholytes in novel protein separations summarized. Finally, our polymers and the techniques by which they were synthesized are described, followed by a brief discussion of the contents of subsequent chapters in the thesis.
1.1 New Polymers
chemically resistant polymers, degradable polymers, electrically conducting polymers, photoconducting polymers [1] and non-linear optical polymers [2,3]. Kevlar (du Pont trade name of an aromatic polyamide), for example, is a liquid crystalline polymer which exhibits exceptional mechanical properties. Compared to steel, this novel polymer has much higher tensile strength and much lower density. It is used in tire cord as well as in lightweight bullet-proof vests. Thermoplastic elastomers are ABA triblock copolymers based on monomers with substantially different structure, such as butadiene and styrene, and are physically cross-linked through the aggregation of the A (polystyrene) blocks. Although they exhibit elastic behavior due to the physical cross-linking, they still maintain the flow properties of thermoplastics. Thermally stable polymers are polymers with ladder or semiladder structure such as poly(p-phenylene). These materials maintain their properties up to temperatures as high as 600°C and are used in aerospace applications. Flame resistant materials include inflammable polymers such as poly(vinyl chloride) and self-extinguising polymers such as polyurethanes and polycarbonates. Fluoropolymers are chemically resistant polymers that are used as gaskets, sealants and valves and may also be used in artificial organs and other prosthetic devices. Degradable polymers include polyketoesters and polyketoamines which were originally developed as a result of the increased ecological awareness and later found application in positive resist technology for the manufacture of integrated circuits and also in controlled release in agriculture and medicine. Electrically conducting polymers include polyacetylene and poly(sulfur nitride) which, in the presence of dopants, become highly conducting. These materials are important in the development of light-weight batteries. Photoconducting polymers are materials such as poly(N-vinyl-carbazole), that conduct electricity to a small degree under the influence of light and are used in the photocopying industry [1]. Non-linear optical materials are r-electron polymers, such as poly(diacetylene) and polypyrrole, that are under intense investigation for the development of photonics (the optical analogue of electronics) which will make possible optical computing, optical radar and high-speed communication [2,3].
1.2 Materials for HPLC of Biomolecules
HPLC of biomolecules was introduced 17 years ago by Regnier and coworkers who used surface-modified spherical silica to separate proteins and nucleic acids [4,5]. Since then, HPLC has found wide acceptance in the analysis and preparative purification of proteins. During the past five years, Regnier and colleages have developed a new type of chromatographic packing material, the perfusive material, the novelty of which lies in the presence of a bimodal distribution of pores [6]. The first family of pores is that of the diffusive pores (1000 A) which contribute most of the surface area and they are the same as those found in the conventional HPLC packing material. The second family of pores is that of the convective pores (5000 A) which reduce significantly intraparticle solute transport and, consequently, band spreading [6]. The new packing material can achieve separations one order of magnitude faster than conventional HPLC materials. Most recently, Regnier and coworkers are developing a new type of packing material which is chemically derivatized such that it specifically recognizes and retains the protein of interest.
1.3 New Protein Separation Techniques Mediated by Ampholytes
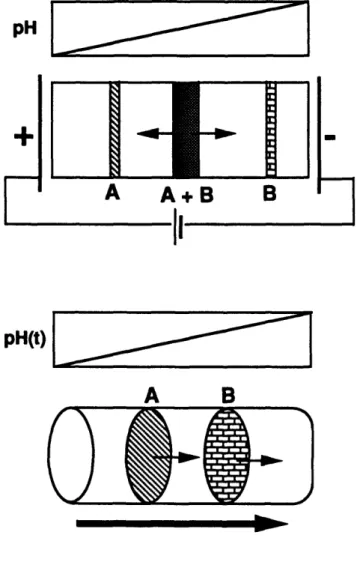
Figure 1.1 illustrates three methods for protein separation that utilize synthetic ampholytes: (a) isoelectric focusing, (b) chromatofocusing and (c) ampholyte displacement chromatography. The "carrier ampholytes" utilized in these techniques are essentially mixtures of ampholytes covering a spectrum of compositions and isoelectric points [7]. They are random oligomers of amines, aminoacids and dipeptides with a molecular weight of approximately 500 (ten times smaller than the ones developed in this thesis). These species have high buffering capacity and conductivity at the isoelectric point [7].
electrophoresis, is time independent. The protein sample is applied and each protein species migrates to the region where the pH is equal to its isoelectric point.
A very recent development in isoelectric focusing involves a gel that contains copolymerized ampholytes of composition that varies along the direction of the applied electric field [8]. In this way the ampholytes that create the pH gradient are already in the right position. The materials for the synthesis of such gels are commercially available by Pharmacia and are called Immobilines.
In chromatofocusing (Figure 1.1(b)), a weak anion-exchange column is used. First, the column is equilibrated at high pH, and subsequently eluted with a low pH ampholyte solution. A transient and almost linear pH gradient is created as a result of the buffering capacity of the column and of the ampholytes. The proteins are eluted close to the pH that corresponds to their isoelectric point.
While in isoelectric focusing and chromatofocusing they are utilized for the establishment of a pH gradient, in ampholyte displacement chromatography (Figure 1.1(c)) the carrier ampholytes are used to elute the protein sample which is adsorbed on an ion-exchange column [7]. This is essentially what it is done in Chapter 7 of this thesis. However, the column affinity of the carrier ampholytes (designed specifically for isoelectric focusing and chromatofocusing) is low. This leads to the requirement of a high (60g/l) ampholyte concentration for elution. Moreover, the obtained protein bands are diffuse and do not form a displacement train [9]. As illustrated in this thesis, many of these limitations can be overcome by using block polymeric ampholytes, rather than the traditional low-molecular-weight random ampholytes.
1.4 Our Materials
A limiting factor in the development of new materials is the existence of the appropriate chemistry. For example, thermoplastic elastomers were developed only several years after the advent of anionic polymerization [10]. With the invention of Group Transfer Polymerization (GTP) in 1983 [11] new synthetic horizons opened by offering the ability to polymerize methacrylates and acrylates in a controlled fashion.
There is a large number of methacrylate monomers that are commercially available; many of these are listed in Table 1.1, and most might be polymerized by GTP to give homopolymers, random and block copolymers of well-defined size. Table 1.2 lists multifunctional methacrylates which can be used for the synthesis of star polymers and gels. Another attractive feature of GTP is that, unlike anionic polymerization that requires very low temperatures (-78°C), it takes place at room temperature.
There are several limitations of GTP. The strictest is that proton donating monomers, such as alcohols and acids, can not be used for polymerization, as is also true for anionic polymerization. Another limitation arises from the contamination of GTP monomers by proton donating impurities. This can be resolved sometimes by simple purification techniques, such as distillation or treatment with agents like calcium hydride. However, when the proton donating impurities are very inert (e.g. higher aliphatic alcohols) more reactive purifying agents must be used. Trialkyl aluminum is an example whose high reactivity may result in free radical polymerization of the monomer. Therefore, treatment with trialkyl aluminum must be carried out at low temperature and in the absence of oxygen. Another limitation for GTP is the sluggishness observed in the polymerization of some monomers with bulky groups that cause steric hindrances. Such an example is t-butyl methacrylate, which needs to be polymerized at low temperatures (below -20oC).
We wished to prepare polymers for utilization in existing bioseparation processes. To be able to interact electrostatically with the charged biomolecules or the charged matrix, these materials should be polyelectrolytes. They should also be polyampholytes so that they can be precipitated and recycled. To maximize the extent of electrostatic interactions, the charged components of the polyampholytes should be segregated. Therefore, we had to synthesize block polyampholytes and for the synthesis we elected to use GTP. Because of the versatility of GTP we included a third block made of methyl methacrylate to enhance the hydrophobic interactions and make precipitation more extensive. This resulted also in micellization of the block polyampholytes. Another
In the following Chapter, the synthesis and solution properties of the polyampholytes are presented. Chapters 3 and 4 describe the polymer characterization in size exclusion and anion-exchange columns, respectively. In Chapters 5 and 6 the interaction of the polyampholytes with proteins is studied and the potential of this interaction for protein separation is discussed. In Chapter 7 the block polyampholytes are used to separate proteins by anion-exchange displacement chromatography. In Chapter 8 the utilization of random polyampholytes for protein partitioning in two-phase aqueous polymer systems is explored. In Chapter 9 the formation of two-phase aqueous polymer systems by block polyampholytes is studied. In Chapter 10 the findings of this
work are summarized and recommendations for future work are given.
1.5 Literature Cited
(1) Stevens, M. P. Polymer chemistry: An Introduction; Oxford Univ. Press: New York, 1990, 2nd Ed.; p 95-137.
(2) Dalton, L. R.; Sapochak, L. S.; Yu, L. P. Recent Advances in Nonlinear Spectroscopy and Nonlinear Optical Materials. J. Phys. Chem. 1993, 97, 2871-2883.
(3) Dalton, L. R. Fresh Start for Photonics. Nature 1992, 359, 269-270.
(4) Hashimoto, T. Macroporous Synthetic Hydrophilic Resin-Based Packings for the Separation of Biopolymers. J. Chromatogr. 1991, 544, 249-255.
(5) Regnier, F. E. High-Performance Liquid Chromatography of Biopolymers. Science 1983, 222, 245-252.
(7) Righetti, P. G. Isoelectric Focusing: Theory, Methodology and Applications; Elsevier: Amsterdam, 1983, p 1-50, 141-146.
(8) Righetti, P. G. Immobilized pH Gradients: Theory and Methodology; Elsevier: Amsterdam, 1990.
(9) Young, J. L.; Webb, B. A. Two Methods for the Separation of Human a-Fetoprotein and Albumin. Anal. Biochem. 1978, 88, 619-623.
(10) McGrath, J. E. An Introductory Overview of Block Copolymers. Block Copolymers: Science and Technology; Meier, D. J., Ed.; MMI Symposium Series, Harwood: New York, 1983; Vol. 3, p 1-16.
kS
~ ~ ~ ~
3,a
i.s,
S~~~~~~~~~~~~~~~C.s
a .
5;1
fA
S m~~~~~~~~~~~~~~~~~~~~~~~~oc~
~
~
~
71 .pB~~~~,~~~
cl(C
~
6
5'fi c~~~~~~~~~~~~~~~~~cccr~ ~ ~ ~ ~ ~~~:
~
kk a E~~~~~~~7 71H > C 1 S s B E a o~~71 t~~l Ik r, er E f CI! B8~~~~~~~C 3 E i; g C . E E~~~L C 42O 7. 7v g E r 71~h SI ~~~~ tt: 1 ·s a C? ~~~~~~~~~~IJI-C6 0 71 C o t!~~~~~~~~~~N ,Z 64 4)0. 4) 0 0 1:6 Z : L C. a) 2 a)
Q)~
~soe44)
~ ) ).
F!s
o
s
aK
8 F-~ = --pH (a) r~] pH(t) (b)
0
A
pH B no rT T a: . . . . .. . . (c)Figure 1.1 Protein separations mediated by ampholyte solutions: (a) isoelectric focusing, (b) chromatofocusing and (c) ampholyte displacement chromatography.
11
Chapter 2.
Synthesis and Solution Behavior of Random and Block Methacrylic
Polyampholytes.
In this chapter we describe the Group Transfer Polymerization (GTP) synthesis of the polymers that are the subject of investigation in this thesis. Various solution characterization techniques are also presented, including determination of isoelectric points, titration, solubility, light-scattering and fluorescence. The motivation for the development of the block polyampholytes was the hypothesis that they would perform better in the various protein separation processes than their random counterparts which we first encountered in protein partitioning experiments (Chapter 8). Besides their potential importance for protein separation applications, these polymers are the first ABC triblock polyampholytes to be synthesized by GTP and they are among the very few ABC triblock copolymers to be studied in solution. A very interesting property that the triblock polyampholytes possess is their rich phase-behavior with respect to pH. At intermediate values of pH they form micelles, around the isoelectric pH they precipitate and at extreme values of pH they exist as single chains. The ability that is given to vary polymer solubility as well as micellar stability by pH manipulations may have significant impact for future applications of these polyampholytes, not limited to protein separation processes.
2.1 Introduction
Random and block copolymers can exhibit contrasting behaviors both in the bulk and in solution. For example, in the bulk, the modulus of a random copolymer
composition. In contrast, the modulus of the corresponding block copolymer undergoes one decrease at the glass transition temperature of each component block and, between the decreases, it assumes a plateau value, defined by the copolymer composition [1]. In solution, the fluorescence quenching of a block copolymer of 9-vinylphenanthrene and methacrylic acid in water, a selective solvent, is more efficient than that of the corresponding random copolymer because of the larger size of the hydrophobic phenanthrene microdomain, which results in more efficient binding of the quencher and longer range energy migration [2]. At interfaces, Monte Carlo simulations show that random copolymers orient along the interface, while diblocks tend to assume a configuration perpendicular to the interface [3,4]. These are only some of the many examples of different behavior between random and block copolymers.
We are interested in polyampholyte-mediated protein separation methods such as ion-exchange displacement chromatography [5-7], precipitation [8,9] and aqueous two-phase partitioning [10]. Recently, we partitioned proteins between the phases of a two-phase aqueous polymer system comprising a random acrylic polyampholyte and poly(vinyl alcohol) [11]. Utilization of block instead of random polyampholytes in these applications may have a dramatic effect on the performance of these separation processes, as the properties of the block copolymers are expected to be different from those of the random. For instance, in displacement chromatography, we expect to have enhanced performance because the block architecture will strengthen the separation driving force which is the electrostatic interaction between the polyampholyte and the chromatography column. The localization of the similar charges within a block will generate an electric field which will be stronger than that for the random copolymer. Another implication of the strengthening of the electrostatic interactions by block copolymer architecture is that, at the isoelectric point of the polymer, the interpolyampholyte attractions will be stronger leading to a more extensive precipitation. The ability to precipitate the polymer is very crucial in industrial applications because it will facilitate recycling. Random acrylic polyampholytes do precipitate when they are of relatively high molecular weight, typically above 15,000 Da, but they do not when they are of much lower molecular weight [12].
Reports on the synthesis and characterization of block polyampholytes are very few and not systematic. On the other hand, there are more than 200 reports for random polyampholytes [13], which were chemically synthesized for the first time in the 1950's [14-20]. The dual charge nature of these polymers and their resulting isoelectric points make them attractive non-biological models for proteins. We summarize here some of the most recent studies on random polyampholytes. McCormick and Salazar [21] reported on a viscosity study of random polyampholytes based on sodium
2-acrylamide-2-methylpropanesulfonate,
2-acrylamide-2-methylpropanedimethylammonium chloride and acrylamide. Annaka and Tanaka [22] studied the swelling of random polyampholyte gels based on acrylic acid, methacrylamidopropyltrimethylammonium chloride and N,N'-methylenebisacrylamide, and observed multiple phases in the gels with an acid to base molar ratio close to two. The swelling of random polyampholyte gels of sodium styrenesulfonate,
methacrylamidopropyltrimethylammonium
chloride,
acrylamide,
and
N,N'-methylenebisacrylamide was studied by Baker et al. [23]. Ebersole et al. [24] developed a piezoelectric cell growth sensor which detects the pH change in the cell broth through the solubility change of a random polyampholyte, based on acrylic acid, methyl methacrylate and dimethylaminoethyl methacrylate, which is also present in the broth. Higgs and Joanny [25] developed a scaling theory for random polyampholytes at the isoelectric point. Higgs and Orland [26] performed Monte Carlo simulations on an alternating polyampholyte at the isoelectric point. Kantor and colleages [27] employed Monte Carlo simulations and analytical arguments to study the conformations of random polyampholytes at both zero and nearly-zero net charge. Kamiyama and Israelachvili [28] measured the adsorption and surface force of gelatin, a proteinaceous polyampholyte, adsorbed on mica, at different pH and salt concentration. Most recently, Corpart and Candeau [29] studied the viscosity and salt-dependence of precipitation of random polyampholytes carrying sulfonate and quaternary amine groups.
in dynamic reverse osmosis membranes. Following this study, Varoqui et al. [32] synthesized a diblock polyampholyte based on styrenesulfonic acid and 2-vinylpyridine for study of the intramolecular complexation of the anionic poly(styrene sulfonate) block with the cationic poly(2-vinylpyridinium) block. Miyaki and coworkers [33-38] synthesized charge-mosaic membranes which are cross-linked pentablock polyampholytes, the second block comprising quaternary ammonium residues, the fourth block styrenesulfonate, and the other three blocks being neutral cross-linkable isoprene blocks. The charge-mosaic membranes could find application in desalination. Most recently, Bekturov and coworkers [39,40] studied the precipitation and polymer complexation of two diblock polyampholytes of high molecular weight (600 kDa) comprising methacrylic acid and 1-methyl-4-pyridinium chloride residues.
Inclusion of an uncharged, hydrophobic block in a block polyampholyte leads to an ABC triblock polymer structure. Water-soluble methacrylic ABC triblock polymers appear to be a new class of polymers and they are expected to exhibit a richer solution behavior than the corresponding diblocks. The literature on ABC triblock polymers is modest, and primarily concerns studies of morphology and film properties [41]. Recently, Sdranis and Kosmas [42] have provided a theoretical consideration of solution properties of non-ionic ABC triblock polymers. Most recently, Wu and Slater [43] calculated the static structure factor and shape of ABC triblock polyampholytes (one of the blocks being non-hydrophobic and neutral) reptating in a gel in the presence of an electric field.
The most straightforward way to prepare acrylic triblock polyampholytes is to use a living polymerization method with sequential addition of monomers. Because group transfer polymerization (GTP) is convenient and amenable to a wide variety of functional and non-functional methacrylates [44,45], we chose to use this process to prepare block polymers containing DMAEMA and MAA. Mller and coworkers [46] have reported the preparation by GTP of diblock polymers comprising DMAEMA and MMA or decyl methacrylate. Since carboxylic acids cause termination of GTP, it is necessary to use an ester of MAA, which, after polymerization by GTP, can easily be converted to the free carboxylic acid. Three protected monomers which have been used in GTP to
prepare precursors to MAA-containing polymers are t-butyl methacrylate, trimethylsilyl methacrylate (TMSMA), and tetrahydropyranyl methacrylate (THPMA). Poly(t-butyl methacrylate) is converted to poly(methacrylic anhydride) and isobutylene at 180-200°C, but in the presence of a catalytic amount of strong acid, thermolysis to poly(MAA) occurs at 90-140°C (Scheme 1) [47]. Deprotection with trimethylsilyl iodide at 50°C has also been reported [48]. In detailed kinetic studies of GTP of t-butyl methacrylate, it was reported that deactivation occurred above -20°C [49]. This was confirmed by Choi et al. [50], who used GTP to prepare ABA triblock polymers with t-butyl methacrylate A blocks. Stereochemical studies by Wei and Wnek [51] show that GTP of t-butyl methacrylate leads to lower syndiotacticity than does GTP of either methyl methacrylate or TMSMA. THPMA has recently been reported to undergo GTP to give random copolymers [52, 53], block copolymers, and homopolymer [54] with narrow molecular weight distribution (MWD).
For our synthesis of polyampholytes by GTP, we elected to use TMSMA and THPMA. TMSMA is a very attractive precursor to poly(MAA) because of its commercial availablilty, and the ease of methanolysis or hydrolysis of poly(TMSMA) with, or without, mild acid catalysis (Scheme 2). However, the reactivity of the trimethylsilyl ester toward nucleophilic GTP catalysts results in significant slowing of polymer growth. Thus, it is generally desirable to (i) add supplementary amounts of catalyst during the polymerization of TMSMA, (ii) leave TMSMA until the last block in block copolymerizations, and (iii) use alternative monomers for the synthesis of polymers of molecular weight higher than about 10,000 Da. For polymers of higher molecular weight THPMA is a better choice. This monomer, however, is not commercially available. Although several procedures have been reported for the synthesis of THPMA [55,56], careful purification is required to remove traces of methacrylic acid which interfere with GTP [52,55]. Poly(THPMA) is smoothly converted to poly(MAA) by heating at 140°C under vacuum for several hours (Scheme
polyampholytes, most of which are triblock copolymers and two of which are random terpolymers. The polymer solution characterization includes molecular weight determination by GPC, structural characterization by light scattering, water-solubility determination as a function of pH and salt concentration, isoelectric point determination, hydrogen-ion titration and a fluorescence study.
2.2 Experimental Section
2.2.1 Materials
Solvent. Tetrahydrofuran was distilled from sodium and benzophenone immediately prior to use.
Initiator. -Methoxy-l-trimethylsiloxy-2-methyl-l-propene was prepared by the method of Ainsworth [57], distilled in a spinning band column, and stored under nitrogen.
Monomers. Commercially available monomers were purified by passage over a column of basic alumina under an argon atmosphere to remove inhibitors and protonic impurities, except for trimethylsilyl methacrylate, which was used as received. Tetrahydropyranyl methacrylate was prepared by the reaction of MAA with 3,4-dihydro-2H-pyran (Aldrich Chemical Co.) using crosslinked poly(4-vinylpyridine hydrochloride) (Fluka Chemie AG) as catalyst by the method of Hertler [55]. Two distillations over calcium hydride provided tetrahydropyranyl methacrylate of sufficient purity for GTP.
Catalyst. Tetrabutylammonium biacetate [58] was prepared in a dry box by addition of one equivalent of acetic acid to a solution of tetrabutylammonium acetate (Fluka Chemie AG) in THF. The resulting precipitated tetrabutylammonium biacetate was collected by filtration and dissolved in freshly distilled propylene carbonate to give a 0.1 M stock solution of catalyst for GTP. The use of propylene carbonate, rather than THF, as solvent avoids the use of 6 molar equivalents of water required to solubilize
tetrabutylammonium biacetate in THF [58].
2.2.2 Methods
Polymerizations. Polymerization reactions were performed in a 250 mL three-necked flask fitted with an addition funnel, two rubber septa, and a magnetic stirrer. A thermocouple was inserted through one septum. The second septum was used for injection by syringe of solvent, catalyst, and initiator. All glassware and syringes were stored overnight at 120°C in an oven, and the glassware was assembled while hot, heated at 100°C with a heat gun, and allowed to cool to room temperature under a flow of argon. The syringes and syringe needles were cooled in nitrogen-blanketted bell-jars. All transfers of liquid were performed with syringes. First, 40 mL of THF were
transferred to the reactor, and the amount of monomer corresponding to the first block, typically about 15 mL, was transferred to the addition funnel. Catalyst solution, typically 1 mL, corresponding to 1 mole% of initiator, was injected. Then, the initiator, typically 2 mL, was injected, followed immediately by dropwise addition of the monomer at a feed rate of lmL/min. The polymerization exotherm was monitored by a digital thermometer. When the temperature fell to near room temperature, addition of the next monomer was begun. The concentration of polymer after the addition of all of the monomers was typically 50% w/w. Since the polymerization of MMA, DMAEMA, and THPMA is much faster than that of TMSMA, TMSMA was the last block for all but one of the reactions. During the polymerization of the TMSMA, after all of the TMSMA had been added, additional 3 or 4 -mL aliquots of catalyst solution were periodically injected to obtain satisfactory polymerization rates (as evidenced by increasing or steady temperature). In the case of random polymerizations, the three monomers were mixed and loaded into the addition funnel. At the end of the polymerizations the living chain ends were quenched by addition of 5 mL of methanol. The complete consumption of monomers was confirmed by H NMR which indicated absence of the peaks characteristic
Removal of the Protecting Groups. The tetrahydropyranyl functionality was removed by heating the neat polymer in a vacuum oven at 140°C for 48 hours. The extent of deprotection was followed by the decrease in weight resulting from loss of dihydropyran. The weight loss was just as expected from stoichiometry. The trimethylsilyl functionality was removed by refluxing the polymerization reaction mixture at 60°C after the addition of a 5-fold molar excess of methanol, 5-fold molar excess of water, and 0.5 mole% of dichloroacetic acid, all of the percentages referring to TMSMA. The completion of the reaction was confirmed by titration.
Molecular Weight Determination. Molecular weights and molecular weight distributions were determined by gel permeation chromatography using a series of four Waters Ultrastyragel columns (10000, 1000, 500, 100 A) on a Hewlett-Packard 1090 HPLC system connected to a refractometer. The mobile phase was THF at a flow rate of 1 mL/min. Four narrow molecular weight poly(MMA) standards (Mp = 2700, 9800, 17500, and 33500 Da) were used for calibration. The logarithm of Mp was determined to vary linearly with retention time. The correlation coefficient was equal to 1.000.
Isoelectric Point Determinations. The isoelectric points were determined by two methods. First, neutral polymer powder was equilibrated with deionized water and the pH of the resulting 10% w/w suspension was measured. This is called the isoionic pH and, for the spectrum of the compositions of our polyampholytes and the high polymer concentration in the suspension, it is practically the same as the isoelectric pH [59]. In the second method, the midpoint of the pH range of precipitation during the titration of 1% w/w solutions of polymers in 0. 1M KCI was used as an indication of the isoelectric point.
Hydrogen-Ion Titrations. A Model 825 MP Fisher Accumet pH meter with a miniature glass electrode and a microreference electrode with a glass barrel was used for the measurement of the pH. Titration of 5 mL of 1% w/w solutions of polymer in 0.02, 0.1 and 0.5M KC1 was performed from pH 2 to 12 at room temperature (23 1 C).
Solubility Determinations. Different amounts of acid or base, as calculated from the experimental titration curves, were added to basic (typically pH = 8) and acidic (typically pH = 5) 10% w/w copolymer stock solutions to adjust the pH at different values within the range 5 to 8. The samples were vortexed, centrifuged for one hour at 4,000rpm, and allowed to equilibrate for at least one day. The polymer concentrations in the supernatant phase were determined at 25°C using an American Optical Abbe refractometer. Different amounts of solid potassium chloride were added for ionic strength adjustment. The polymer concentrations were determined by subtracting the salt contribution to the refractive index and dividing by the polymer refractive index increment which was determined to be 0. 181mL/g at 25°C and constant up to 15% w/w polymer concentration.
Light-Scattering. Static and dynamic light-scattering were performed on a Brookhaven Instrument Corp. instrument with an argon laser light source at 488nm. A 2030 autocorrelator was used for the analysis of the dynamic scattering data. Prior to measurements, samples were filtered five times through 0.2 or 0.51Lm Millipore filters to remove dust. Preliminary dynamic light-scattering experiments were performed using a Microscope Laser Light Scattering apparatus equipped with a light source at 633nm.
Fluorescence. A 10mg/L suspension of pyrene in water was formed by a 100-fold dilution in water of a lg/kg solution of pyrene in ethanol. A small amount of the freshly prepared suspension was transferred to the polymer solutions which were buffered at pH 4.5 with 0.01M sodium acetate. The volume ratio of the polymer solution to the pyrene suspension was 100, so that the polymer concentration was practically unchanged, the final pyrene concentration in the polymer solution was 0. lmg/L, which is close to the solubility of pyrene in water and the ethanol concentration was 100ppm. A Spex Fluoromax fluorimeter was used for the measurement of the steady-state fluorescence spectra of the pyrene-containing polyampholyte solutions at an excitation wavelength of
2.3 Results and Discussion
2.3.1 Polymer Synthesis
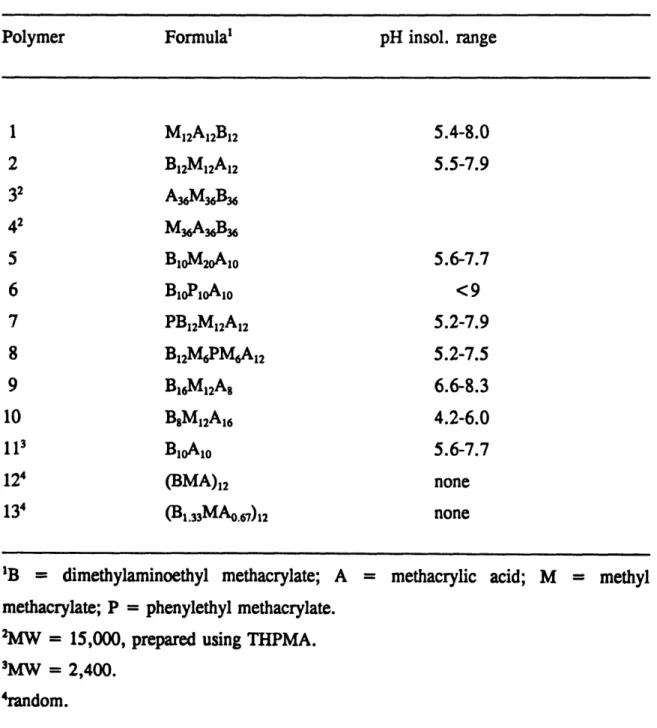
Table 2.1 lists the acrylic polyampholytes synthesized along with their molecular weight, sequence, composition and pH range of precipitation during titration of 1 % w/w in 0.1M KC1. Ten ABC triblocks, one diblock, and two random terpolymers were prepared. The polymers are of relatively low molecular weight, the highest molecular weight examples being the two triblock polymers, 3 and 4, which are 15,000 Da. Our efforts to make random polymers with molecular weights 15,000 and 30,000 Da were unsuccessful, probably due to the presence of TMSMA in the monomer mixture. The slowing down effect of TMSMA in the above polymerization reactions may have been most dramatic because of the small amount of initiator required for synthesis of the higher molecular weight polymers. The acid-to-base molar ratio in the polymers is a very important quantity because it determines the isoelectric point of the polymers and, therefore, the charge and pH-dependence of solubility. Most of the block polyampholytes carry acidic and basic monomers in equimolar amounts and, therefore, they have the same pH range for insolubility, 5.5 to 8. The differences among these polymers lie in molecular weight, block sequence, percentage of MMA, and presence of 2-phenylethyl methacrylate (PEMA). The molar percentage of MMA in the triblocks, except in copolymer 5, was kept constant at 33%.
The PEMA labelling of polymers 7 and 8 results in an increase in the UV-absorbance (250-280nm) by 2-3 times and renders the polymers more easily detectable. The ability in GTP to introduce the label as a polymerizable monomer is more convenient than the alternative of chemical label attachment after polymerization. Polymer 6 which contains a block of PEMA residues and is expected to exhibit an even higher UV-absorbance is unfortunately insoluble, probably due to the high hydrophobicity of the PEMA block.
2.3.2 Molecular Weights
The weight average and number average molecular weights, the polydispersity index, and the theoretical molecular weight of some representative polymers and polymer blocks are listed in Table 2.2. The low polydispersities, lower than 1.4 for all of the polymers, are typical for GTP. The samples indexed A and B represent the first block and the first two blocks of the triblock polymers, respectively. The third block of these polymers was TMSMA, the presence of which prevented GPC analysis, as the polymer is retained on the column. GPC for triblock copolymers 3 and 4 was performed because they did not contain TMSMA but THPMA which is not retained on the column. The higher apparent polydispersity of the first block of polymers 6, 9 and 10, which was poly(DMAEMA), as compared to that of the first two blocks, as well as the difference between theoretical and experimental molecular weights of the first blocks are due to the interaction of poly(DMAEMA) with the column which results in broadening and shift of the peak to larger retention times (lower molecular weights). Poly(amine) adsorption on GPC columns has been observed by other researchers and has been attributed to the presence of residual carboxy functionalities on the column [34]. Figures 2. la-d show the GPC traces of samples 3, 6A&B, 9A&B and 10A&B. After adding the second block, the distribution is still unimodal and narrow, which is indicative of the molecular weight-homogeneity of our polymers, which has already been manifested by the low polydispersity indices. The tails of the curves observed towards larger retention times are typical for polymers prepared by GTP as early termination of chain growth occurred.
2.3.3 Isoelectric Points
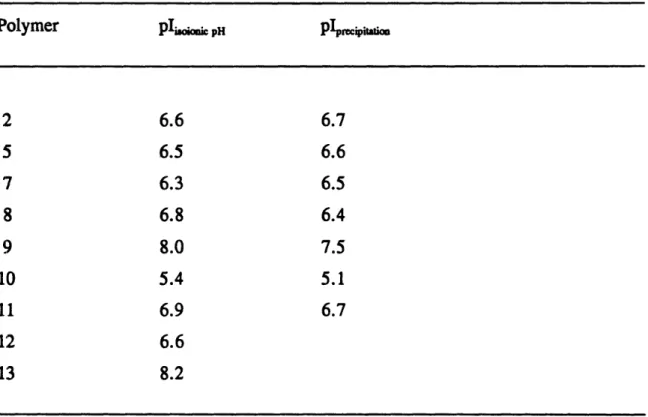
The isoelectric points of the polymers as approximated by the isoionic pHs as well as the midpoints of the pH range of precipitation are listed in Table 2.3. The values obtained from the two methods are in good agreement. The values of the isoelectric
that anions may bind to proteins [60] and that cations may interact with ampholytic latices [61] leading to a shift in the isoelectric point or the pH region of precipitation. The determination of the isoelectric pH from the isoionic pH is particularly useful for the random copolymers which are completely soluble and for which the precipitation method is not applicable. No acid, base or salt was added during the polymer preparation procedures with the exception of the catalytic amounts of dichloroacetic acid needed in the deprotection step. This implies that the polymers are essentially free of any ions other than H+ or OH- and, therefore, are in an isoionic state. Figure 2.2 illustrates the isoionic points of the polymers along with a theoretical prediction, based on the requirement that the net charge of the polymer is zero and that the dissociation constants are not composition dependent. According to this equation the isoelectric point depends on the acid to base molar ratio, R, and the dissociation constants of the negative and positive charges, pK, and pKb:
{
1 (-R lR24 oPKP]pI=pKb+log( R + +-)rl p
The values of the dissociation constants, taken from a previous study [62] on polyampholytes comprising the same monomers, are pK, = pK. = 5.35 and pKb = pKDMmA = 8.00. It is worth mentioning that the equations that lead to this expression were first presented by Ehrlich and Doty [18] and Mazur et al. [20] but no analytical solution was derived. This equation can be very useful for estimating protein isoelectric points from the amino acid composition (the ratio of acidic to basic amino acids). For proteins with low contents of histidine (pK = 6.2) and arginine (pK = 12) the appropriate dissociation constants should be pK, = pKA ^ cid = 4.5 and pKb = pKLYm,
= 10.04 [63].
2.3.4 Hydrogen-Ion Titrations
are shown in Figure 2.3. The curves are generated by interpolation between the experimental points and are not based on any model. It should be pointed out that there are no experimental points around the isoelectric point in the titration curves at the two lower salt concentrations because the polymer precipitates. The portion of the curve at high pH corresponds to the titration of the basic groups and that at low pH to the titration of the acidic groups. The interpolated curves intersect at a pH near the isoelectric point. In the calculations for the construction of the curves, the pH of zero net charge was fixed at 6.6 for all three salt concentrations. The effect of increasing salt concentration at constant pH is to decrease the charge of the group being titrated in that pH region (decrease in the dissociation of the acidic residues or decrease in the protonation of the basic residues). This weakening of the acidic or basic character of the polymer groups can be attributed to the decrease in intrapolymer attractive electrostatic interactions by the salt and has been predicted theoretically [20,62,64,65] and observed experimentally in the titration of biological polyampholytes (proteins) [59] and synthetic polyampholytes
[62].
2.3.5 Solubility Curves
Figure 2.4 shows the pH-dependence of the solubility of Polymer 2 at different salt concentrations, 0.1, 0.3, 0.5 and 0.7M KC1. The solubility around the isoelectric point, which is 6.6, is much lower than that 1 pH unit away. By increasing the salt concentration, the solubility around the isoelectric point increases. At 0.9M KC1 the polymer is completely (at least 10% w/w) soluble, even at the isoelectric point. The polymer net charge is zero at the isoelectric point and, therefore, the electrostatic repulsion, which keeps the polymer in solution, is at a minimum. In contrast, the electrostatic attraction between the positive and negative charges, which are equal in number, is maximized. The increase in salt concentration leads to the screening of the attractions around the isoelectric point and results in increase in solubility. The above
increase in protein solubility, called the salting-in effect. Tanford used the linearized Poisson-Boltzmann equation to develop expressions for the charge and salt concentration dependence of the solubility of globular proteins. In these expressions the protein solubility increases exponentially with the square of the net charge [59].
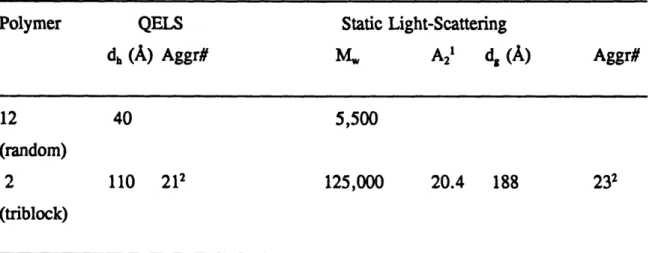
Comparison of triblock copolymer 2 with its random counterpart copolymer 12 indicates that factors other than the net charge can influence the solubility. Polymer 12 is soluble, at least 15 % w/w, over the entire pH-range, even at the isoelectric point and in the absence of salt. This can be attributed either to the smaller effective size of the random copolymer (no micelles, see also Chapter 9) or to the random distribution of the positive and the negative charges on the polymer which leads to a dipole moment lower than that necessary for enhancing interpolymer association at the isoelectric point. Supporting the latter interpretation is the precipitation of diblock copolymer 11 at the isoelectric point despite the absence of micelles, the lower molecular weight (2,400 Da) and lower hydrophobicity (no MMA residues). However, it should be mentioned that diblock copolymer 11 salts-in very easily.
It was expected that the solubility of triblock polymer 2 should be essentially zero because, as it was evidenced by the turbidimetric titrations of Chapters 5 and 6, the same polymer could be precipitated from solutions of polymer concentration as low as 0.004 %. The minimum solubility shown in Figure 2.4 is 1 % and it is much higher than the expected value of 0.004%. This discrepancy is due to the presence of impurities which are taken as polyampholyte by the non-selective refractive index technique. We estimate that our triblock copolymers contain 5-10% impurities of homopolymer (terminated first block) and diblock. This is consistent with the long tails in the GPC plots (Figure 2.1) as well as with the findings of M6ller and coworkers [46]. Since the total average polymer concentration of the samples was 10%, 10% of which was impurities, it can be calculated that the concentration of impurities was 1 % (see also Chapters 4 and 7).
2.3.6 Light-Scattering