Agreement Between an Isolated Rater and a Group of
1Raters
2S. Vanbelle and A. Albert
3
Medical Informatics and Biostatistics,
4
University of Liège, CHU Sart Tilman (B23),4000 Liège, Belgium
5
Correspondence should be sent to
6 E-Mail: [email protected] 7 Phone: +3243662590 8 Fax: +3243662596 9 10 Abstract 11
The agreement between two raters judging items on a categorical scale
12
is traditionally measured by Cohen’s kappa coefficient. We introduce a new
13
coefficient for quantifying the degree of agreement between an isolated rater
14
and a group of raters on a nominal or ordinal scale. The coefficient, which
15
is defined on a population-based model, requires a specific definition of the
16
concept of perfect agreement but possesses the same properties as Cohen’s
17
kappa coefficient. Further, it reduces to the classical kappa when there is
18
only one rater in the group. An intraclass and a weighted versions of the
19
coefficient are also introduced. The new approach overcomes the problem of
consensus and generalizes Schouten’s index. The sampling variability of the
21
agreement coefficient is derived by the Jackknife technique. The method is
22
illustrated on published syphilis data and on data collected from a study
23
assessing the ability of medical students in diagnostic reasoning.
24
Keywords: kappa coefficient; nominal scale; ordinal scale.
1
INTRODUCTION
26Cohen (1960) introduced the kappa coefficient κ = (po− pe)/(1 − pe) to quantify
27
the agreement between two raters classifying N items on a binary or nominal
28
scale. He corrected the proportion of items with concordant classification (po)
29
for the proportion of concordant pairs expected by chance (pe) and standardized
30
the quantity to obtain a value 1 when the agreement between the two raters is
31
perfect and 0 when the observed agreement is equal to the agreement expected
32
by chance. There are situations where the agreement between an isolated rater
33
and a group of raters is needed. For example, each of a series of individuals may
34
be assessed against a group of experts and a ranking of the individuals may be
35
required. Conversely, agreement may be searched between a group of users and a
36
gold standard. Usually in such instances, a consensus is determined in the group of
37
raters and the problem is reduced to the case of measuring agreement between the
38
isolated rater and the consensus in the group (Landis and Koch 1977, Soeken and
39
Prescott 1986, Salerno et al. 2003). The consensus may be defined as the category
40
chosen by a given proportion of the raters in the group (for example, Ruperto et
41
al. (2006) defined the consensus as the category chosen by at least 80% of the
42
raters in the group) or the category the most frequently chosen by the raters in
43
the group (Kalant et al. (2000), Smith et al. (2003)). In both cases, the problem of
44
how to handle items without consensus arises. Ruperto et al. (2006) discarded all
45
patients without consensus from the analysis, while Kalant et al. (2000) and Smith
et al. (2003) did not encounter the problem. The method consisting in reducing
47
the judgements made by a group of raters into a consensus decision was criticized
48
by Eckstein et al. (1998), Salerno et al. (2003) and Miller et al. (2004). Eckstein
49
et al. (1998) investigated the bias that may result from removing items without
50
consensus, while Salerno et al. (2003) argued that the dispersion likely to occur
51
in the classifications made by the raters in the group may not be reflected in the
52
consensus. Finally, Miller et al. (2004) examined the possibility to obtain different
53
conclusions by using different rules of consensus. Light (1971) developed a statistic
54
for comparing the joint agreement of several raters with a gold standard. This
55
statistic is a mixture of the proportions of concordant pairs obtained between each
56
of the rater in the group and the gold standard (the isolated rater). His method
57
leads to tedious calculations, does not quantify the agreement between the gold
58
standard and the group of raters and the calculations have not been extended to
59
the case of a group including more than 3 raters. Williams (1976) developed a
60
measure for comparing the joint agreement of several raters with another rater
61
without determining a consensus in the group of raters. Indeed, he compared the
62
mean proportion of concordant items between the isolated rater and each rater
63
in the group to the mean proportion of concordant items between all possible
64
pairs of raters among the group of raters. The ratio derived (Williams’ index) is
65
compared to the value of 1. Unfortunately, the coefficient proposed by Williams
66
(1976) does not correct for agreements due to chance and does not quantify the
agreement between the isolated rater and the group of raters. Finally, Schouten
68
(1982) developed a method of hierarchical clustering based on pairwise weighted
69
agreement measures to select one or more homogeneous subgroups of raters when
70
several raters classify items on a nominal or an ordinal scale. Hereafter, we propose
71
a coefficient for quantifying the agreement between an isolated rater and a group
72
of raters, which overcomes the problem of consensus, generalizes the approach of
73
Schouten (1982) and possesses the same properties as Cohen’s kappa coefficient.
74
2
DEFINITION OF THE AGREEMENT INDEX
75
2.1
Binary scale (K=2)
76
Consider a population I of items and a population R of raters. Suppose that the
77
items have to be classified on a binary scale by the population of raters and by an
78
independent isolated rater. Let Xi,r be the random variable such that Xi,r = 1 if a
79
randomly selected rater r of the population R classifies a randomly selected item
80
i of population I in category 1 and Xi,r = 0 otherwise. Let E(Xi,r) = P (Xi,r =
81
1) = pi over the population of raters. Then, over the population of items, let
82
E(pi) = π and σ2 = var(pi). In the same way, let Yi denote the random variable
83
equal to 1 if the isolated rater classifies item i in category 1 and Yi = 0 otherwise.
84
Over the population of items, E(Yi) = π∗ and var(Yi) = σ∗2= π∗(1 −π∗). Finally,
85
let ICC denote the intraclass correlation coefficient in the population of raters
Table 1: Theoretical model for the classification of a randomly selected item i on a binary scale by the population of raters R and the isolated rater
Isolated rater R 0 1 0 E[(1 − pi)(1 − Yi)] E[(1 − pi)Yi] 1 − π (1 − π)(1 − π∗) + ρσσ∗ (1 − π)π∗− ρσσ∗ 1 E[pi(1 − Yi)] E[piYi] π π(1 − π∗) − ρσσ∗ ππ∗+ ρσσ∗ 1 − π∗ π∗ 1 (Fleiss 1981) 87 ICC = σ 2 π(1 − π) (1)
and ρ the correlation between pi and Yi over I
88
ρ = E(piYi) − ππ
∗
σσ∗ . (2)
Using these definitions, a 2×2 table can be constructed cross-classifying the
popu-89
lation of raters R and the isolated rater with respect to the binary scale (Table 1).
90
91
The probability that the population of raters and the isolated rater agree on
92
item i is defined by
93
so that, over the population of items I, the mean probability of agreement is given
94
by the expression
95
ΠT = E(Πi) = ππ∗+ (1 − π)(1 − π∗) + 2ρσσ∗ (4)
By definition, the population of raters and the isolated rater are considered to be
96
in "perfect agreement" if and only if
97
π = π∗ = π∗∗ and ρ = 1. (5)
In terms of the random variables pi and Yi over I this is equivalent to writing
98
pi = π∗∗(1 −
√
ICC) +√ICCYi (6)
It follows from Equation 4 that the maximum attainable probability of perfect
99 agreement is given by 100 ΠM = 1 − 2π∗∗(1 − π∗∗)(1 − √ ICC) (7)
which turns out to be equal to 1 only if ICC = 1, i.e. that there is perfect
101
agreement between all raters in population R, or trivially if π∗∗= 0 or 1.
102
Then, the coefficient of agreement between the population of raters and the
103
isolated rater is defined in a kappa-like way:
104
κ = ΠT − ΠE ΠM − ΠE
(8)
where ΠE is the agreement expected by chance, i.e., the probability that the
pop-105
ulation of raters and the isolated rater agree under the independence assumption
(E(piYi) = E(pi)E(Yi)), defined by
107
ΠE = ππ∗+ (1 − π)(1 − π∗) (9)
Note that ΠT = ΠE when there is no correlation between the ratings of the
pop-108
ulation of raters and the isolated rater (ρ = 0) or when there is no variability in
109
the classification made by the populations of raters (σ2 = 0) or by the isolated
110
rater (σ∗2= 0).
111
112
An intraclass version of the agreement index κI may be derived by assuming
113 that π = π∗ = π∗∗. It leads to 114 κI = ρ = E(piYi) − π∗∗ σqπ∗∗(1 − π∗∗) (10)
2.2
Multinomial scale (K>2)
115When K > 2, the coefficient of agreement between the population of raters and
116
the isolated rater is defined by
117 κ = PK j=1(Π[j]T − Π[j],E) PK j=1(Π[j]M − Π[j]E) = ΠT − ΠE ΠM − ΠE (11)
where Π[j]T, Π[j]E and Π[j]M correspond to the quantities described in the 2 × 2
118
case when the nominal scale is dichotomized by grouping all categories other than
119
category j together and ΠT, ΠE and ΠM are defined respectively by
120 ΠT = K X j=1 E(pijYij); ΠE = K X j=1 πjπ∗j;
ΠM = K X j=1 E((π∗∗ j + (1 − π∗∗j ) q ICCj)Yij) (12)
where pij denotes the probability for a randomly selected item i to be classified
121
in category j (j = 1, · · · , K) by the population of raters with E(pij) = πj and
122
Yij denotes the random variable equal to 1 if the isolated rater classifies item i in
123
category j (Yij = 0 otherwise). Finally, ICCj denotes the intraclass correlation
124
coefficient relative to category j (j = 1, · · · , K) in the population of raters.
125
126
The coefficient κ possesses the same properties as Cohen’s kappa coefficient,
127
κ = 1 when agreement is perfect (ΠT = ΠM), κ = 0 if observed agreement is equal
128
to agreement expected by chance (ΠT = ΠE) and κ < 0 if observed agreement is
129
lower than expected by chance (ΠT < ΠE).
130
2.3
Ordinal scale (K>2)
131
A weighted version of the agreement index can be defined in a way similar to the
132
weighted kappa coefficient (Cohen 1968),
133 κW = ΠT,W − ΠE,W ΠM,W − ΠE,W (13) with 134 ΠT,W = K X j=1 K X k=1 wjkE(pijYik); (14) 135 ΠE,W = K X j=1 K X k=1 wjkπjπ∗k; (15)
136 ΠM,W = K X j=1 K X k=1 wjkE(π∗∗(1 − q ICCj)Yik) + K X k=1 q ICCk. (16)
In general, 0 ≤ wjk ≤ 1 and wkk = 1, (j, k = 1, · · · , K). Cicchetti and Allison
137
(1971) have defined absolute weights wjk = 1 −|j − k|
K − 1 whereas Fleiss and Cohen
138
(1973) suggested quadratic weights wjk = 1 − j − k
K − 1
!2
.
139
3
ESTIMATION OF THE PARAMETERS
140
Suppose that a random sample of N items drawn from population I is classified on
141
a K-categorical scale by a random sample (group) of size R from the population
142
of raters R and by an independent isolated rater.
143
3.1
Binary scale (K = 2)
144
Let xi,r denotes the observed value of the random variable Xi,rdenoting the rating
145
of rater r of the population R (i = 1, · · · , N; r = 1, · · · , R). Let yi denotes the
146
observed value of the random variable Yi representing the rating of the isolated
147
rater. Then, let ni =PRr=1xi,r denotes the number of times the item i is classified
148
in category 1 by the group of raters and let pbi = ni/R denote the corresponding
149
proportions (i = 1, · · · , N).
150
151
The intraclass correlation coefficient in the group of raters is estimated by
(Fleiss 1981) 153 d ICC = 1 − PN i=1ni(R − ni) RN (N − 1)p(1 − p) (17)
where p is the proportion of items classified in category 1 by the group of raters,
p = 1 N N X i=1 b pi.
The probability that the population of raters and the isolated rater agree is
154
estimated by the observed proportion of agreement,
155 b ΠT = po = 1 N N X i=1 (pbiyi+ (1 −pbi)(1 − yi)). (18)
Clearly, po = 1 if the raters of the group and the isolated rater classify each item
156
in the same category and po= 0 if the isolated rater systematically classifies items
157
in a category never chosen by the group of raters.
158
159
The probability of agreement expected by chance is estimated by the
propor-160
tion of agreement expected by chance,
161
pe= py + (1 − p)(1 − y) (19)
where y is the proportion of items classified in category 1 by the isolated rater,
y = 1 N N X i=1 yi.
The degree of agreement κ between the group of raters and the isolated rater
162
is then estimated by
b
κ = po− pe pm− pe
(20) where pm corresponds to the maximum possible proportion of agreement derived
164
by the data. We have
165 pm = 1 N N X i=1 max(pbi, 1 −pbi). (21)
3.2
Multinomial scale (K > 2)
166The estimation of the parameters easily extends to the case K > 2. Let xij,rdenote
167
the observed value of the random variable Xij,r equal to 1 if rater r (r = 1, · · · , R)
168
of the group classified item i (i = 1, · · · , N) in category j (j = 1, · · · , K) and equal
169
to 0 otherwise. In the same way, let yij denote the observed value of the random
170
variable Yij corresponding to the rating of the isolated rater. Let nij =PRr=1xij,r
171
denotes the number of times the item i is classified in category j by the raters of
172
the group and letpbij denote the corresponding proportions. We havePKj=1pbij = 1,
173
(i = 1, · · · , N). The data can be conveniently summarized in a 2-way classification
174
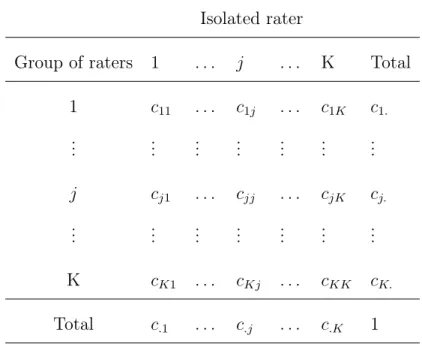
table (see Table 2) by defining the quantities
175 cjk = 1 N N X i=1 b pijyik, j, k = 1, · · · , K (22)
The observed proportion of agreement between the group of raters and the
176
isolated rater is defined by
177 po = 1 N N X i=1 K X j=1 pijyij = K X j=1 cjj (23)
Table 2: Two-way classification table of the N items by the group of raters and the isolated rater
Isolated rater
Group of raters 1 . . . j . . . K Total 1 c11 . . . c1j . . . c1K c1. ... ... ... ... ... ... ... j cj1 . . . cjj . . . cjK cj. ... ... ... ... ... ... ... K cK1 . . . cKj . . . cKK cK. Total c.1 . . . c.j . . . c.K 1
The marginal classification distribution of the isolated rater, namely,
178 yj = 1 N N X i=1 yij, j = 1, · · · , K (24)
withPKj=1yj = 1 and the marginal classification distribution of the group of raters,
179 pj = 1 N N X i=1 b pij, j = 1 · · · , K (25) with PK
j=1pj = 1 are needed to estimate the agreement expected by chance. The
180
proportion of agreement expected by chance is given by
181 pe= K X j=1 pjyj = K X j=1 cj.c.j (26)
The degree of agreement κ between the population of raters and the isolated
182
rater is then estimated by
b
κ = po− pe pm− pe
(27) where pm corresponds to the maximum possible proportion of agreement derived
184
from the data,
185 pm = 1 N N X i=1 maxjpij. (28)
Note that when R = 1, pm= 1 and the agreement coefficient κ reduces to theb
186
classical Cohen’s kappa coefficient defined in the case of two isolated raters.
187
188
The intraclass correlation coefficient in the group of raters is estimated by
189 (Fleiss 1981) 190 d ICC = 1 − N R 2−PN i=1 PK j=1n2ij N R(R − 1)PK j=1pj(1 − pj) (29)
3.3
Ordinal scale (K > 2)
191The estimation of the weighted agreement index is done by merely introducing
192
weights in the estimations previously defined. Hence,
193 b κW = po,w− pe,w pm,w− pe,w (30) with 194 po,w = 1 N N X i=1 K X j=1 K X k=1 wjkpijyik pe,w = K X j=1 K X k=1 wjkpjyk pm,w = 1 N N X i=1 maxj( K X k=1 wjkpik). (31)
The unweighted agreement indexκ can be obtained using the weights wb jj = 1
195
and wjk = 0, j 6= k.
196
4
ASYMPTOTIC SAMPLING VARIANCE
197
The Jackknife method (Efron and Tibshirani, 1993) was used to determine the
198
sampling variance of the agreement index. Suppose that the agreement between
199
the isolated rater and the population of raters was estimated on a random sample
200
of N items. Let κbN denote that agreement index and κb(i)N −1 denote the estimated
201
agreement index when observation i is deleted. These quantities are used to
de-202
termine the pseudo-values
203
b
κN,i = NκbN − (N − 1)κb(i)N −1 (32)
The Jackknife estimator of the agreement index is then defined by
204 e κN = 1 N N X i=1 b κN,i (33) with variance 205 var(κeN) = 1 N ( 1 N − 1 N X i=1 (κbN,i−κbN)2 ) (34) The bias of the Jackknife estimator is estimated by
206
5
CONSENSUS APPROACH
207The consensus approach consists in summarizing the responses given by the raters
208
of the group in a unique quantity. Most approaches define the modal category
(ma-209
jority rule) or the category chosen by a prespecified proportion of raters (≥ 50%)
210
as the consensus category. A random variable Zij is then defined to be equal to
211
1 if category j corresponds to the consensus category given by the population R
212
of raters for item i and equal to 0 otherwise. It is obvious that a consensus may
213
not always be defined. For example, on a multinomial scale, we could have two
214
modal categories or no category chosen by the prespecified proportion of raters.
215
Therefore, suppose that on the N items drawn from population I, a consensus can
216
only be defined on NC ≤ N items. Let IC denote the sub-population of items on
217
which a consensus is always possible. If zij denotes the observed value of the
ran-218
dom variable Zij, we havePKj=1zij = 1 and the agreement between the population
219
of raters and the isolated raters is reduced to the case of 2 isolated raters. The
220
Cohen intraclass or weighted kappa coefficient can then be estimated. Note that
221
the strenght of the consensus is not taken into account by the random variable
222
Zij. For example on a binary scale, using the majority rule, we will have Zij = 1
223
if pij = 0.6 but also if pij = 0.9. It can easily be shown that the new
method-224
ology defined and the consensus approach are equivalent only in two particular
225
cases, firstly when there is only one rater in the group of raters (R = 1) and
226
secondly when IC = I and there is perfect agreement in the population of raters
(ICC = 1). 228
6
EXAMPLES
2296.1
Syphilis serology
230A proficiency testing program for syphilis serology was conducted by the College
231
of American Pathologists (CAP). For the fluorescent treponemal antibody
absorp-232
tion test (FTA-ABS), 3 reference laboratories were identified and considered as
233
experts in the use of that test. During 1974, 40 syphilis serology specimens were
234
tested independently by the 3 reference laboratories. Williams (1976) presented
235
data for 28 specimens. To evaluate the performance of a participant, the
agree-236
ment between the participant and the 3 reference laboratories had to be evaluated.
237
The data are summarized in a two-way classification table (Table 3) as explained
238
is section 2.3.
239
Using the quadratic weighting scheme, the weighted coefficient of agreement
240
b
κW amounted 0.79 ± 0.06. When applying the consensus approach based on the
241
majority rule, we found a weighted kappa coefficient of 0.76 ± 0.06. Remark that
242
2 specimens were eliminated because no consensus was found in the group of the
243
3 reference laboratories. Finally, the weighted agreement measure developed by
244
Schouten (1982) was 0.73 ± 0.07. Note that the intraclass correlation coefficient
245
was 0.68 ± 0.06 in the group of raters.
Table 3: Two-way classification table of the 28 syphilis serology specimens as NR (non-reactive), B (borderline) and R (reactive) by 3 reference laboratories and a participant
Participant
Reference laboratories NR B R Total
NR 0.143 0.250 0.024 0.417
B 0 0.036 0.071 0.107
R 0 0 0.476 0.476
Total 0.143 0.286 0.571 1
6.2
Script Test of Concordance
247
The Script Test of Concordance (SCT) is used in medicine to evaluate the ability
248
of physicians or medical students (isolated raters) to solve clinical situations not
249
clearly defined (Charlin et al. 2002). The complete test consists of a number of
250
items (1, · · · , N) to be evaluated on a 5-point Likert scale (K = 5). Each item
251
represents a clinical situation likely to be seen in real life practice and a
poten-252
tial assumption is proposed with it. The situation has to be unclear, even for an
253
expert. The task of the student or the physician being evaluated is to consider
254
the effect of additional evidence on the suggested assumption. In this respect, the
255
candidate has to choose between the following proposals: (-2) The assumption is
256
practically eliminated; (-1) The assumption becomes less likely; (0) The
tion has no effect on the assumption; (+1) The assumption becomes more likely
258
and (+2) The assumption is practically the only possibility. The questionnaire is
259
also given to a panel of experts (raters 1, · · · , R). The problem is to evaluate the
260
agreement between each individual medical student and the panel of experts.
261
262
Between 2003 and 2005, the SCT was proposed to students specializing in
gen-263
eral practice at the University of Liège, Belgium (Vanbelle et al. 2007). The SCT
264
consisted of 34 items relating possible situations encountered in general practice.
265
There were 39 students passing the test and completing the entire questionnaire.
266
Their responses were confronted to the responses of a panel of 11 experts. The
267
intraclass correlation coefficient was 0.22 ± 0.04 in the group of experts. Using
268
the quadratic weighting scheme, the individualκbW coefficients for the 39 students
269
ranged between 0.37 and 0.84. The mean value (±SD) was 0.61 ± 0.12.
270
Using the consensus method, where consensus was defined as either the
major-271
ity of the raters or a proportion of at least 50% of the raters, respectively 2 (6%)
272
and 12 (35%) items had to be omitted from the analysis because no consensus was
273
reached among the raters. The mean weighted kappa values for the 39 students
274
were equal to 0.49 ± 0.13 (range: 0.19-0.72) and 0.66 ± 0.14 (range: 0.23-0.82)
275
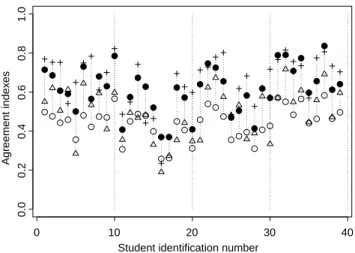
with the majority and the 50% rules, respectively. Figure 1 displays the
individ-276
ual agreement coefficients relative to each student for the different methods. A
277
ranking of the student was needed in order to select only the best students. The
Student identification number 0 10 20 30 40 0.0 0.2 0.4 0.6 0.8 1.0 Agreement indexes
Figure 1: Values of κW (•), weighted κ coefficients using the majority (△) and the
50% (+) rules and weigthed agreement index of Schouten (◦) for the 39 students passing the SCT
ranking changed markedly for some students according to the method used. For
279
example, student No. 39 ranked at the 16th place with the new approach, the 9th
280
place with Schouten index, the 10th place using the majority rule and at 20th
281
place using the 50% rule.
282
7
DISCUSSION
283
The method described in this paper was developed to quantify the agreement
be-284
tween an isolated rater and a group of raters judging items on a categorical scale.
285
A population-based approach was used but in case of a fixed group of raters,
es-286
timates are replaced by actual values. The derived agreement index κ possesses
the same properties as Cohen’s kappa coefficient (Cohen 1960) and reduces to it
288
if there is only one rater in the group. The isolated rater and the group of raters
289
are defined to be in perfect agreement when they have the same probability, for
290
each item, to classify this item in a given category and the correlation coefficient
291
between the isolated rater and the population of raters is equal to 1. It can be
292
shown that with the additional assumption of perfect agreement in the population
293
of raters (ICC = 1), the proposed agreement index κ is algebraically equivalent
294
to the agreement coefficient derived by Schouten (1982). In other terms, perfect
295
agreement can be reached between the isolated rater and the population of raters
296
even if no perfect agreement occurs in the population of raters unlike the
agree-297
ment index of Schouten (1982). The new approach is equivalent to the consensus
298
approach when it is possible to determine a consensus for all items of the sample
299
and there is perfect agreement in the group of raters on each item. The proposed
300
method is superior the consensus approach in the sense that no decision has to
301
be made if there is no consensus in the group. Moreover, the new approach takes
302
into account the variability in the group while the strength of consensus is not
303
taken into account with the consensus method. Finally, as illustrated in the SCT
304
example and pointed out by Salerno et al. (2003) and Miller et al. (2004), the
re-305
sults may vary substantially according to the definition of the consensus used. The
306
proposed kappa coefficient thus provides an alternative to the common approach
307
which consists in summarizing the responses given by the raters in the group into
a single response (the consensus) and generalizes the agreement index proposed
309
by Schouten (1982). Further, it has the advantage of using more information than
310
the consensus method (variability in the group of raters), of solving the problem
311
of items without consensus and of being built upon less stringent assumptions.
312
Experts can fix levels to interpret the values taken by the new coefficient and
313
determine a lower bound under which the isolated rater may be rejected as in the
314
SCT selection process or considered as "out of range".
315
References
316Charlin, B., R. Gagnon, L. Sibert and C. Van der Veluten (2002), Le
317
test de concordance de script : un instrument d’évaluation du raisonnement
318
clinique, Pédagogie Médicale 3, 135–144.
319
Cicchetti, D.V. and T. Allison (1971), A new procedure for assessing
reli-320
ability of scoring EEG sleep recordings, American Journal of EEG Technology
321
11, 101–109.
322
Cohen, J. (1960), A coefficient of agreement for nominal scales, Educational and
323
Psychological Measurement 20, 37–46.
324
Cohen, J. (1968), Weighted Kappa: nominal scale agreement with provision for
325
scaled disagreement or partial credit, Psychological Bulletin 70, 213–220.
Eckstein, M.P., T.D. Wickens, G. Aharonov, G. Ruan, C.A. Morioka
327
and J.S. Whiting(1998), Quantifying the limitations of the use of consensus
328
expert commitees in ROC studies, Proceedings SPIE: Medical Imaging 1998:
329
Image perception 3340, 128–134.
330
Efron, B. and R.J. Tibshirani(1993), An introduction to the bootstrap,
Chap-331
man and Hall, New York.
332
Fleiss, J.L. and J. Cohen (1973), The equivalence of weighted kappa and
333
the intraclass correlation coefficient as measure of reliability, Educational and
334
psychological measurement 33, 613–619.
335
Fleiss, J.L. (1981), Statistical methods for rates and proportions (2nd edition),
336
John Wiley, New York
337
Kalant, N., M. Berlinguet, J.G. Diodati, L. Dragatakis and F.
Mar-338
cotte (2000), How valid are utilization review tools in assessing appropriate
339
use of acute care beds? Canadian Medical Association Journal 162, 1809–1813.
340
Landis, J.R. and G.G. Koch(1977), An application of hierarchical kappa-type
341
statistics in the assessment of majority agreement among multiple observers,
342
Biometrics 33, 363–374.
343
Light, R.J. (1971), Measures of response agreement for qualitative data: some
344
generalizations and alternatives, Psychological bulletin 76, 365–377.
Miller, D.P., K.F. O”Shaughnessy, S.A. Wood and R.A. Castellino
346
(2004), Gold standards and expert panels: a pulmonary nodule case study with
347
challenges and solutions, Proceedings SPIE: Medical Imaging 1998: Image
per-348
ception, Observer Performance and Technology Assessment 5372, 173–184.
349
Ruperto, N., A. Ravelli, S. Oliveira, M. Alessio, D. Mihaylova,
350
S. Pasic, E. Cortis, M. Apaz, R. Burgos-Vargas, F.
Kanakoudi-351
Tsakalidou, X. Norambuena, F. Corona, V. Gerloni, S. Hagelberg,
352
A. Aggarwal, P. Dolezalova, C.M. Saad, S.C. Bae, R. Vesely, T.
353
Avcin, H. Foster, C. Duarte, T. Herlin, G. Horneff, L. Lepore,
354
M. van Rossum, L. Trail, A. Pistorio, B. Andersson-Gare, E.H.
Gi-355
annini and A. Martini (2006), Pediatric Rheumatology International
Tri-356
als Organization. The pediatric Rheumatology International Trials
Organiza-357
tion/American College of Response to Therapy in Juvenile Systemic Lupus
Ery-358
thematosus: Prospective Validation of the Definition of Improvement, Arthritis
359
and Rheumatism (Arthritis Care and Research) 55, 355–363.
360
Salerno, S.M., P.C. Alguire and S.W. Waxman (2003), Competency in
361
interpretation of 12-Lead Electrocardiograms: A summary and Appraisal of
362
Published Evidence, Annals of Internal Medicine 138, 751–760.
363
Schouten, H.J.A.(1982), Measuring pairwise interobserver agreement when all
364
subjects are judged by the same observers, Statistica Neerlandica 36, 45–61.
Smith, R., A.J. Copas, M. Prince, B. George, A.S. Walker and S.T.
366
Sadiq (2003), Poor sensitivity and consistency of microscopy in the diagnosis
367
of low grade non-gonococcal urethritis, Sexually Transmitted Infections 79, 487–
368
490.
369
Soeken, K.L. and P.A. Prescott(1986), Issues in the use of kappa to estimate
370
reliability, Medical care 24, 733–741.
371
Vanbelle, S., V. Massart, D. Giet and A. Albert (2007), Test de
concor-372
dance de script: un nouveau mode d’établissement des scores limitant l’effet du
373
hasard, Pédagogie Médicale 8, 71–81.
374
Williams, G.W.(1976), Comparing the Joint Agreement of Several Raters with
375
Another Rater, Biometrics 32, 619–627.