Aerosol filtration using electrospun cellulose acetate fibers
The MIT Faculty has made this article openly available. Please sharehow this access benefits you. Your story matters.
Citation Chattopadhyay, Saptarshi, T. Alan Hatton, and Gregory C. Rutledge. “Aerosol Filtration Using Electrospun Cellulose Acetate Fibers.” Journal of Materials Science 51, no. 1 (July 31, 2015): 204–217. As Published http://dx.doi.org/10.1007/s10853-015-9286-4
Publisher Springer US
Version Author's final manuscript
Citable link http://hdl.handle.net/1721.1/103340
Terms of Use Creative Commons Attribution-Noncommercial-Share Alike Detailed Terms http://creativecommons.org/licenses/by-nc-sa/4.0/
1
Aerosol Filtration using Electrospun Cellulose Acetate Fibers
Saptarshi Chattopadhyay, T. Alan Hatton, Gregory C. Rutledge* Department of Chemical Engineering
Massachusetts Institute of Technology Cambridge, MA 02139
*Corresponding author. Tel.: +1 617 253 0171; Fax: +1 617 324 3127 E-mail address: [email protected] (G. C. Rutledge)
To be submitted: Journal of Material Science, Special: 50th Anniversary Issue
Abstract
Aerosol filtration using electrospun cellulose acetate filters with different mean fiber diameters is reported, and the results are compared with those for two conventional filter media, a glass fiber filter and a cellulose acetate microfiber filter. The performance of these filters was studied using two aerosols, one solid (NaCl) and one liquid (diethyl hexyl sebacate, DEHS), under conditions of relatively high face velocity (45 cm/s). The experimental observations are compared to theoretical predictions based on single fiber filtration efficiency. Our results indicate that the mechanisms for single fiber filtration efficiency provide reasonable predictions of the most penetrating particle size (MPPS), in the range of 40-270 nm, percentage penetration from 0.03-70%, and fiber diameter in the range from 0.1-24 µm. Using an analysis based on blocking filtration laws, we conclude that filtration by cake formation dominated in the case of NaCl aerosols on electrospun filter media, whereas filters with larger fiber diameter showed a transition in mechanisms, from an initial regime characterized by pore blocking to a later regime characterized by cake formation. The liquid aerosol did not exhibit cake formation, even for the smallest fiber diameters, and also had much smaller influence on pressure drop than did the solid aerosol. The electrospun filters demonstrated slightly better quality factors compared to the commercial glass fiber filter, at a much lower thickness. In general this study demonstrates control of the properties of electrospun cellulose acetate fibers for air filtration application.
2
Keywords: Air Resistivity, Single Fiber Efficiency, Quality Factor, Electrospinning, Fouling, Penetration
Introduction
Aerosol filters have a wide range of applications, among them respirators, high volume air samplers, engine exhaust filters, clean room filters and cigarette filters. Each filter must meet specific requirements when subjected to standard test conditions [1, 2]. For example, the operating face velocity of interest is less than 10 cm/s for filters used in engine exhaust, clean room and respirator filters [3, 4], 30-60 cm/s for cigarette filters [5] and 2-12 m/s for inertial filters [6]. Generally, aerosol filters aim to minimize both the particle penetration (P) and the pressure drop (Δp) across the filter. Particle penetration is defined as the ratio of particle number concentration downstream to that upstream of the filter. Overall performance of the filter is often evaluated using the quality factor QF= –ln P/Δp [7, 8]. From an applications point of view, the deposited mass of aerosol at which a filter clogs is also very important [9]. Thus, to determine the useful life of an air filter, its performance over duration of time is of interest. Both the quality factor and the useful life of a filter primarily depend on fiber diameter and operating face velocity.
Theoretically and empirically, particle penetration is found to be a function of particle diameter or dp, permitting a filter to be selective with respect to incoming particle sizes. The peak
of this curve of penetration versus dp is called the most penetrating particle size (MPPS), defined
as the aerosol size for which the probability of particle penetration through the filter is maximal. Typically, the MPPS for mechanical filters (i.e. filters without electrostatic interaction with aerosol) occurs between 0.1 to 0.5 µm [7, 10], and properties such as fiber diameter, filter thickness and filter solidity are used to control filtration characteristics. Reduction in fiber diameter has been shown to influence such properties as particle penetration, MPPS, pressure drop and filter clogging [7, 11-13]; nevertheless, there are few studies that extend these relationships to filters comprising fibers of submicrometer diameter. It is yet not clear if controlling the fiber diameter of homogenous filters below the micrometer range can help in developing specific filter media properties.
3
“Nanofibers” is a term usually reserved in the nonwovens industry for fibers with diameters less than 0.5 µm [14]. Nanofibers reduce penetration and lower the MPPS of the filters containing them [15]. However, the corresponding pressure drop across a filter made of nanofibers tends to be higher than one made of larger diameter fibers, even at a relatively low face velocity of 5 cm/s [16]. High Δp is a consequence of the high surface area-to-volume ratio of nanofibers and limits their application as stand-alone, or homogeneous, filter media. It has been observed that a 0.2 mm thick filter medium composed of 100 nm diameter fibers exhibited a Δp of 1295 Pa, whereas a 3 mm thick microfiber filter composed of 10 µm diameter fiber s exhibited Δp of 173 Pa [13]. However, the P value of the nanofiber filter was less than that of the microfiber filter by three orders of magnitude. Thus, composite filters where nanofibers are added on the top of microfibers, enjoy the advantages pertinent to both types of fibers present in the filter medium [13, 14, 17].
Electrospinning technology is often selected for nanofiber generation, based on its simplicity and cost effectiveness [12, 18]. The generated fiber diameters are narrowly distributed, and thus their filtration properties can be controlled with acceptable accuracy [19-21]. By varying the choice of precursor solution, process parameters, and post-processing techniques, the properties of electrospun fibers such as fiber morphology, fiber diameter, filter thickness and solidity can be manipulated [17, 22-26]. Electrospun filters made of poly(acrylonitrile), polyamide and polylactic acid have been shown to exhibit aerosol filtration efficiencies comparable to those of commercial high-efficiency aerosol filters (penetration < 0.05%) [12, 19, 23, 27].
In this work, the complex process of particle-fiber interaction was studied with five different homogenous cellulose acetate filters with mean fiber diameters between 0.1-1.0 µm, fabricated by electrospinning. Cellulose acetate is one of the first synthetic fiber materials and has the advantages of low cost and environmental degradability [28]. A commercial glass fiber filter of average fiber diameter 0.5 µm and a filter obtained by compressing a cellulose acetate microfiber material having a trilobal morphology and an average fiber diameter of 24 µm, such as that typically used to form cigarette filters, were used as controls. Filtration performance was evaluated using both solid and liquid aerosols at a relatively high face velocity of 45 cm/s, consistent with conditions for which the conventional microfiber filter was designed. Filters were evaluated in terms of overall particle penetration P, MPPS, pressure drop Δp, quality factor QF,
4
and filter clogging. Results are compared with empirical correlations to understand particle-fiber interaction as a function of fiber diameter.
Materials and methods
Materials
Submicrometer fibers were generated by electrospinning using precursor solutions having 11, 15 and 17 wt% cellulose acetate (CAS: 9004-35-7, Mn~ 30,000 g/mol) in a solvent that
contains three parts by weight acetone (HPLC grade, CAS: 67-64-1, M=58.08 g/mol) and one part N,N-dimethylacetamide (DMAc, anhydrous, CAS 127-19-5, M=87.12 g/mol). These solutions are denoted 11CA, 15CA and 17CA, respectively. The conductivities of the precursor solutions were less than 10 µS/cm, at which electrospinning was difficult. Thus, the conductivities of all polymer solutions were increased to 70-80 µS/cm using trace amounts (0.035 wt%) of tetraethyl ammonium chloride (CAS 56-34-8, M=165.7 g/mol). All chemicals were procured from Sigma Aldrich (St. Louis MO, USA). A commercial glass fiber filter (GF) (Type A/E, 13 mm, Pall Life Sciences, Port Washington, NY, USA) was used as received. This air filter is rated to retain 99.98% of 0.3 μm aerosol (dioctyl phthalate oil) at 0.32 L/cm2/min according to the ASTM D 2986-95A filter standard. Large cellulose acetate fibers with micrometer-sized, tri-lobal cross-sections were supplied by Philip Morris International (Neuchâtel, Switzerland). For this study, cylindrical cigarette filters were opened by cutting the wrapping paper along its length and manually spreading the fibers apart into rectangular strips of width 2.7 cm and length 10.7 cm. These strips were compressed using a press (Carver Inc., Wabash, IN, USA) at 20 °C (room temperature) and 17 MPa for 18 hours to obtain filter mats having low variability in pressure drop (314 ± 44 Pa) when measured with a flow rate of 2.5 L/cm2/min at different locations along the strip. These compressed cellulose acetate microfiber filters are denoted “MFc” in this work. It should be noted that the fibers in the MFc filters are oriented predominantly perpendicular to the flow direction, in contrast to the filters on commercial cigarettes, where the fibers are predominantly parallel to the flow direction.
5
Electrospinning
Fibers were generated using the lab-scale NanospiderTM manufactured by Elmarco (Svarovska, Czech Republic). This technology employs free surface electrospinning from toothed electrodes so that high productivity is achieved through the simultaneous operation of numerous jets [29, 30]. The typical spinning voltage was 75-80 kV and the collector-to-electrode distance was 20 cm. The rotation of the electrode was 11.2 RPM. The number of jets was observed to be higher when processing solutions having higher mass concentration of polymer, so spinning times of 25, 15 and 7 minutes were used with the 11CA, 15CA and 17CA, respectively, to obtain consistent average filter thicknesses of about 40 μm. Using these solutions, we found it difficult to generate fibers with diameters larger than a micrometer using the Nanospider™. For this reason, the 17CA solution was also processed using a needle-plate configuration as described elsewhere [31]; the filter obtained is denoted 17CA_NP. The relative humidity was maintained at 50-60% and the temperature at 20-22°C for all electrospinning runs. Filter characterization, P and Δp measurements were performed using 13 mm diameter filter disks that were punched out from random locations on the nonwoven electrospun mats or rectangular microfiber filter strips.
Morphological Characterization
The average fiber diameter of the electrospun filters was calculated from the measurement of 30 to 50 fibers in images taken with a scanning electron microscope (SEM, JEOL-JSM-6060, Peabody, MA, USA) and analyzed using Image-J software (version 1.48, National Institutes of Health, Bethesda, Maryland, USA)[32]. The solidity was calculated gravimetrically, in which the filter thickness was measured using an adjustable measuring force digital micrometer (Model CLM 1.6” QM, Mitutoyo America Corporation, IL, USA) with a contact force of 0.5 N. The solidity (α) was then calculated using the following formula,
𝛼 =𝐴𝑡 𝜌𝑚
𝑃 (1)
where m is the filter mass, A is the filter area, t is the filter thickness and ρp is the bulk density of
6
Aerosol Generation
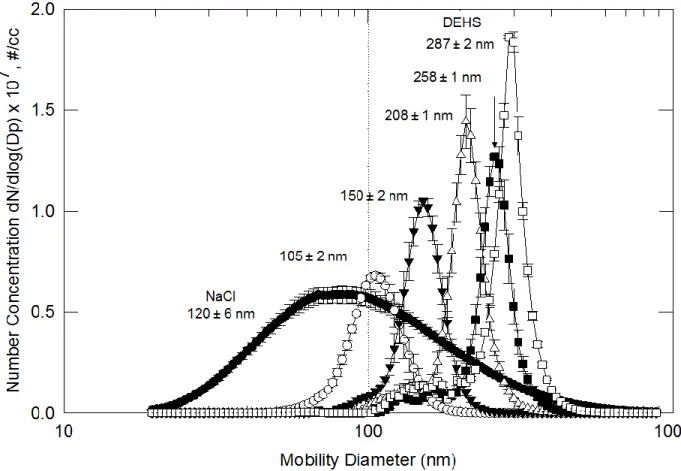
A commercial condensation monodisperse aerosol generator (CMAG, model 3475, TSI Inc., Shoreview, MN, USA) was used to generate liquid droplets by heterogeneous condensation of diethyl hexyl sebacate (DEHS, 426.67 g/mol) on NaCl aerosol nuclei generated by an inbuilt atomizer and diffusion drier [34]. The DEHS aerosols had relatively narrow size distributions (Geometric Standard Deviation or GSD < 1.35), with mean diameters that varied from 0.09-0.35 µm, as shown in Fig. 1. The penetration profiles for the DEHS aerosol over the entire particle size range were obtained as composites of five independent experiments, using five different aerosols with mean mobility diameters of 0.1, 0.15, 0.2, 0.25 and 0.29 m, as determined by the saturator temperature of the CMAG. Penetration values were calculated as a function of particle size by binning the data into bins of width 50 nm between 75-325 nm. Where there were overlapping bins of particle size from different experiments, the average values are reported. The solid aerosol was polydisperse (GSD > 1.7) and consisted of NaCl particles generated by atomization of 10 mg/ml NaCl using the CMAG atomizer and diffusion drier at an upstream pressure of 200 kPa. As shown in Fig. 1, the distribution of NaCl aerosol had sufficiently high number concentrations of particles in the size range 20-500 nm for good signal-to-noise. Both aerosol generators were followed by a custom-build diluter whose purpose was to reduce the aerosol concentration in nitrogen by 20x. The diluter was designed to minimize sampling losses, coagulation and hygroscopic growth, while providing nominal residence time of 0.75 s for the aerosol particle to thermally equilibrate. The number concentrations of both DEHS and NaCl aerosols after dilution ranged from 1 to 3 x 10⁶ #/cm3.
7
Fig. 1. Particle size distributions for the DEHS and NaCl aerosols used in this work. The particle size distribution is shown for NaCl (dp = 120 ± 6 nm) and DEHS aerosols (dp varied 105-287
nm).
Filtration Testing
The filter testing system is shown in Fig. 2, and consisted of two types of aerosol generators (for liquid and solid aerosols), a particle sizer, pressure transducer and 13 mm commercial aerosol filter holder. This custom-made system permits a wide variety of testing conditions and is not limited to standardized industrial test protocols, for which commercial automated filter testers and components are available. The relative humidity and temperature at the exit of the diluter was monitored using a RH/Temperature sensor (RH-USB, Omega Engineering, Inc., Stamford, CT, USA). A commercial 13 mm stainless steel filter holder (Cat No. XX3001200, Millipore Corporation, Billerica, MA, USA) having a filtration area of 0.8 cm2 was connected at the exit of the diluter. The air velocity at the surface of the filter (face velocity)
8
was controlled by a sump connected to the end of the line. A face velocity of 45 cm/s was used throughout this work. A differential pressure monitor (HD750, Extech Instruments Corporation, Nashua, NH, USA) was connected both upstream and downstream of the filter medium to measure the Δp across the filter at the prescribed face velocity, both for clean air and during filtration testing.
The penetration of particles was determined by measuring the concentration of particles at the filter holder outlet with and without a filter installed, and taking the ratio of these values, as reported elsewhere [19]. The particle sizer consisted of a differential mobility analyzer (DMA, TSI 3081, TSI Inc.) and condensation particle counter (CPC, TSI 3775, TSI Inc.). The sizer was operated to detect particles in the size range of 20-880 nm. All test aerosols were charge-neutralized by exposure to a radioactive neutralizer (TSI 3077A, TSI Inc.) before contacting the test filters, to negate any possible electrostatic interaction. This set up enabled measurement of the size-dependent penetration of particles, hereafter referred to as the “penetration distribution function”, P(dp), where P(dp) is the ratio of the number of particles of mobility diameter dp
measured downstream of the filter to those measured upstream of the filter. For purposes of comparison, we also report the total penetration, Ptot, evaluated as the ratio of the total number of
particles in the range 0.01 < dp < 1.0 m measured downstream of the filter to those measured
upstream of the filter. To determine the MPPS, a three parameter Gaussian curve was fitted to the experimentally obtained data for P(dp) versus dp, and the mode is reported as MPPS. All filter
materials were tested under identical conditions. All results were repeated at least three times for statistical consistency.
9 Fig.2. Equipment diagram for aerosol filtration testing
Results and Discussion
Theoretical Penetration
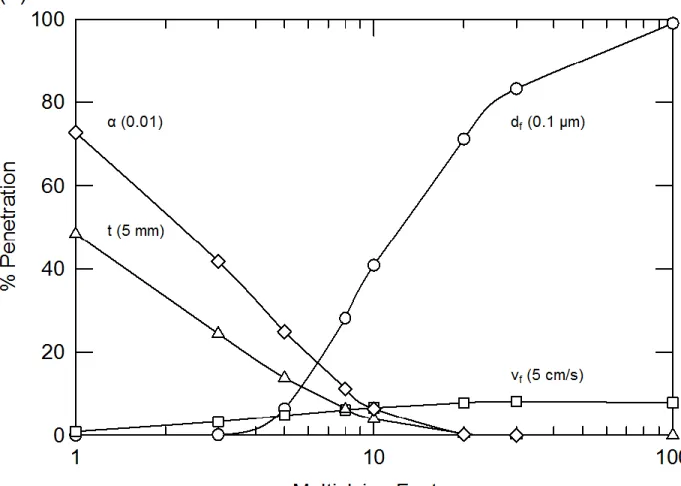
Theoretical penetration curves were calculated by accounting for each of the conventional aerosol deposition mechanisms (i.e. diffusion, interception, impaction, gravitational settling, and an interaction term to account for enhanced collection due to interception of the diffusing particles), as described elsewhere [7]. The empirical correlations for filtration efficiency in this work are available in the supporting information (S1). Four key parameters were varied, each one over two orders of magnitude above the base case (df = 0.1 μm, t = 5 m,
vf = 5 cm/s and α = 0.01). These parameters were fiber diameter, face velocity, filter thickness
and solidity. As each parameter was varied, the other three were kept constant at the following values, pertinent to conditions under which filters were evaluated in this study (df = 0.5 μm, t =
10
Fig. 3a shows that the theoretical total penetration increases with increases in either fiber diameter or face velocity, whereas the penetration decreases with increases in either filter thickness or solidity. Penetration can be altered from 0.01% to 99% for df =0.1 to 10 µm. These
calculations indicate that the most influential variable is fiber diameter, which can be effectively controlled over this range of diameters by the electrospinning process. Increases in face velocity resulted in marginal increases in Ptot. This is due to the fact that at low velocity, one expects
greater deposition of particles smaller than 0.3 m in diameter by the mechanism of diffusion, whereas at high velocity one expects greater deposition of particles larger than 0.5 m in diameter by the mechanism of impaction; these trends tend to offset one another. The theory indicates a drop in Ptot with increases in filter thickness or solidity, with the dependence on
solidity being slightly greater over this range of particle diameters. The drop in Ptot is attributed
to the increased likelihood of a particle-fiber interaction with increasing thickness or decreasing porosity. The thickness of the filter can be controlled by varying the electrospinning process time during fabrication.
11
Fig. 3. Relative effects of fiber diameter (df), filter thickness (t), face velocity (vf) and solidity ()
on the theoretical values for (a) total penetration Ptot (expressed as a percentage) and (b)
maximum penetrating particle size (MPPS). For each curve, the abscissa is plotted as a multiplying factor, by which the base case value (shown in parenthesis) is multiplied to obtain the actual value plotted. Each parameter was varied while holding the other parameters at the following values where relevant: df = 0.5 μm, t = 40 m, vf = 45 cm/s and α = 0.1.
Fig. 3b shows that the MPPS is also most sensitive to the fiber diameter. The MPPS increased from 0.03-0.3 m when fiber diameter was varied from 0.1-10 µm. The most significant change in MPPS occurs when fiber diameters are varied above one micrometer. Relatively smaller changes in MPPS are predicted when the other parameters are varied within the ranges examined in this study.
12
Fiber diameter and pressure drop
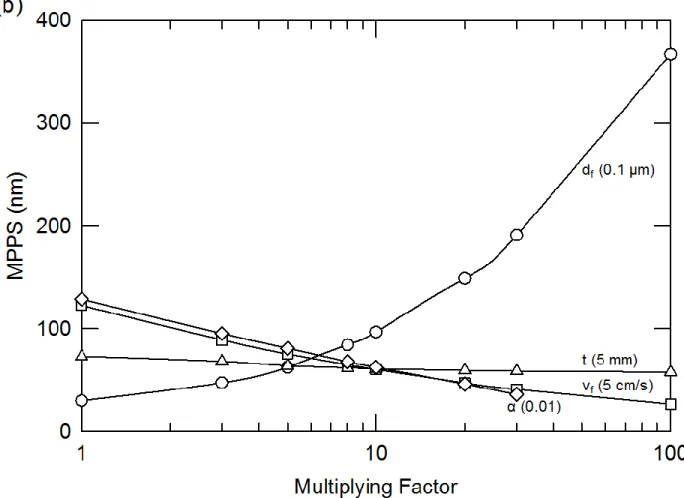
Fig. 4 shows SEM micrographs for the several filter materials examined in this work. The 11CA solution resulted in the smallest average fiber diameter and a beads-on-string morphology (Fig. 4a). The reported diameter was measured for the strands between beads. The formation of beaded fibers is well-known in electrospinning of solutions with low polymer concentration, and arises due to the onset of the Rayleigh-Plateau instability and its subsequent arrest by strain hardening of the viscoelastic fluid as it drains from the filaments into growing droplets [35, 36]. Increasing the CA concentration to 15CA and 17CA (Fig 4b and c) resulted in the expected increases in fiber diameter, disappearance of the beaded structure and broader distributions of fiber diameter. The GF filter (Fig 4d) was similar to 17CA in average fiber diameter, but had a broader diameter distribution. The fibers in the GF material differed also in their arrangement, marked by broken fibers and a random orientation both in and out of the plane of the filter, whereas electrospun fibers in 17CA were oriented predominantly in the x-y plane, i.e. perpendicular to the flow direction. The largest diameter fibers were obtained with the needle-plate apparatus (17CA_NP, Fig 4e). The relatively large fiber diameter of 17CA_NP was obtained using a solution flow rate of 10 mL/h through a needle with ID of 1.1 mm. MFc filters were made up of Y-shaped cellulose acetate fibers, with each leg of the “Y” extending 10-30 μm in length (Fig 4f). For purposes of comparison to the electrospun materials, an equivalent cylindrical fiber diameter of 24 μm, based on the average diameter of the circular cross-sections that circumscribed the trilobal cross-sections, was estimated by Image-J analysis.
13
Fig. 4. SEM images of the filters used for aerosol filtration (a) 11CA, (b) 15CA, (c) 17CA, (d) GF, (e) 17CA_NP and (f) MFc
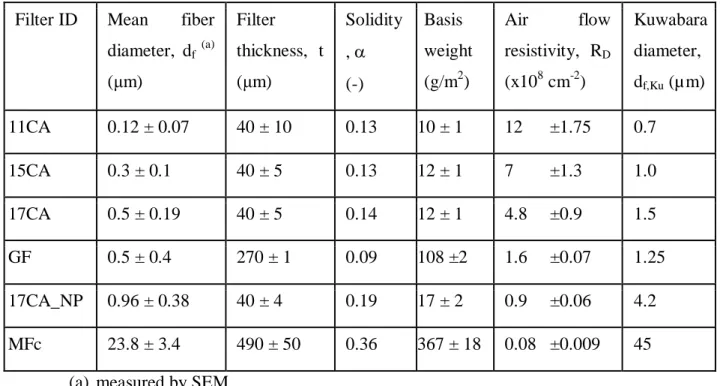
Table 1 summarizes the properties of the several filter discs examined in this work, in order of increasing fiber diameter. The thicknesses of the GF and MFc filters were 6-12 times greater than those of the electrospun fiber filters. Likewise, the solidities of electrospun filters were higher than those of GF and MFc. Although the solidity of a conventional cigarette filter, as
14
measured by us and also reported elsewhere [37], is less than 0.1, the effect of opening and compressing the materials increased their solidity by roughly a factor of four. The basis weights for the electrospun fiber filters, like solidity, showed modest increases with fiber diameter, in agreement with Matulevicius et al [12].
TABLE 1. Properties of filter materials examined in this work.
Filter ID Mean fiber diameter, df (a) (μm) Filter thickness, t (μm) Solidity , (-) Basis weight (g/m2) Air flow resistivity, RD (x108 cm-2) Kuwabara diameter, df,Ku (µm) 11CA 0.12 ± 0.07 40 ± 10 0.13 10 ± 1 12 ±1.75 0.7 15CA 0.3 ± 0.1 40 ± 5 0.13 12 ± 1 7 ±1.3 1.0 17CA 0.5 ± 0.19 40 ± 5 0.14 12 ± 1 4.8 ±0.9 1.5 GF 0.5 ± 0.4 270 ± 1 0.09 108 ±2 1.6 ±0.07 1.25 17CA_NP 0.96 ± 0.38 40 ± 4 0.19 17 ± 2 0.9 ±0.06 4.2 MFc 23.8 ± 3.4 490 ± 50 0.36 367 ± 18 0.08 ±0.009 45
(a) measured by SEM
For purposes of comparison, air flow resistivity (RD, cm-2) was determined using Darcy‟s
law [38]:
𝑅𝐷 =𝐴Δ𝑝
𝜇𝑄𝑡 (2) where A is the area of the test sample, µ is the dynamic viscosity of air (=1.983 x 10⁻⁵ kg/m s),
and Q is the total volumetric flow rate of clean air. Table 1 shows that, despite their lower solidities compared to GF and MFc filters, the electrospun fiber filters have greater RD values,
due to their greater specific surface areas. Higher specific surface area results in greater drag force to air flow and higher Δp.
Although the mean fiber diameters of the 17CA and GF filters were comparable, the air flow resistivity of 17CA was three times higher (Table 1); the higher resistivity can be traced to the higher filter solidity compared to the GF sample. Models can be used that account for the
15
drag force and slip effect of air molecules flowing around fibers of small diameter using a correction factor that depends on the fiber Knudsen number,
𝐾𝑛 = 2𝜆 𝑑𝑓,𝐾𝑢 (3) where df, Ku is the fiber diameter based on the Kuwabara equation [8], and λ is the mean free path
of air molecules (0.06 μm at 20°C [7]). The larger the Knudsen number, the greater the slip effects. The Kuwabara fiber diameter was solved for iteratively using the following equation:
p t v Ku Kn Ku Kn df Ku f ))] 1 ( 5 . 0 ( 996 . 1 [ ) 996 . 1 1 ( 16 2 2 , (4)
Ku is the Kuwabara aerodynamic factor, which accounts for the effect by neighboring fibers on the air flow around a fiber:
𝐾𝑢 = −0.5𝑙𝑛𝛼 − 0.75 − 0.25𝛼2+ 𝛼 (5) These equivalent aerodynamic diameters are tabulated as well in Table 1. As can be seen from the values in Table 1, the Kuwabara diameters df,Ku for the fibers of the 15CA, 17CA and
17CA_NP electrospun mats are about 2-4 times larger than the diameters estimated by SEM. While the SEM diameter is number averaged, the Kuwabara diameter is weighted by the second
moment of fiber diameter, 2
f
d [8]. Theoretical calculation that can demonstrate the effect of gas
slip in a system of fibers with different diameters are complicated [39]. Thus fiber diameters obtained by Kuwabara model can be 1.5-12 times that of mean SEM fiber diameter [13].
Particle Penetration
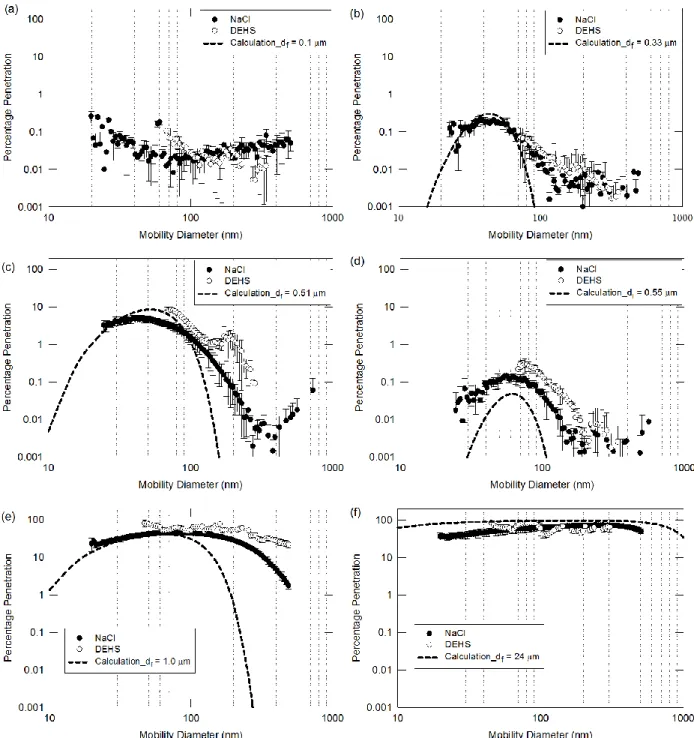
Fig. 5 shows the penetration distribution function P(dp) for each of the filter materials
studied in this work. Data are shown for both the solid (NaCl) and liquid (DEHS) aerosols. Also shown are the theoretical penetration distribution functions predicted by the fiber efficiency model [7, 8].
With the exception of the 11CA filter, for the most part, all filters demonstrated the characteristic penetration profile. Even though a single fiber diameter equal to the experimentally measured mean (SEM) diameter (c.f. Table 1) was assumed for each filter for modeling purposes, the model predicts penetration profiles that are in reasonable qualitative agreement with the measured profiles for a variety of materials with different fiber diameters, filter thicknesses and solidities. In general, the overall penetration varied over two orders of magnitude
16
(0.03-60%) for this set of filters, while the MPPS varied by a factor of six. This contrasts with some earlier studies [13, 14, 19, 40], in which the MPPS was not readily identified; either the value was outside the size range of aerosol particles examined, or the uncertainty in penetration was too large to distinguish among several bins in the aerosol size distribution.
The penetration profile of 11CA was different from the other filters in that no maximum in the P(dp) distribution was observed in the size range of aerosols tested (Fig 5a). For the 11CA
filter, it is possible that the MPPS resides below the detectable sizing range of the instrument (dp
< 20 nm). The P(dp) values predicted by the model for mean fiber diameter for the 11CA filter
were very small (<0.001%), so are not shown in Fig. 5a. Although MPPS around 100 nm was observed by Leung and Huang using 98 nm fiber diameter [41], the face velocity used in that study was only 5 cm/s. At higher face velocity, MPPS is expected be different, due to changes in the relative importance of different deposition mechanisms. For 11CA, both the fibers and the particles have broad diameter distributions and comparable mean diameters (0.1 and 0.09 μm respectively) and thus exhibit an average interception ratio (ratio of fiber diameter to particle diameter) close to one. In this circumstance, the theoretical particle deposition due to the “interception mechanism” becomes independent of particle diameter [7]. Also, the particle-size dependent diffusion mechanism has a relatively smaller contribution at high face velocity. A previous study [42] similarly failed to observe a MPPS for „bead -on-string‟ fiber structure from penetration of particles with size (20 ̶ 300 nm).
17
Fig. 5. Penetration distribution functions P(dp) for solid (solid circle) and oil (open circle)
aerosols using different test filters: (a) 11CA, (b) 15CA, (c) 17CA, (d) GF, (e) 17CA_NP and (f) MFc. The short-dashed curves show the distributions predicted by theory for particles having a density of 1 g/cc, typical of liquid aerosols.
The 11CA, 15CA and GF filters had fiber diameters of approximately 0.1, 0.3 and 0.5 µm, respectively, and exhibited comparable P(dp) values ranging 0.1-0.5%. The comparable
18
penetration values for the 11CA and 15CA filters are probably due to wide distributions of aerosol and fiber diameters resulting in a nominal difference in the interception ratios. Interception is the dominant particle deposition mechanism, in this particle size range [7]. Compared to the 11CA and 15CA filters, the GF filter showed lower penetration, despite its having larger mean fiber diameter; this result is due to its 6-fold greater filter thickness.
With increase in fiber diameter for the 15CA and 17CA filters, the increase in MPPS was negligible. This observation is consistent with the theoretical calculations. As demonstrated in Fig. 3b, manipulation of the MPPS within a particle size range of 0.01-1 μm is best achieved using filters having fiber diameters greater than about one micrometer. The MPPS was 40-50 nm for the 15CA and 17CA filters and showed a slight increase to 70 nm for the 17CA_NP filter, in agreement with the model. The penetration profile for the MFc filter shows that the MPPS shifts to significantly larger particle size (~290 nm) for these larger fibers. Apart from df, the
penetration value of MFc could have resulted from its increased thickness and solidity. Although size selectivity was observed for all of the filters, the breadth of the penetrated particle distribution increased with larger df. In general, this is in agreement with a recent study [15] that
demonstrated a shift in MPPS from 400 nm to 70 nm when df was changed from 17 to 0.068 µm,
measured at a vf of 10 cm/s. In addition to the shift in maxima, the breadths of the penetrated
particle distributions increased with fiber diameter; thus, less selectivity with respect to particle size was observed for filters have the larger fiber diameters.
The physical state of the aerosol (i.e. solid versus liquid) can affect the penetration profile, since mechanisms may exist to remove liquid aerosols from the air stream that are not accounted by a “mechanical” filtration model. Earlier studies have observed that at face velocities less than 50 cm/s, air filters have significantly higher efficiency when tested with a solid aerosol such as 300 nm polystyrene latex particles compared to oil droplets of same size [43].
The penetration profiles for both NaCl and DEHS aerosols can also be compared in Fig. 5. The NaCl aerosol showed good signal-to-noise ratio for particle penetration over a wide range of dp. The DEHS aerosols each had narrow size distributions, and collectively covered a smaller
range of particle sizes than the NaCl aerosol, as shown in Fig. 1. For most of the filters, the penetration value at the MPPS was greater with the DEHS aerosol than with the salt aerosol. One possible explanation for this observation is the higher density of the NaCl particles (2.5 g/cm3)
19
compared to DEHS (0.9 g/cm3), which results in greater probability of particle deposition by impaction. This is also evidenced by the fact that for particle sizes greater than the MPPS, the differences in the two penetration profiles become more significant. Furthermore, the deposition of NaCl quickly builds up NaCl cake on the filter surface with smaller pore diameter, which reduced particle penetration. It is likely that the loss of NaCl particles by bounce and re-entrainment was minimal.
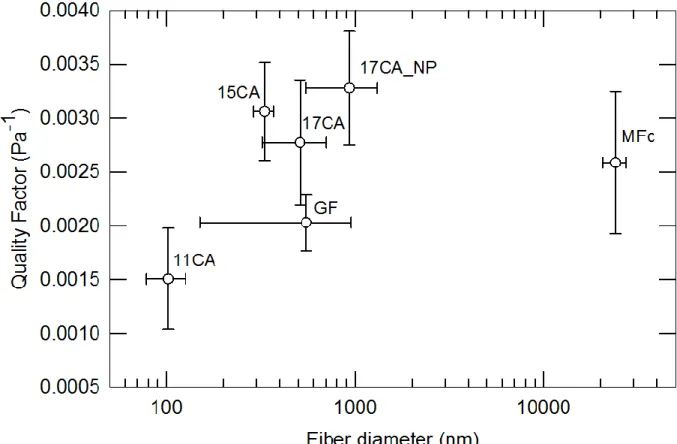
Fig. 6 compares the quality factor, QF, for the several filters tested in this work, using the Ptot value of the NaCl aerosol and a face velocity vf = 45 cm/s; the QF values for DEHS aerosols
were similar. The QF is widely used to compare filter performances for industrial applications. A „good‟ value of QF for commercial and electrospun filters typically falls within the range 0.01-0.1 Pa-1 [12, 14, 23] for vf less than 15 cm/s, but is expected to decrease with increasing vf [23].
The values observed here fell within the range 0.0015-0.0035 Pa-1. Because all of the electrospun filters had comparable thicknesses, the observed differences in their QF may be attributed to differences in fiber diameter or porosity. With the exception of the electrospun material with beaded fibers, the electrospun filters generally have slightly higher quality factors than the commercial (GF, MFc) ones. Beading apparently affects the QF adversely. The QF value for the MFc had high measurement uncertainties that obscure differences from the other types of filters. Although the two filters (MFc and GF) showed significant differences in Ptot and Δp, their
20
Fig. 6. The quality factor for the various test filters are plotted against their fiber diameter at face velocity of 45 cm/s for NaCl aerosol
Effect of filter thickness
One of the major limitations of filters comprising only nanofibers is that they exhibit a drop in quality factor above a filter thickness of ~20 µm and/or a face velocity of 10 cm/s, due to a rapid increase in pressure drop [12, 17]. Here, we used a representative electrospun filter (15CA) to study the effect of filter thickness on properties like Δp, P(dp) and QF. Filters of 15CA
with thicknesses from 7 to 51 µm were prepared by varying the spinning time from 5 to 20 min. At the upper end of this range, the filter thickness was limited by poor dissipation of charge accumulated on the collector, as observed elsewhere [44]. At the lower end of this range, the filter thickness was limited by difficulty of handling and uniformity.
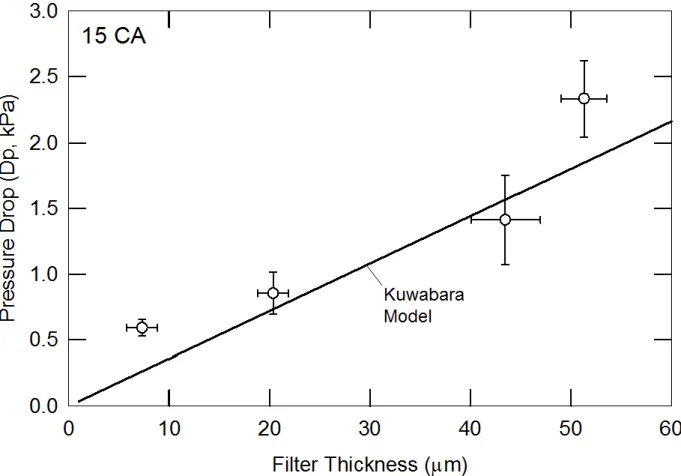
Fig. 7 shows that there is reasonable agreement between the measured Δp and that predicted by the Kuwabara model using df,Ku = 1 m for flow of particle-free air through filters
21
of 15CA having different thicknesses. In the model calculations, the solidity was held constant (α = 0.13); variations in actual solidity could account for the observed discrepancies between the model and experiment values. In an earlier study [17], both the solidity and thickness of the nanofiber filter were observed to increase with increase in electrospinning time.
Fig. 7. Pressure drop versus filter thickness for particle free air flow through electrospun filters of 15CA. Experimental measurements (open circles) correspond to filters whose thickness was varied by electrospinning times of 5, 10, 15 and 20 minutes; calculated trend based on the Kuwabara model with df,Ku = 1 m, = 0.13.
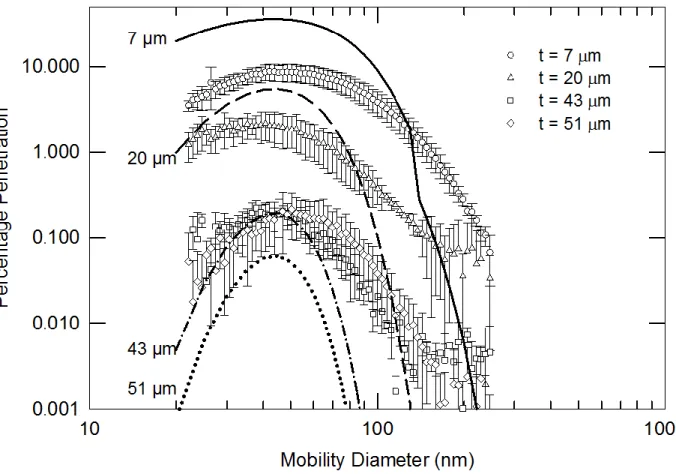
Fig. 8 shows the penetration distribution function P(dp) for a NaCl aerosol comprising
particles with diameters from 0.02 to 0.5 μm, for electrospun filters of 15CA having different thicknesses. Also shown are the penetration distributions predicted by the model [7], which agree qualitatively with the measurements. The Ptot and the MPPS obtained from these curves are
22
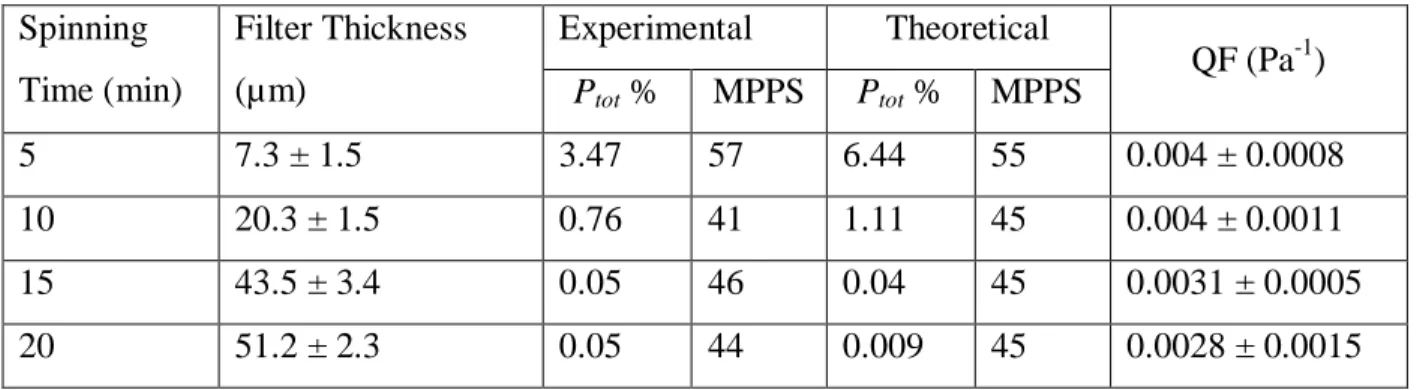
The MPPS was approximately constant around 0.04-0.05 µm, regardless of filter thickness, which is in agreement with the model. These results show that the mean penetration dropped more than 60-fold as the filter thickness increased from 7 to 43 µm. However, further increase in thickness (43 to 51 µm) changed the mean penetration only negligibly; this result contradicts the model, which showed a decrease in Ptot from 0.04 to 0.009%. The contradiction is
due to the model assumption that the properties of the aerosol upstream are consistent for all fiber layers throughout the thickness of filter. However, the particle size distribution changes as the aerosol passes through the filter [7]. Leung and Hung [41] observed that aerosol deposition distribution is largely non-uniform through the thickness of the filter, with more aerosol deposited near the face region compared to the back side. This behavior is called the “skin effect” and can be significant, particularly in nanofiber filtration [41].
Fig. 8. Effect of thickness of 15CA filters on particle penetration. The corresponding theoretical curves are shown for filter thickness 7 μm (solid), 20 μm (dash), 43 μm (dot-dash) and 51 μm (dot), respectively. The experimental data are presented for filters of thickness 7 μm (circles), 20 μm (triangles), 43 μm (squares) and 51 μm (diamonds). The discontinuity in the slope of the
23
theoretical curve for 7 µm filter thickness is due to a change in model assumptions for the impaction mechanism that occurs for dp 0.13-0.14 µm in this case; see Supporting Information
for more details.
TABLE 2. The total penetration Ptot and maximum penetrating particle size (MPPS) for
electrospun filters of 15CA having different thicknesses. Spinning Time (min) Filter Thickness (µm) Experimental Theoretical QF (Pa-1) Ptot % MPPS Ptot % MPPS 5 7.3 ± 1.5 3.47 57 6.44 55 0.004 ± 0.0008 10 20.3 ± 1.5 0.76 41 1.11 45 0.004 ± 0.0011 15 43.5 ± 3.4 0.05 46 0.04 45 0.0031 ± 0.0005 20 51.2 ± 2.3 0.05 44 0.009 45 0.0028 ± 0.0015
The quality factor QF, which ranged from 0.001-0.005 Pa-1 for the 15CA filters of different thicknesses, was essentially unaffected by filter thickness, within the uncertainties of measurement, for filter thicknesses of 7 − 43 µm. A slight drop in QF was observed for t = 51 µm, which is due to larger pressure drop with negligible increase in Ptot (Fig. 7 and 8). To ensure
good mechanical properties of the filter without compromising the quality factor, all electrospun filters used in this study were made with 40 µm filter thickness.
Particle accumulation and filter clogging
Particle accumulation can foul the filter media and increase Δp multifold over time. The rate of accumulation depends on the filter properties, such as the pore diameter and filter thickness, the aerosol properties such as the number concentration of particles and whether the aerosol is liquid or solid, and operating conditions such as face velocity. Such increases in pressure drop were observed for the most of the filters studied in this work when challenged with NaCl aerosol or DEHS aerosol with dp = 300 nm or larger; for smaller DEHS aerosol diameters,
Δp was not affected, even for the smallest df. Here, we analyze this behavior using the blocking
filtration laws [45, 46]; a review of these laws is provided by Iritani [47]. For constant flux filtration, these blocking laws take the general form:
24 𝑑 Δ𝑝
𝑑𝑣 =
𝑑Δ𝑝 𝑑𝑡
𝐽 = 𝑘 Δ𝑝 𝑛 (6) where Δp is the pressure drop, v is the cumulative filtrate volume collected per unit membrane area, and J is the flux. The blocking index n is a dimensionless constant that has been associated with different mechanisms of filtration: n = 2 for “complete blocking”, n = 3/2 for “standard blocking”, n = 1 for “intermediate blocking” and n = 0 for cake filtration. The first three mechanisms are collectively categorized as pore blocking. The “complete blocking” law is consistent with a parallel resistance model in which the fouled fraction of the filter increases with time, whereas cake filtration is consistent with a series resistance model in which a foulant layer accumulates uniformly across the surface of the filter [48]. k is the resistance coefficient, which depends on the system, the filter medium, and the mechanism of filtration. For air filters, the change of regime from pore blocking (depth filtration) to cake filtration defines filter clogging [9].
For each filter, the pressure drop was measured as a function of time up to 10 min under constant flux conditions (Fig. S1, Supporting Information). The normalized pressure drop Δp/Δp0, where Δp0 is the pressure drop for particle free air flow (values provided in legend of
Fig. 9), and its derivative d(Δp/Δp0)/dt were evaluated, and the blocking index n was then
determined from the log-log plot of d(Δp/Δp0)/dtversus (Δp/Δp0), shown in Fig. 9. For reference
purposes, lines of slope 0, 1 and 2 are also shown in Fig. 9.
Examination of Fig. 9a suggests that, when challenged with NaCl aerosol, the filters having smallest fiber diameter (11CA, 15CA and 17CA) exhibit cake formation (n ~ 0) from the start of the experiment. The effective pore diameter of electrospun filters has been shown both theoretically [49] and experimentally [50-52] to be proportional to fiber diameter for filters of comparable solidity, as is the case in this work. Conventional methods like mercury porosimetry and capillary flow porometry yield average pore sizes estimates that range from 3.5 to 5 times the average fiber diameter, depending on the measurement technique used. Air flow resistance offered by these filters is characteristic of the cake layer. In contrast to this, the GF and 17CA_NP filters show slopes 1 < n < 2 for the first few data points. After approximately t = 6 minutes, the data for these filters also transitions to a curve of slope n ~ 0, indicating the onset of cake filtration. Apparently, these two filters initially work as depth filters, followed by the formation of cake. Although the GF and 17CA filters have comparable mean fiber diameters, the lower solidity of the GF filter implies larger pore diameters than for the 17CA filter, consistent
25
with the 17CA_NP. The MFc filter exhibited only depth filtration, due to the small interception ratio.
Fig. 9b shows blocking analysis for the electrospun 11CA, 15CA and 17CA filters when challenged with DEHS aerosol. In contrast to NaCl aerosol, the DEHS aerosol does not result immediately in cake formation, but rather something approaching depth filtration throughout the course of the experiment. For the filters having smaller fiber diameter, it is possible that the oil deposition takes the form of a film or liquid bridges between several fibers, whereas for larger fiber diameter the oil droplets may coat the fibers upon deposition and penetrate through the depth of the filter [53]. The deposited mass required to clog the filter media was two orders of magnitude greater for the DEHS aerosol compared to the NaCl aerosol [54]. The filters with larger pore diameters (GF, 17CA_NP and MFc) did not yield readily interpretable values of blocking index, n.
26
Fig 9. The loading curve of tested filters (a) NaCl aerosol and (b) DEHS aerosol. p0 (kPa)
values for the several filters were: 11CA, 2.8; 15CA, 1.7; 17CA, 1.7; GF, 3.4; 17CA_NP, 0.2; MFc, 0.15.
27
SEMs of the fibrous filters after two minutes of filtration are shown in Fig. 10 for both aerosol types; the fibrous structure was found to be significantly obscured by a thick layer of aerosol deposit after 10 minutes of operation. All of the filters used in this work, except the MFc filter, had similar morphologies; thus, the 15CA and MFc filters were examined, as representative of nanofiber and microfiber filters, respectively.
Fig. 10. SEMs of filters after 2 min of deposition time. (a) 15CA filter exposed to NaCl aerosol, (b) MFc filter exposed to NaCl aerosol, (c) 15CA filter exposed to DEHS aerosol, and (d) MFc filter exposed to DEHS aerosol. The scale bar is 10 m in all cases. In parts (a)-(c), a 10,000x magnified image is shown in the inset.
Fig. 10a confirms the formation of a cake-like layer on the 15CA filter when exposed to NaCl aerosol. The NaCl particles form dendritic structures on the nanofiber surface, as observed elsewhere [55]. By contrast, no such cake was observed on the microfibers within the first 2 min. NaCl deposited mostly on the edges of the microfibers, suggestive of the interception
28
mechanism, and also formed dendritic structures (Fig. 10b). The SEM image suggests that formation of the NaCl cake was difficult due to the large inter-fiber distances. Fig. 10c shows that DEHS droplets deposited on the nanofibers, occupying the space between the fibers as well as the points of fiber intersection, and tended to occlude pores due to the small inter-fiber distance. Though MFc had 2 to 3 times the packing density of nanofibers, the interstices between the MFc fibers were too large to be bridged by oil droplets in this manner. Additional images obtained on the MFc filter even after 20 minutes of filtration showed little difference. Poor filtration of DEHS aerosol by the MFc filter, along with the large inter-fiber distance, resulted in the formation of a thin coating of oil on the surface of microfibers. This is evident from the SEM image (Fig.10d), where a small uncoated portion on the surface of the fiber is marked with an arrow.
Conclusion
Electrospinning was used to prepare a set of cellulose acetate filters with variations in fiber diameter (0.1 − 1 µm), solidity (0.1 − 0.2) and filter thickness (7 − 51 µm). The particle filtration performance of these filters was studied using two aerosols, one solid and one liquid, under conditions of high face velocity (45 cm/s). The experimental observations were related to single fiber filtration in order to understand how fiber diameter and filter thickness can be altered to manipulate pressure drop, particle penetration and maximum penetrating particle size. The effects of solid and liquid aerosols were used to compare both filter performance and clogging. An optimal filter thickness was chosen based on a tradeoff between mechanical integrity of the mat and the quality factor for aerosol filtration. Our results indicate that the solid aerosol particles tend to penetrate the first few layers of the filter medium, depending on fiber diameter. Increasing filter thickness above ~40 µm resulted in negligible change in particle penetration but an increase in pressure drop, thus lowering the quality factor. The overall penetration of NaCl was lower than that of oil due to particle properties such as density and shape. The single fiber filtration model explained how the fiber diameter can be manipulated to control on MPPS in the range of 40 − 270 nm and mean penetration from 0.03 − 70. Electrospun filters demonstrated a slightly better quality factor compared to commercial high efficient glass fiber at a much lower thickness. The filter clogging study showed predominantly cake formation during filtration of NaCl particle using nanofiber filter media. The time of cake formation can be delayed using filter
29
having micrometer fibers. Deposited oil droplets tend to form films on the nanofibers, although at much later stage compared to solid particles. In general, this study illuminates some of the factors that control the properties of cellulose acetate filters for air filtration application.
Acknowledgement
The funding for this project was provided by Philip Morris International (Neuchâtel, Switzerland). We also like to acknowledge the Institute for Soldier Nanotechnology at MIT for use of facilities and Dr. Matthew M. Mannarino for helpful discussion.
Conflict of Interest
The authors declare that they have no conflict of interest.
References:
[1] J. Wang and P. Tronville (2014) Toward standardized test methods to determine the effectiveness of filtration media against airborne nanoparticles Journal of Nanoparticle Research 16 2417.
[2] K. Kim, C. Lee, I. W. Kim and J. Kim (2009) Performance modification of a melt-blown filter medium via an additional nano-web layer prepared by electrospinning Fibers and Polymers 10 60.
[3] L. Li, Z. L. Zuo, D. A. Japuntich and D. Y. H. Pui (2012) Evaluation of Filter Media for Particle Number, Surface Area and Mass Penetrations Annals of Occupational Hygiene 56 581. [4] J. Swanson, W. Watts, D. Kittelson, R. Newman and R. Ziebarth (2013) Filtration Efficiency and Pressure Drop of Miniature Diesel Particulate Filters Aerosol Science and Technology 47 452.
[5] D. Hammond, G. T. Fong, K. M. Cummings, R. J. O'Connor, G. A. Giovino and A. McNeill (2006) Cigarette yields and human exposure: A comparison of alternative testing regimens Cancer Epidemiology Biomarkers & Prevention 15 1495.
[6] J. A. Hubbard, K. C. Salazar, K. K. Crown and B. L. Servantes (2014) High-Volume Aerosol Filtration and Mitigation of Inertial Particle Rebound Aerosol Science and Technology 48 530.
[7] W. C. Hinds, Aerosol Technology: Properties, Behavior, and Measurement of Airborne Particles. (John Wiley & Sons, Hoboken, NJ., 1999).
[8] R. C. Brown, Air filtration: An integrated approach to the theory and applications of fibrous filters. (Oxford: Pergamon Press, 1993).
[9] D. A. Japuntich, J. I. T. Stenhouse and B. Y. H. Liu (1994) Experimental Results of Solid Monodisperse Particle Clogging of Fibrous Filters Journal of Aerosol Science 25 385.
[10] S. H. Huang, C. W. Chen, Y. M. Kuo, C. Y. Lai, R. McKay and C. C. Chen (2013) Factors Affecting Filter Penetration and Quality Factor of Particulate Respirators Aerosol and Air Quality Research 13 162.
30
[11] W. W. F. Leung and C. H. Hung (2008) Investigation on pressure drop evolution of fibrous filter operating in aerodynamic slip regime under continuous loading of sub-micron aerosols Separation and Purification Technology 63 691.
[12] J. Matulevicius, L. Kliucininkas, D. Martuzevicius, E. Krugly, M. Tichonovas and J. Baltrusaitis (2014) Design and Characterization of Electrospun Polyamide Nanofiber Media for Air Filtration Applications Journal of Nanomaterials Article ID 859656 1.
[13] A. Podgorski, A. Balazy and L. Gradon (2006) Application of nanofibers to improve the filtration efficiency of the most penetrating aerosol particles in fibrous filters Chemical Engineering Science 61 6804.
[14] J. Wang, S. C. Kim and D. Y. Pui (2008) Investigation of the figure of merit for filters with a single nanofiber layer on a substrate Journal of Aerosol Science 39 323.
[15] Y. Y. Kuo, F. C. Bruno and W. Wang (2014) Filtration Performance Against Nanoparticles by Electrospun Nylon-6 Media Containing Ultrathin Nanofibers Aerosol Science and Technology 48 13.
[16] G. T. Kim, Y. C. Ahn and J. K. Lee (2008) Characteristics of Nylon 6 nanofilter for removing ultra fine particles Korean Journal of Chemical Engineering 25 368.
[17] W. W. F. Leung, C. H. Hung and P. T. Yuen (2010) Effect of face velocity, nanofiber packing density and thickness on filtration performance of filters with nanofibers coated on a substrate Separation and Purification Technology 71 30.
[18] G. C. Rutledge and S. V. Fridrikh (2007) Formation of fibers by electrospinning Advanced Drug Delivery Reviews 59 1384.
[19] K. M. Yun, C. J. Hogan, Y. Mastubayashi, M. Kawabe, F. Iskandar and K. Okuyama (2007) Nanoparticle filtration by electrospun polymer fibers Chemical Engineering Science 62 4751.
[20] S. Ramakrishna, R. Jose, P. S. Archana, A. S. Nair, R. Balamurugan, J. Venugopal and W. E. Teo (2010) Science and engineering of electrospun nanofibers for advances in clean energy, water filtration, and regenerative medicine Journal of Materials Science 45 6283.
[21] B. Y. Yeom and B. Pourdeyhimi (2011) Aerosol filtration properties of PA6/PE islands-in-the-sea bicomponent spunbond web fibrillated by high-pressure water jets Journal of Materials Science 46 5761.
[22] C. L. Pai, M. C. Boyce and G. C. Rutledge (2011) On the importance of fiber curvature to the elastic moduli of electrospun nonwoven fiber meshes Polymer 52 6126.
[23] Z. Wang, C. Zhao and Z. Pan (2015) Porous bead-on-string poly(lactic acid) fibrous membranes for air filtration Journal of Colloid and Interface Science 441 121.
[24] J. Li, F. Gao, L. Q. Liu and Z. Zhang (2013) Needleless electro-spun nanofibers used for filtration of small particles Express Polymer Letters 7 683.
[25] L. T. Choong, Z. Khan and G. C. Rutledge (2014) Permeability of electrospun fiber mats under hydraulic flow Journal of Membrane Science 451 111.
[26] L. T. Choong, M. M. Mannarino, S. Basu and G. C. Rutledge (2013) Compressibility of electrospun fiber mats Journal of Materials Science 48 7827.
[27] Y. C. Ahn, S. K. Park, G. T. Kim, Y. J. Hwang, C. G. Lee, H. S. Shin and J. K. Lee (2006) Development of high efficiency nanofilters made of nanofibers Current Applied Physics 6 1030.
[28] A. G. Dumanli and A. H. Windle (2012) Carbon fibres from cellulosic precursors: a review Journal of Materials Science 47 4236.
31
[29] M. A. Alamein, S. Stephens, Q. Liu, S. Skabo and P. H. Warnke (2013) Mass Production of Nanofibrous Extracellular Matrix with Controlled 3D Morphology for Large-Scale Soft Tissue Regeneration Tissue Engineering Part C-Methods 19 458.
[30] K. M. Forward and G. C. Rutledge (2012) Free surface electrospinning from a wire electrode Chemical Engineering Journal 183 492.
[31] Y. M. Shin, M. M. Hohman, M. P. Brenner and G. C. Rutledge (2001) Experimental characterization of electrospinning: the electrically forced jet and instabilities Polymer 42 9955 [32] C. A. Schneider, W. S. Rasband and K. W. Eliceiri (2012) NIH Image to ImageJ: 25 years of image analysis Nature Methods 9 671.
[33] H. L. LaNieve (2007) Cellulose Acetate and Triacetate Fibers Handbook of Fiber Chemistry, Third Edition 16 773.
[34] D. Sinclair and V. K. Lamer (1949) Light Scattering as a Measure of Particle Size in Aerosols - the Production of Monodisperse Aerosols Chemical Reviews 44 245.
[35] D. H. Reneker, A. L. Yarin, H. Fong and S. Koombhongse (2000) Bending instability of electrically charged liquid jets of polymer solutions in electrospinning Journal of Applied Physics 87 4531.
[36] J. H. Yu, S. V. Fridrikh and G. C. Rutledge (2006) The role of elasticity in the formation of electrospun fibers Polymer 47 4789.
[37] S. H. Huang, Y. M. Kuo, K. N. Chang, Y. K. Chen, W. Y. Lin, W. Y. Lin and C. C. Chen (2010) Experimental Study on the Effect of Fiber Orientation on Filter Quality Aerosol Science and Technology 44 964.
[38] P. Gibson, H. Schreuder-Gibson and D. Rivin (2001) Transport properties of porous membranes based on electrospun nanofibers Colloids and Surfaces a-Physicochemical and Engineering Aspects 187 469.
[39] A. A. Kirsch, I. B. Stechkina and N. A. Fuchs (1974) Gas flow in aerosol filters made of polydisperse ultrafine fibres Journal of Aerosol Science 5 39.
[40] A. Charvet, Y. Gonthier, E. Gonze and A. Bernis (2010) Experimental and modelled efficiencies during the filtration of a liquid aerosol with a fibrous medium Chemical Engineering Science 65 1875.
[41] W. W. F. Leung and C. H. Hung (2012) Skin effect in nanofiber filtration of submicron aerosols Separation and Purification Technology 92 174.
[42] K. M. Yun, A. B. Suryamas, F. Iskandar, L. Bao, H. Niinuma and K. Okuyama (2010) Morphology optimization of polymer nanofiber for applications in aerosol particle filtration Separation and Purification Technology 75 340.
[43] R. G. Stafford and H. J. Ettinger (1971) Comparison of Filter Media against Liquid and Solid Aerosols American Industrial Hygiene Association Journal 32 319.
[44] J. C. Uecker, G. C. Tepper and J. Rosell-Llompart (2010) Ion-assisted collection of Nylon-4,6 electrospun nanofibers Polymer 51 5221.
[45] R. W. Field, D. Wu, J. A. Howell and B. B. Gupta (1995) Critical Flux Concept for Microfiltration Fouling Journal of Membrane Science 100 259.
[46] J. Hermia (1982) Constant Pressure Blocking Filtration Laws - Application to Power-Law Non-Newtonian Fluids Transactions of the Institution of Chemical Engineers 60 183. [47] E. Iritani (2013) A Review on Modeling of Pore-Blocking Behaviors of Membranes During Pressurized Membrane Filtration Drying Technology 31 146.
32
[48] L. T. Choong, Y. M. Lin and G. C. Rutledge (2015) Separation of oil-in-water emulsions using electrospun fiber membranes and modeling of the fouling mechanism Journal of Membrane Science 486 229.
[49] S. J. Eichhorn and W. W. Sampson (2005) Statistical geometry of pores and statistics of porous nanofibrous assemblies Journal of the Royal Society Interface 2 309.
[50] R. Wang, Y. Liu, B. Li, B. S. Hsiao and B. Chu (2012) Electrospun nanofibrous membranes for high flux microfiltration Journal of Membrane Science 392 167.
[51] J. L. Lowery, N. Datta and G. C. Rutledge (2010) Effect of fiber diameter, pore size and seeding method on growth of human dermal fibroblasts in electrospun poly(epsilon-caprolactone) fibrous mats Biomaterials 31 491.
[52] Q. P. Pham, U. Sharma and A. G. Mikos (2006) Electrospun poly(epsilon-caprolactone) microfiber and multilayer nanofiber/microfiber scaffolds: Characterization of scaffolds and measurement of cellular infiltration Biomacromolecules 7 2796.
[53] P. Contal, J. Simao, D. Thomas, T. Frising, S. Calle, J. C. Appert-Collin and D. Bemer (2004) Clogging of fibre filters by submicron droplets. Phenomena and influence of operating conditions Journal of Aerosol Science 35 263.
[54] P. Penicot, D. Thomas, P. Contal, D. Leclerc and J. Vendel (1999) Clogging of HEPA fibrous filters by solid and liquid aerosol particles: An experimental study Filtration & Separation 36 59.
[55] C. C. Chen, W. Y. Chen, S. H. Huang, W. Y. Lin, Y. M. Kuo and F. T. Jeng (2001) Experimental study on the loading characteristics of needlefelt filters with micrometer-sized monodisperse aerosols Aerosol Science and Technology 34 262.