HAL Id: insu-02007173
https://hal-insu.archives-ouvertes.fr/insu-02007173
Submitted on 5 Feb 2019
HAL is a multi-disciplinary open access archive for the deposit and dissemination of sci-entific research documents, whether they are pub-lished or not. The documents may come from teaching and research institutions in France or abroad, or from public or private research centers.
L’archive ouverte pluridisciplinaire HAL, est destinée au dépôt et à la diffusion de documents scientifiques de niveau recherche, publiés ou non, émanant des établissements d’enseignement et de recherche français ou étrangers, des laboratoires publics ou privés.
Kinetics of the Reactions of NO3 Radical with alkanes
Li Zhou, A Ravishankara, Steven Brown, Kyle Zarzana, Mahmoud Idir,
Véronique Daële, Abdelwahid Mellouki
To cite this version:
Li Zhou, A Ravishankara, Steven Brown, Kyle Zarzana, Mahmoud Idir, et al.. Kinetics of the Reac-tions of NO3 Radical with alkanes. Physical Chemistry Chemical Physics, Royal Society of Chemistry, 2019, 8, 12 p. �10.1039/C8CP07675H�. �insu-02007173�
1
Kinetics of the Reactions of NO
3Radical with alkanes
Li Zhou,a,g A.R. Ravishankara,a,b,c,* Steven S. Brown,d,e Kyle J. Zarzana,d,f,h
Mahmoud Idir,a Véronique Daële,a Abdelwahid Melloukia,*
a. Institut de Combustion, Aérothermique, Réactivité et Environnement/OSUC, CNRS, 45071 Orléans Cedex 02, France
b. Departments of Chemistry and Atmospheric Science, Colorado State University, Fort Collins, CO 80253, USA
c. Le Studium Loire Valley Institute for Advanced Studies, Orléans, France.
d. NOAA Earth System Research Laboratory (ESRL) Chemical Sciences Division, 325 Broadway, Boulder, CO 80305, USA
e. Department of Chemistry, University of Colorado Boulder, Boulder, CO 80309, USA f. Cooperative Institute for Research in Environmental Sciences, University of Colorado
Boulder, Boulder, CO 80309, USA
g. Now at: National Engineering Research Center for Flue Gas Desulfurization, Department of Environmental Science and Engineering, Sichuan University, Chengdu, 610065, China h. Now at: Department of Chemistry, University of Colorado Boulder, Boulder, CO 80309
USA.
*Address correspondence to:
2
Abstract
The rate coefficients for the reactions of NO3 radicals with methane (CH4), ethane
(C2H6), propane (C3H8), n-butane (n-C4H10), iso-butane (iso-C4H10),
2,3-dimethybutane (C6H14), cyclopentane (C5H10) and cyclohexane (C6H12) at atmosphere
pressure (1000±5 hPa) and room temperature (298±1.5 K) were measured using an absolute method. Careful attention was paid to the role of secondary reactions and impurities. The upper limits of rate coefficients for methane and ethane at 298 K are <4 ×10-20 and <5 ×10-19 cm3 molecule-1 s-1, respectively. The rate coefficients at 298 K for
propane, n-butane, iso-butane, 2,3-dimethybutane, cyclopentane and cyclohexane are, (9.2±2.9) ×10-18, (1.5±0.4) ×10-17, (8.2±2.2) ×10-17, (5.8±2.4) ×10-16, (1.5±0.6) ×10-16
and (1.3±0.4) ×10-16 cm3 molecule-1 s-1, respectively. Rate coefficients for the reactions
of NO3 radical with two deuterated n-butanes (butane-D10 and butane-1,1,1,4,4,4-D6)
are also reported. We show that the rate coefficients for NO3 reactions correlate with
the enthalpy change for the reaction, thereby suggesting that the mechanism for NO3
reactions with alkanes is through H atom abstraction. The measured rate coefficients are compared with available literature values. This study increases the number of available rate coefficients for the reactions of NO3 with alkanes and sets significantly
lower upper limits for reaction of NO3 with ethane and methane. The atmospheric
significance of our reported rate coefficients is briefly discussed.
3
1 Introduction
Alkanes are ubiquitous in the Earth’s atmosphere and come from both natural and anthropogenic sources. They play many important roles in the atmosphere: (a) they are precursors for tropospheric ozone; (b) they contribute to secondary organic aerosol formation; (c) they are important reactants for removal of free radicals such as OH, Cl, and possibly NO3 radicals; and (d) the longer-lived alkanes are also a source of
stratospheric water vapor. Methane is the second most important anthropogenic greenhouse gas and estimates of its radiative forcing depend on accurate assessment of its atmospheric lifetime. Therefore, an accurate characterization of the loss rates of alkanes to reaction with major atmospheric oxidants, including NO3, is important. Also,
their role in the removal of NO3 needs quantification.
Most alkanes are removed from the atmosphere via their reactions with the ubiquitous OH radical, with minor contributions from reactions with Cl atoms. Reactions of alkanes with ozone are too slow to be significant. However, NO3 radical
may also contribute to their removal under special conditions and, more importantly, the alkanes may substantially contribute to the removal of the NO3 radicals. This is
especially the case with more reactive large alkanes. For example, Wild et al.1 showed
that alkanes contributed roughly 45%-50% of the gas phase NO3 loss rates in an oil and
gas basin where alkanes were the dominant class of VOC. This analysis was based on available literature at that time, including upper limits for some reactions.
The rate coefficients for the reactions of alkanes with NO3 radicals are relatively
small and they have not been subject to extensive examinations unlike the case of OH radical and Cl atom reactions. Mostly, large upper limits at room temperature have been reported for the reactions of NO3 with methane, ethane, and propane. Furthermore, most
of these measurements have been derived from relative rate measurements methods. Suitable reference compounds with well-established small reaction rate coefficients are difficult to find and hence the reported rate coefficients are likely to have significant uncertainties. The rate coefficients for the reactions of NO3 with larger alkanes, which
4
react more rapidly, have been reported; however, there are large variations amongst even the few reports.2-5 Therefore, further investigations of the rate coefficients for the
reactions of NO3 with simple alkanes are needed.
In this study, we have utilized a direct method developed recently in our laboratory to measure NO3 reaction rate coefficients that is well-suited for slow reactions. We have
employed this method to measure the rate coefficients for the following reactions at (298±1.5) K with the rHo(298 K) noted next to the reaction:
NO3 + CH4 (methane) CH3 + HNO3 ; +15.12 kJ mol-1 (1)
NO3 + C2H6 (ethane) C2H5 + HNO3; -2.44 kJ mol-1 (2)
NO3 + C3H8 (propane) n-C3H7 + HNO3; -0.74 kJ mol-1 (3a)
NO3 + C3H8 (propane) iso-C3H7 + HNO3; -10.74 kJ mol-1 (3b)
NO3 + n-C4H10 (n-butane) 1-C4H9 (1-Butyl) + HNO3; +0.65 kJ mol-1 (4a)
NO3 + n-C4H10 (n-butane) 2-C4H9 (2-Butyl) + HNO3; -10.84 kJ mol-1 (4b)
NO3 + iso-C4H10 (iso-butane) C4H9 (Isobutyl) + HNO3; -1.24 kJ mol-1 (5a)
NO3 + iso-C4H10 (iso-butane) C4H9 (t-butyl) + HNO3; -23.24 kJ mol-1 (5b)
NO3 + C6H14 (2,3-dimethybutane) C6H13 (2,3-dimethyl -1-Butyl) + HNO3;
≈ 12 kJ mol-1 (6a)
NO3 + C6H14 (2,3-dimethybutane) C6H13 (2,3-dimethyl -2-Butyl) + HNO3;
-34.64 kJ mol-1 (6b)
NO3 + C5H10 (cyclopentane) C5H9 (cyclopentyl) + HNO3;
-23.98 kJ mol-1 (7)
NO3 + C6H12 (cyclohexane) C12H11 (cyclohexanyl)+ HNO3;
-26.84 kJ mol-1 (8)
The enthalpy of each reaction was calculated by using the respective fHo(298 K)
values from NIST Standard Reference Database.6 The enthalpy change for reaction
(6a) was estimated assuming the C-H bond strength to be similar to that in reaction (5a). Enthalpy change for reaction (6b) was obtained using data from Baldwin et al.7
5
NO3) using a cavity ring down spectrometer over a time scale of 10-20 minutes in an
excess of alkanes at a total pressure of (1000±5) hpa in a large chamber to directly determine the rate coefficients.
2 Experimental section
The experimental set up and the procedure used has been described in detail in a previous publication.8 The rate coefficients for reactions (1-8) were measured by
following the temporal profiles of NO3 and N2O5 in an excess of each alkane. The
concentrations of NO3 and N2O5 were both measured via cavity ring down spectroscopy.
The reactions were carried out in a large chamber that allowed measurement of the slow loss of the NO3 and N2O5 over long periods of time (up to 30 mins). Here, we will
briefly describe the experimental set up, the analytical instruments used to quantify alkanes, NO3, N2O5, and NO2, and the data acquisition procedures.
2.1 Experimental system
The rate coefficients were measured at room temperature (298.0±1.5K) in the ICARE-7300L dark Teflon chamber at slightly above the ambient pressures (1000±5hpa).9, 10 Before each set of experiments, the chamber was flushed overnight with dry zero air (relative humidity <3%) to remove alkanes and nitrogen oxides to below their detection limits (see below). The gaseous reactants were flowed into the chamber from a gas handling system where mixtures were made using calibrated capacitance manometers (0-10, 0-100 and 0-1000 Torr, MKS Baratron). The larger alkanes, which are liquids, were evaporated into glass bulbs where their pressures were measured and then filled with dry air to known pressures. A measured pressure of this mixture was introduced into a calibrated volume and then this gas mixture was flushed into the chamber using zero air.
6
temperature in the chamber was measured using two thermocouples located in different parts of the chamber; they were the same to within 0.5 K and remained constant during the rate coefficient measurements. The pressure in the chamber was measured using a capacitance manometer.
A small flow (about 10 L/min) of purified air was added to make up for the continuous withdrawal of gases for analysis from the chamber and keep the pressure constant. This procedure slowly diluted the chamber contents. The contents of the chamber were mixed by two internal fans. We measured the time constants for these two processes, dilution and mixing, by adding a sample of SF6 (>99.99%, Alpha Gaz)
into the chamber and following its temporal profile using an FTIR spectrometer (see below). The dilution rate could be expressed as a first order loss with a rate coefficient of (2.5±0.1)×10-5 s-1 (as shown in Figure S1, in the supporting information section)
and the mixing time (for >99% mixing) was (30±3) seconds.
The contents of the chamber were sampled using: (a) an FT-IR spectrometer to measure hydrocarbon concentrations; (b) a cavity ring down spectrometer to simultaneously measure NO3 and N2O5; and (c) a Cavity Attenuated Phase Shift (CAPS)
spectroscopy instrument to measure NO2. They are described below. The IR absorption
bands of methane were partially saturated because of the large the concentrations used in our study. Therefore, methane concentrations in the chamber were determined manometrically. This approach was very accurate since we could directly measure the substantial pressure of methane that was introduced into the chamber.
(a) FT-IR spectrometer: A commercial Nicolet 5700 Magna FT-IR spectrometer with a liquid nitrogen cooled mercury–cadmium–telluride (MCT) detector was coupled to a white-type multiple-reflection mirror system located near the center of the chamber. The multipass system had a base path length of 2 m and, with 70 traverses, a total optical path length of 140 m. The spectra, measured between 4000–700 cm-1, were analyzed
using the software provided by the vendor (OMNIC 9). The IR spectra were recorded in 63s by co-adding 16 scans at a spectral resolution of 1 cm-1. The alkanes and SF
6
(1576-7
1298 cm-1), n-butane (3083-2798 cm-1), iso-butane (3053-2808 cm-1), cyclopentane
(3100-2800 cm-1), cyclohexane (2970-2830 cm-1), 2,3-dimethy butane (3035-2821 cm-1)
and SF6 (934- 954 cm-1).
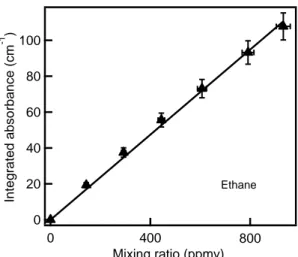
The integrated absorbances, the areas under the curves of the measured absorbances with absorption wavenumbers noted above, were used to determine concentrations. Calibration plots were generated by plotting the integrated absorbance against known mixing ratio of the hydrocarbon (ppmv); an example for ethane is shown in Figure 1. Similar plots for other alkanes are shown in the supporting information (Figure S2).
(b) Cavity Ring Down Spectrometer: A two-channel cavity ring down spectrometer operating at 662 nm was used to simultaneously measure the concentrations of NO3 (in
one channel) and N2O5 + NO3 (in another channel). The operating characteristics of this
instrument have been described in detail elsewhere.11-14 The time resolution of the instrument was 1s with detection limits of 0.4 and 2 pptv, respectively, for NO3 and
N2O5 for 1 second integrationas described in detail by Fuchs et al.15 The sample from
the chamber entering the CRDS system was passed through a filter to remove aerosols, which scatter the 662 nm light and thus degrade the sensitivity for NO3 detection. The
losses of NO3 and N2O5 to the walls of the instrument and the filter assembly have been
estimated15-18 to be less than 20% and 4%, respectively; these losses were accounted
for in calculating the concentrations. The overall accuracy of the measured NO3 and
N2O5 concentrations, respectively, are estimated to be from -8% to +11% and from −9%
to +12%.14 In the current study, the NO3 and N2O5 mixing ratios were, respectively,
between 50 and 2,500 pptv and between 1,000 and 28,000 pptv. The precisions of these measurements are much better than the quoted absolute uncertainties under the concentration conditions used in the present study. Therefore, the temporal variation of these reagents could be determined very precisely.
(c) The CAPS instrument: A commercial NO2 monitor from Aerodyne Research
Inc. was used to measure the NO2 concentrations during the experiments. This
8
attenuation that is detected by phase shift measurements. Levels of detection (3σ noise levels), as specified by the vendor, was less than 100 pptv for a 10 second averaging period.19
2.2 Chemicals
The following chemicals, with purities as stated by the supplier, were used without further purification: methane (> 99.995%, Air Liquid), ethane (> 99.995%, Air Liquid), propane (> 99.95%, Air Liquid), iso-butane (> 99.95%, Air Liquid), n-butane (> 99.95%, Air Liquid), cyclopentane (> 99.5%, Aldrich), cyclohexane (>99.5%, Aldrich), 2,3-dimethy butane (>99.5%, Aldrich), n-butane-D10 (98 atom % D, Aldrich) and n-butane-D6 (98 atom % D, Aldrich) . The alkene impurities in these samples are important since they can influence the measured rate coefficients. Therefore, they were measured using GC-MS analyses and are noted elsewhere.
The NO3 radicals were produced by thermal decomposition of N2O5 injected into
the chamber. Pure N2O5 was synthesized by mixing NO to a slowly flowing mixture of
O3 in N2 and collecting N2O5 in a trap at 193 K. The collected N2O5 was purified via
trap-to-trap distillation, as described by Davidson et al.20
2.3 Kinetic study method
The rate coefficients for the reactions of NO3 radicals with alkanes were measured
by following the temporal profiles of NO3, N2O5 and NO2 in excess of alkanes. During
this process, NO3, N2O5 and NO2 are in equilibrium; therefore, the loss of NO3 also
leads to the loss of N2O5. The temporal profiles of the absolute concentrations of the
NO3 and/or N2O5 can then be fit to a kinetic model to extract the reaction rate coefficient
of interest, as explained previously.8
N2O5 was injected into the middle of the chamber, where it decomposed to give
9 N2O5 k9 → NO3+NO2 (9) NO3+NO2 k10 → N2O5 (10)
The temporal variations of the concentrations of NO3, N2O5 and NO2 in the
chamber were continuously measured. The concentrations of NO3 and N2O5 decreased
with time as NO3 reacted with the alkanes and both N2O5 and NO3 were lost to the walls
of the chamber. The measured temporal profiles of NO3, N2O5 and NO2 concentrations
were calculated using a box model that integrated the set of reactions occurring in the chamber. The calculated profiles were compared to the observed concentrations and the differences between the observed and calculated concentrations were minimized (using a non-linear least squares algorithm). The fitting was done by minimizing together the sum of least-squares for both NO3 and N2O5 profiles while changing the input
parameters. The input parameters included the initial concentrations of each reactant (as measured) and rate coefficients for the reaction of NO3 with alkanes. First, the data
in the absence of alkane (the first 10 mins after N2O5 injection and before the injection
of alkanes) were fit to the reaction scheme with alkane concentration set to zero using the known values of k9 and k10 from NASA/JPL recommendation.21 (The derived rate
constants for NO3 + alkane were not very sensitive to the choice equilibrium constants
used; the difference between using the IUPAC versus NASA/JPL value for the equilibrium constant yielded rate coefficients that were less than 5% different.) The values of the first order rate coefficients for loss of NO3 and N2O5 to the walls (k11,s−1
and k12, s−1) were derived from the fit of the reaction scheme shown below:
N2O5 k9 → NO3+NO2 (9) NO3+NO2 k10 → N2O5 (10) NO3 k11 → loss (11) N2O5 k12 → loss (12)
Subsequently (roughly 10 mins after N2O5 injection), a known concentration of the
10 NO3 + alkane
k𝑥
→ products (R1+HNO3) (1-8)
The concentration of the alkane was measured using the FTIR (or pressure in case of CH4). As shown in Table 2 and 3, the concentration of the alkane was always at least a
2000 times (often hundreds-of-thousands of times) greater than that of NO3 in the
chamber. The temporal profiles of N2O5, NO3 and NO2 measured 60 s (roughly double
the time it takes for complete mixing) after alkane injection were again fit to the above reaction scheme that includes Reaction (1-8). Again, the fitting was done by minimizing the sum of least-squares for NO3 and N2O5 decays in the reaction scheme by varying
only the rate coefficient for the reaction of alkanes; the values of k11 and k12 were fixed
to the values derived from the observation in the absence of alkanes (i.e., during the first ~10 mins). The initial NO2 concentrations were sometimes altered very slightly
(less than 10%, well within the uncertainty of our measurements) to make the equilibrium constant derived from our observations agree with the known equilibrium constant from NASA/JPL evaluations. Part of this discrepancy could be due to a small amount of N2O5 decomposing in the CAPS instrument and the resultant NO2 and NO3
being detected at 450nm. Tests showed that the NO2 concentration could be utmost 15%
lower than that measured by CAPS due to the potential interference due to concentration of N2O5 in the chamber. We note that NO2 concentration was not central
to our analysis to obtain the rate coefficients.
3 Results and discussion
3.1 Accounting for subsequent reactions and impurities
We studied Reactions (1) through Reaction (8) under pseudo-first order conditions in NO3 in the presence of an excess of alkanes. The temporal profiles of NO3 depends
on: 1) the reaction under study; 2) its equilibrium with N2O5; and 3) the quantified
11 and NO2 for Reaction (1).
Many of the reactions studied here are very slow and we encountered two difficulties that needed to be accounted for: (1) the temporal profiles of NO3 (and N2O5)
could be influenced by its subsequent reactions with the products of the initial reaction; and (2) we needed to quantify the contribution of the reactive impurities (mostly alkenes, if present) in the excess reagent because their presence could lead to an overestimation of the rate coefficients. To examine and account for interferences due to secondary reactions, we carried out a series of calculations using a box model that contained the reactions in Table 1. We initially used a larger set of reactions that could take place in the chamber and found that the NO3 profiles were controlled by the subset of reactions
shown in Table S1. To examine the influence of impurity reactions, we analyzed the reactants for the presence of impurities and examined the dependence of the measured rate coefficients as a function of reaction time. As shown later, if there were very small amounts of impurities that could still influence the measured rate coefficients, they should be reacting away with NO3 in the initial period and thus we should see a
dependence of the measured rated coefficients with reaction times. This point will be discussed later.
Table 1
3.2 Experimental results
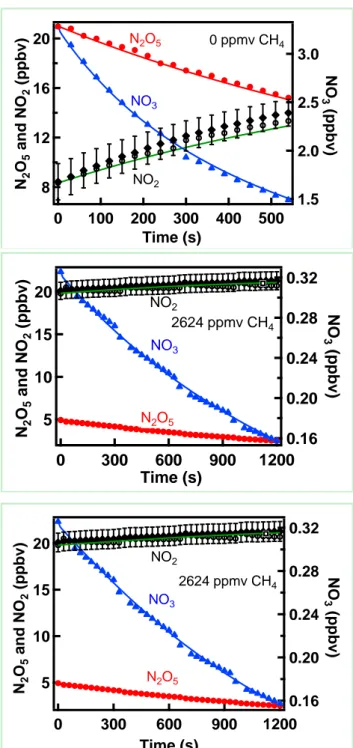
Figure 2 shows the observed and simulated temporal profiles of NO3, N2O5, and
NO2. Simulated profiles were obtained by numerical integration of the mechanism
shown in Table 1, as discussed above. Panel (1) shows these losses in the absence of methane with the methane concentration set to zero. From this fit, the rate coefficients for the wall loss of NO3 and N2O5 were derived. Panel (2) shows the loss of NO3 and
N2O5 in the presence of 2647 ppmv of methane. These data were again fit using the
mechanism in Table 1 with all of the rate coefficients for the secondary reactions set to zero, i.e., the additional NO3 loss attributed to only reaction with methane. Panel (3)
12
1. Clearly, the fits in panel 2 and 3 are both good, but the obtained values of the rate coefficient for the reaction of NO3 with CH4 are different. The reason for the good fit
in both cases is that the reactions subsequent to initial reaction with CH4 are rapid and
have the effect of changing the stoichiometry from 1 to 2, or more, for NO3 radicals
consumed per reaction with methane.
Figure 2
Multiple experiments were carried out by varying concentration of alkanes and initial NO3. The fits of the observed temporal profiles in such experiments for ethane
are shown in the supporting information as Figure S3. The inclusion of secondary reactions in the simulations shows that they contribute substantially to the measured temporal profiles and derived NO3 reaction rate coefficients.
Table 2
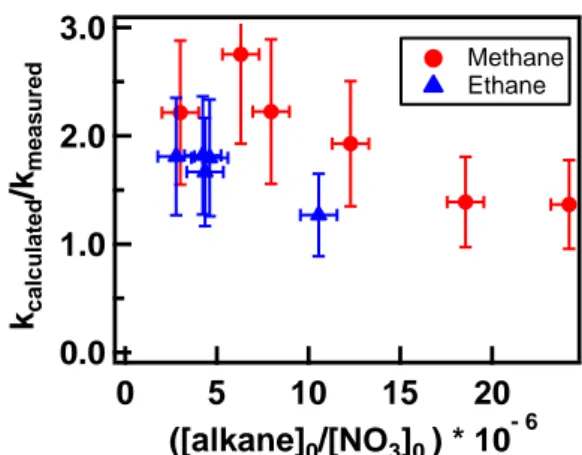
We examined the ratios of the rate coefficient obtained without and with the inclusion of the secondary reactions (Ratio 1) as a function of the ratios of the alkane to initial NO3 concentrations (Ratio 2) (Figure 3). Clearly, the Ratio 1 decreased as the
ratio of the methane/ethane to NO3 (Ratio 2) increased. It asymptotically approached 1,
as the ratio of alkane to NO3 increased. Ideally, an additional factor of 10 increase in
the alkane to NO3 ratio would have almost completely suppressed the importance of
the secondary reactions. However, such a ratio was difficult to achieve in our chamber. Increasing the alkane concentration would increase the NO3 loss rate relative to the
mixing time and possibly perturb the equilibration between NO3 and N2O5. Decreasing
the NO3 concentration would decrease the precision of measured NO3 profiles
(measured for approximately 20 minutes). Figure 3
The presence of any reactive impurity whose concentration does not change appreciably with reaction time will not be sensitive to this analysis and could influence the accuracy of the measured rate coefficient. The effects of reactive impurities are discussed further in the section on error estimation below.
13
3.3 Measured rate coefficients and their uncertainties
The results of our measured values of k1-k8 are given in Tables 2 and 3. We will
first discuss the estimated uncertainties in these reported rate coefficients. Table 3.
The errors on the reported rate coefficients arise from: (1) the precision in the measurements of the concentrations of NO3, N2O5 and NO2; (2) the uncertainty in the
concentration of the alkanes, the excess reagent; (3) the uncertainty of the rate coefficients shown in Table 1; and (4) the precision of our fitting.
In the present study, the systematic errors in measurements of NO3 and N2O5 using
the CRDS system employed here have been assessed to be −8/+11% for NO3 and
−9/+12% for N2O5, as noted earlier. The error in measurement of NO2 (after correcting
for the potential interference due to N2O5) using CAPS monitor has been assessed to be
15%. Systematic errors in the measured concentration of the alkanes are estimated to be 5% for each compound (this includes the uncertainties in the calibration curves that is mostly due to the manometric preparation of the mixtures and the uncertainties in measuring the integrated absorbance). All the noted uncertainties are at the 95% confidence level. The uncertainty in the fitting, as noted above, is better than 5%. But the uncertainty of the rate coefficients used in the reaction scheme of the box model to fit the curves (k7, k8) can reach almost 60%.22 This uncertainty includes estimated error
arising from not simulating the entire reaction sequence. Note that this uncertainty does not translate linearly into the estimated uncertainties in the rate coefficients. For example, an uncertainty of 50% in the rate coefficients for the reaction of RO2 with
NO3, the major secondary reaction, translates to an uncertainty of less than 15% in the
reported value of the rate coefficient. Therefore, we estimated that the uncertainty in our simulated correction is less than 15% for the uncertainty in this rate coefficient. To be conservative, we have used the larger uncertainties in calculating the upper limits for k1 and k2.
14
7%. The uncertainty in the precision of our measured rate coefficients were obtained by the standard deviation of the mean of multiple measurements and including the Student t value accounting for the limited number of measurements. The overall estimated error in the rate coefficients included the fitting error, estimated uncertainty of absolute concentrations of each reactant, the precision of the measurements of kalkane,
and the uncertainty due to potential errors in the rate coefficients used from the literatures into account.
Another potential source of error in the rate coefficients measured by using the absolute method is the presence of reactive impurities in the sample of the alkanes. The alkanes used in the study were the purest we could obtain from commercial vendors. For methane and ethane, the impurities are less than 0.005% (50 ppmv) and the main impurities are nonreactive gases such as, N2, O2, and CO2. However, we cannot rule out
very small amounts of reactive impurities (<20 ppm). If such an impurity that reacts with a rate coefficient of 1×10-13 cm3 molecule-1 s-1 were present, its concentration
cannot be more than about 0.5 ppmv even if we attributed the entire measured rate coefficient to the impurity reaction. For methane and ethane, second and third aliquots of N2O5 (~20 ppbv) were introduced to the chamber roughly 1 hour after the initial
alkane injection. Small amounts of reactive impurities would have reacted with NO3
over the hour, reducing their concentrations. The temporal profiles of NO3, N2O5 and
NO2 were again fit to the reaction scheme and we obtained rate coefficient (kalkane) that
were within 7% of the initial values, a difference significantly smaller than the estimated uncertainty. Therefore, from these experiments, we estimate that less than 0.1 ppmv reactive impurities were present in the alkane samples. Based on these observations, we suggest that the contribution of reactive alkenes was small. It is still possible that the reaction of NO3 with methane and ethane could be slower than the
values noted above. Therefore, we quote the rate coefficients for the reactions of NO3
with methane and ethane to be upper limits of, respectively, <4 ×10-20 and <5 × 10-19
cm3 molecule-1 s-1.
15
of olefinic impurities in propane, n-butane and iso-butane. Our detection limit for alkenes in these alkanes was < 20ppmv. For propane, less than 50 ppm propene was detected as a main reactive impurity, and mixing ratios for other olefins were below the detection limit of 20 ppmv. Based on these upper limits for olefins, we conclude that our measured values for k3-k5 were not influenced by alkenes.
Figure 4
The rate coefficient for reaction of propane with NO3 radicals was obtained by
fitting the observed temporal profiles of NO3, N2O5, NO2 in different conditions as
shown Figure 4. Simulation of these profiles where we assumed 50 ppmv of propene impurity in propane are shown as the line in Figure 4. Based on such simulations, we estimate that effect of reactive impurity to the reaction rate coefficient for NO3 reaction
with propane is less than 7%. Furthermore, fits to the data from different reaction time periods, when some of the alkenes should have been depleted due to reaction with NO3,
yielded rate coefficients that were less than 10% different. However, the simulations show that 50 ppmv of propene would not be completely remove by the levels of NO3
present in the reactor.
The rate coefficients for reaction of NO3 with n-butane, iso-butane,
2,3-dimethylbutane cyclopentane and cyclohexane were also studied in this work, and the typical observed temporal profiles of NO3 and N2O5 in such experiments are similar to
those of other alkanes described above. The purities of each alkane specified by the vendor and determined by GC-MS measurements are listed in Table S2. The contributions of this level of olefins in alkanes do not affect the measured rate coefficient by more than 10%. The related Figure S4 in the supporting information demonstrates the derivation of the same rate constant at different reaction times for the NO3 + cyclopentane system. The experimental conditions and rate constants for
reaction of NO3 with these reactants are summarized in Table 3. The related figures are
shown in the Supporting Information as Figure S5-Figure S9.
The results in Table 3 clearly shows that a major contributor to the uncertainty in our measured rate coefficients is the secondary reactions of NO3 with the products of
16
the reactions noted earlier. This uncertainty has been incorporated in our analyses.
3.4 Comparison with the kinetic results in literature
Many of the reported rate coefficients for alkanes were measured relative to that of NO3 with ethene. The rate constant of ethene with NO3 was recommended by IUPAC22
to be (2.1 ± 1.2) × 10−16 cm3 molecule−1 s−1; i.e., with an uncertainty of 58% uncertainty.
Therefore, we measured the rate coefficient for this reaction using the same method as for alkanes to be (2.6±0.4) × 10-16 cm3 molecule-1 s-1 (see Supplementary Table S3). We
used our measured value to place previous relative measurements on an absolute basis. Our measured rate coefficients of NO3 radicals with alkanes are compared with
those from the literature in Table 4. The upper limits of methane with NO3 radicals were
all derived based on no observable reaction occurring in their systems.5, 28-30 The results
of Cantrell et al30 on k
1 are very indirect and is based on their inability to detect CO and
CO2 in their reactor when CH4 was mixed with NO3 and N2O5. It is possible that the
reactions of CH3 radicals in their system could lead to end-products other than CO or
CO2, e.g., nitrates or formaldehyde. The upper limits for k2 at room temperature were
derived by Wallington et al and Boyd et al to be <2.7×10⁻¹⁷ and <4×10-18 cm3 molecule-1 s-1, respectively.5, 24 Bagley et al.4 reported k
2 at 453K and above. An extrapolation of
their measured rate coefficients using the Arrhenius expression leads to k2 (298K) = 2.0
× 10-18 cm3 molecule-1s-1, and but likely has a significant uncertainty. Previous studies have obtained rate coefficients for reactions with n-butane are all higher than the value measured by all but Wallington et al. 29 We assume that Wallingtonet al. supersedes the earlier reported value from the same group. 2 It is likely that the difference with our value reported by Bagley et al is due to the extrapolation from high temperatures (where they measured the rate coefficients). The previous reported rate coefficients for the reactions with iso-butane and 2,3-dimethybutane at room temperature, mainly using relative rate techniques with ethene as the reference compound, are in good agreement with our values. In those cases, we recommend a weighted average (Table 4) for use in atmospheric calculations. There are no previous reports for the rate coefficients for the
17
reactions of NO3 with cyclepentane. It is worth noting that agreement is better with
larger alkanes with larger rate coefficients. Table 4
Our upper limit for the reactions of NO3 with methane is lower than all the previous
reports except for that by Cantrell et al. As noted earlier, the upper limit reported by Cantrell et al. was based on the absence of CO and CO2 being produced in their system.
The low rate coefficient for this reaction is not surprising since it is slightly endothermic, and the barrier height for the reaction is large. We also report an upper limit for the reaction of NO3 with ethane, lower than all previous reports. We quote this only as an
upper limit given that it is very low and very small levels of impurities can lead to errors. We are the first to report, to the best of our knowledge, the rate coefficients of NO3
reaction with propane and cyclopentane. The reported values of the rate coefficients of 2,3-dimethylbutane and cyclohexane are in reasonable agreement with available values. A weighted average of these values (Table 4) is recommended for atmospheric purposes.
3.5 Relation between structure and reactivity of alkanes.
We observe an increase in the reactivity with the chain length k1(methane) <
k2(Ethane) < k3(Propane) < k4(n-butane). Further, the iso-butane and
2,3-dimethybutane react faster than their normal analogs. This observation is consistent with NO3 reaction occurring via H atom abstraction from primary, secondary, and
tertiary C-H bonds, respectively.
For simple alkanes, the C-H bond dissociation energies are: primary C-H, -100 kcal mol-1; secondary C-H, -96 kcal mol-1 and tertiary C-H -94 kcal mol-1, respectively.31 So,
we expect the reaction to be faster for molecules with lower C-H bond energy, since we expect the reaction to proceed via H atom abstraction from the weakest C-H bonds in the molecule.
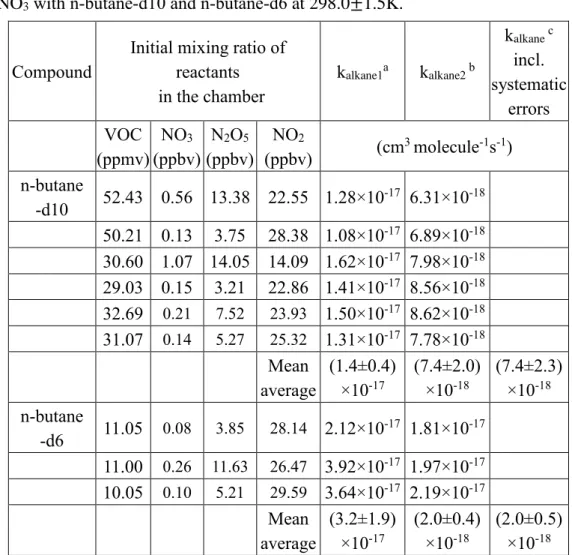
To further examine this mechanism, the rate coefficients for reactions of NO3 with
two different deuterated n-butanes (n-butane-d10 and n-butane-1,1,1,4,4,4-d6) were measured (see Table 5) to be (7.4 ± 2.3) ×10-18 and (2.0 ± 0.5) ×10-17 cm3 molecule-1s-1,
18
respectively. Because of possible reactive impurities in the gas samples, the rate coefficients obtained for n-butane-d10 and n-butane-1,1,1,4,4,4-d6 may be overestimates. As seen from these values, k4(n-butane)/k(n-butane-d6) > 0.75, and k4
(n-butane)/k(n-butane-d10) > 2. Therefore, deuteration reduces the rate coefficient for the
reaction, an observation consistent with a reaction mechanism via H atom abstraction.32,33
Table 5.
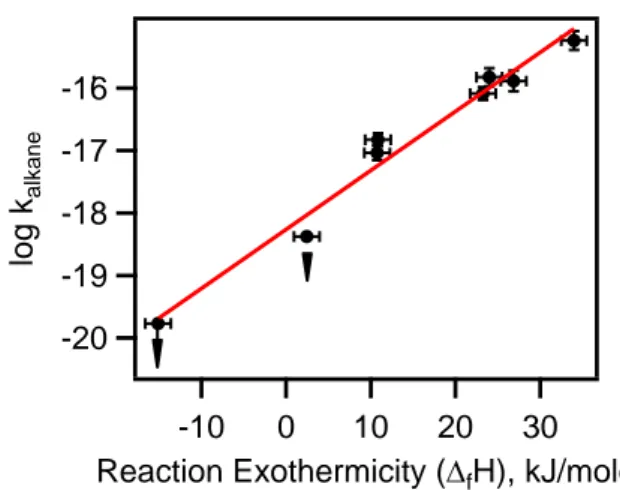
The enthalpies of each reaction under standard state conditions are shown in the introduction section. From the enthalpies of these reactions, we find Reaction (1) and (4a) to be endothermic reactions and all the other reactions are exothermic.
We have plotted the rate coefficient for the measured alkanes and cycloalkanes as a function of the reaction exothermicity (Reaction (1), (2), (3), (4b), (5b), (6b), (7) and (8)) in Figure 5. Clearly, the log of the rate coefficient at 298 K correlates with the exothermicity or the bond dissociation energy. This is to be expected for an abstraction reaction where the activation energy for the reaction is directly related to the dissociation energy for the bond being broken, i.e., the C-H bond in the reactions studied here. The correlation is surprisingly robust. Based on this correlation, we suggest that the rate coefficient for the reaction of NO3 with CH4 is not more than a
factor of five lower than that reported here. Also, this correlation and the finding that the reaction proceeds via H atom abstraction from the weakest C-H bond mean that reactions 1-8 will have substantial activation energies. Therefore, one would expect the rate coefficients to be smaller at lower atmospheric temperatures.
Figure 5.
4 Atmospheric implication
Calculation of the atmospheric lifetimes of VOCs, including alkanes, due to their reaction with NO3 is difficult since neither NO3 nor larger alkanes are uniformly mixed
in the troposphere34. The reactions of NO
3 with smaller alkanes are clearly negligible.
19 using the following equation35.
τ = 1 kvoc[X]
In this calculation, [X] represents the concentration of typical atmospheric oxidants (OH, Cl and NO3) and kalkane is the rate constant of the reactions between alkanes and
oxidants at 298 K. The concentrations for the oxidants vary greatly in the troposphere. For example, the measured range of NO3 mixing ratios is 0.1 – 400 pptv. The estimated
concentrations36 of Cl atoms are usually less than 1 × 10⁴ molecules cm−3. The
concentrations of OH radicals vary from essentially zero to roughly 107 cm-3. Therefore,
clearly, the contributions of NO3 reactions towards the removal of alkanes will be
negligible compared to those via OH radical or Cl atoms. Unlike OH and Cl atoms, NO3 is prevalent at night. Therefore, one might expect that at high latitudes during long
period of darkness the reactions of NO3 with large alkanes could contribute to the
removal of such alkanes. However, we expect the lower temperatures would also mean lower reactivities. Removal of large alkenes by NO3 reactions has been
suggested by Carslaw et al.37 To our knowledge, there is no atmospheric evidence for
significant removal of alkanes by NO3. However, these NO3 reactions could indeed
contribute to the removal of NO3 in regions with high alkane concentrations and
temperatures closer to 298 K, such as in the regions affected by oil/gas extraction activities.1
Acknowledgment
This work was supported by the Labex Voltaire (ANR-10-LABX-100-01), ARD PIVOTS program (supported by the Centre-Val de Loire regional council), the European Union’s Horizon 2020 research and innovation programme through the EUROCHAMP-2020 Infrastructure Activity under grant agreement No. 730997 and by the French National program LEFE (Les Enveloppes Fluides et l’Environnement). ARR was supported by Le Studium of the Loire Valley during his summer stay at CNRS-ICARE. SSB was supported by National Oceanic and Atmospheric Administration.
21
References
1. R. J. Wild, P. M. Edwards, T. S. Bates, R. C. Cohen, J. A. de Gouw, W. P. Dubé, J. B. Gilman, J. Holloway, J. Kercher, A. R. Koss, L. Lee, B. M. Lerner, R. McLaren, P. K. Quinn, J. M. Roberts, J. Stutz, J. A. Thornton, P. R. Veres, C. Warneke, E. Williams, C. J. Young, B. Yuan, K. J. Zarzana and S. S. Brown,
Atmos. Chem. Phys., 2016, 16, 573-583.
2. R. Atkinson, C. N. Plum, W. P. Carter, A. M. Winer and J. N. Pitts Jr, The J.
Phys. Chem., 1984, 88, 2361-2364.
3. R. Atkinson, S. M. Aschmann and J. N. Pitts Jr, J. Phys. Chem., 1988, 92, 3454-3457.
4. J. A. Bagley, C. Canosa-Mas, M. R. Little, A. D. Parr, S. J. Smith, S. J. Waygood and R. P. Wayne, J. Chem. Soc., Faraday Trans, 1990, 86, 2109-2114.
5. A. A. Boyd, C. E. Canosa-Mas, A. D. King, R. P. Wayne and M. R. Wilson, J.
Chem. Soc., Faraday Trans, 1991, 87, 2913-2919.
6. D. Burgess, NIST Chemistry WebBook, NIST Standard Reference Database Number 69, National Institute of Standards and Technology, 2018, https://doi.org/10.18434/T4D303.
7. R. R. Baldwin, G. R. Drewery and R. W. Walker, J. Chem. Soc., Faraday Trans
1: Physical Chemistry in Condensed Phases, 1984, 80, 3195-3207.
8. L. Zhou, A. R. Ravishankara, S. S. Brown, M. Idir, K. J. Zarzana, V. Daële and A. Mellouki, J. Phys. Chem. A, 2017, 121, 4464-4474.
9. F. Bernard, G. Eyglunent, V. Daele and A. Mellouki, J. Phys. Chem. A, 2010, 114, 8376-8383.
10. H. Chen, Y. Ren, M. Cazaunau, V. Dalele, Y. Hu, J. Chen and A. Mellouki, Chem.
Phys. Lett., 2015, 621, 71-77.
11. S. S. Brown, H. Stark and A. R. Ravishankara, Appl. Phys. B-lasers. O, 2002, 75, 173-182.
22
12. S. S. Brown, H. Stark, S. J. Ciciora, R. J. McLaughlin and A. R. Ravishankara,
Rev. Sci. Instrum., 2002, 73, 3291-3301.
13. S. S. Brown, Chem. Rev., 2003, 103, 5219-5238.
14. N. L. Wagner, W. P. Dube, R. A. Washenfelder, C. J. Young, I. B. Pollack, T. B. Ryerson and S. S. Brown, Atmos. Meas. Tech., 2011, 4, 1227-1240.
15. H. Fuchs, W. P. Dube, S. J. Cicioira and S. S. Brown, Anal. Chem., 2008, 80, 6010-6017.
16. W. P. Dube, S. S. Brown, H. D. Osthoff, M. R. Nunley, S. J. Ciciora, M. W. Paris, R. J. McLaughlin and A. R. Ravishankara, Rev. Sci. Instrum., 2006, 77.
17. H. Fuchs, W. R. Simpson, R. L. Apodaca, T. Brauers, R. C. Cohen, J. N. Crowley, H. P. Dorn, W. P. Dubé, J. L. Fry, R. Häseler, Y. Kajii, A. Kiendler-Scharr, I. Labazan, J. Matsumoto, T. F. Mentel, Y. Nakashima, F. Rohrer, A. W. Rollins, G. Schuster, R. Tillmann, A. Wahner, P. J. Wooldridge and S. S. Brown, Atmos.
Meas. Tech., 2012, 5, 2763-2777.
18. H. P. Dorn, R. L. Apodaca, S. M. Ball, T. Brauers, S. S. Brown, J. N. Crowley, W. P. Dube, H. Fuchs, R. Haeseler, U. Heitmann, R. L. Jones, A. Kiendler-Scharr, I. Labazan, J. M. Langridge, J. Meinen, T. F. Mentel, U. Platt, D. Poehler, F. Rohrer, A. A. Ruth, E. Schlosser, G. Schuster, A. J. L. Shillings, W. R. Simpson, J. Thieser, R. Tillmann, R. Varma, D. S. Venables and A. Wahner,
Atmos. Meas. Tech., 2013, 6, 1111-1140.
19. P. L. Kebabian, E. C. Wood, S. C. Herndon and A. Freedman, Environ Sci
Technol, 2008, 42, 6040-6045.
20. J. A. Davidson, A. A. Viggiano, C. J. Howard, I. Dotan, F. C. Fehsenfeld, D. L. Albritton and E. E. Ferguson, J. Chem. Phys., 1978, 68, 2085-2087.
21. J. Burkholder, S. Sander, J. Abbatt, J. Barker, R. Huie, C. Kolb, M. Kurylo, V. Orkin, D. Wilmouth and P. Wine, “Chemical Kinetics and Photochemical Data for Use in Atmospheric Studies, Evaluation No. 18," JPL Publication 15-10, Jet Propulsion Laboratory, Pasadena, 2015 http://jpldataeval.jpl.nasa.gov.
23
22. R. Atkinson, D. L. Baulch, R. A. Cox, J. N. Crowley, R. F. Hampson, R. G. Hynes, M. E. Jenkin, M. J. Rossi and J. Troe, Atmos. Chem. Phys., 2004, 4, 1461-1738.
23. V. Daele, G. Laverdet, G. Le Bras and G. Poulet, J. Phys. Chem., 1995, 99, 1470-1477.
24. A. Ray, V. Daële, I. Vassalli, G. Poulet and G. Le Bras, J. Phys. Chem., 1996, 100, 5737-5744.
25. S. Vaughan, C. E. Canosa-Mas, C. Pfrang, D. E. Shallcross, L. Watson and R. P. Wayne, Phys Chem Chem Phys, 2006, 8, 3749-3760.
26. R. Atkinson, D. L. Baulch, R. A. Cox, J. N. Crowley, R. F. Hampson, R. G. Hynes, M. E. Jenkin, M. J. Rossi, J. Troe and I. Subcommittee, Atmos Chem
Phys, 2006, 6, 3625-4055.
27. M. E. Jenkin, S. M. Saunders and M. J. Pilling, Atmos. Environ., 1997, 31, 81-104.
28. J. P. Burrows, G. S. Tyndall and G. K. Moortgat, J. Phys. Chem., 1985, 89, 4848-4856.
29. T. J. Wallington, R. Atkinson, A. M. Winer and J. N. Pitts, J. Phys. Chem., 1986, 90, 4640-4644.
30. C. A. Cantrell, J. A. Davidson, R. E. Shetter, B. A. Anderson and J. G. Calvert,
J. Phys. Chem., 1987, 91, 6017-6021.
31. A. L. Castelhano and D. Griller, J. Am. Chem. Soc., 1982, 104, 3655-3659. 32. B. S. Rabinovitch and D. W. Setser, eds W. A. Noyes, G. S. Hammond and J. N.
Pitts, in Advances in Photochemistry, 2007, doi:10.1002/9780470133330.ch1. 33. J. C. Nesheim and J. D. Lipscomb, Biochemistry-us., 1996, 35, 10240-10247. 34. S. S. Brown and J. Stutz, Chem. Soc. Rev., 2012, 41, 6405-6447.
35. R. Atkinson and J. Arey, Chem. Rev., 2003, 103, 4605-4638.
36. O. W. Wingenter, M. K. Kubo, N. J. Blake, T. W. Smith, D. R. Blake and F. S. Rowland, J. Geophys. Res.: Atmos., 1996, 101, 4331-4340.
24
37. N. Carslaw, L. Carpenter, J. Plane, B. Allan, R. Burgess, K. Clemitshaw, H. Coe and S. Penkett, J. Geophys. Res.: Atmos., 1997, 102, 18917-18933.
25
Figures
Figure 1. Calibration curve for ethane- A plot of the integrated absorbance of ethane centered at 837 cm-1 (measured as the area under the absorbance between 940-734 cm-1) as a function of the mixing ratio of ethane in the chamber as determined by manometric measurements. The data was fit to a line passing through zero using a linear least-squares analysis. The uncertainties in each point, derived from multiple measurements, are shown as vertical error bars.
100 80 60 40 20 0 Int eg ra ted ab so rb an ce (c m -1 ) 800 400 0 Mixing ratio (ppmv) Ethane
26
Figure 2. Observed (data points) and simulated (lines) profiles of N2O5, NO3 and NO2
as a function of time. Mixing ratios of CH4 are shown in each panel. The simulations
in the middle panel did not include secondary reactions of NO3 reaction products while
those in the bottom panel included such reactions (shown in Table 1).
20 16 12 8 N2 O5 an d NO 2 (p pb v) 500 400 300 200 100 0 Time (s) 3.0 2.5 2.0 1.5 NO 3 (p pb v) N2O5 NO3 NO2 0 ppmv CH4 20 15 10 5 N2 O5 an d NO 2 (p pb v) 1200 900 600 300 0 Time (s) 0.32 0.28 0.24 0.20 0.16 NO 3 (p pb v) NO2 N2O5 NO3 2624 ppmv CH4 20 15 10 5 N2 O5 a n d NO 2 ( p p b v) 1200 900 600 300 0 Time (s) 0.32 0.28 0.24 0.20 0.16 NO 3 (p pb v) NO2 NO3 2624 ppmv CH4 N2O5
27
Figure 3 The ratio of calculated rate coefficients to that measured without accounting for secondary reactions (Ratio 1) versus the ratio of alkanes to NO3 (Ratio
2) for reactions (1) and (2). Clearly, the ratio approaches 1.0 as Ratio 2 increases. 3.0 2.0 1.0 0.0 kca lculated /kme as ured 20 15 10 5 0 ([alkane]0/[NO3]0 ) * 10- 6 Methane Ethane
28 19 18 17 16 15 14 13 N2 O5 an d NO 2 (p pb v) 400 300 200 100 0 Time (s) 1.00 0.90 0.80 0.70 NO 3 (p pb v) N2O5 NO3 NO2 0 ppmv C3H8 0.5 0.4 0.3 0.2 0.1 NO 3 (p pb v) 1200 900 600 300 0 Time (s) 30 20 10 N2 O5 an d NO 2 (p pb v) N2O5 NO3 NO2 99.86 ppmv C3H8 30 20 10 N2 O5 an d NO 2 (p pb v) 1200 900 600 300 0 Time (s) 0.5 0.4 0.3 0.2 0.1 NO 3 (p pb v) N2O5 NO3 NO2 99.86 ppmv C3H8 30 25 20 15 10 5 N2 O5 an d NO 2 (p pb v) 1200 900 600 300 0 Time (s) 0.5 0.4 0.3 0.2 0.1 NO 3 (p pb v) N2O5 NO3 NO2 99.86 ppmv C3H8
29
Figure 4. Observed (data points) and simulated (lines) profiles of N2O5, NO3 and NO2
as a function of time. Mixing ratios of propane (C3H8) are shown in each panel. The
simulations in the 2nd panel did not include secondary reactions of NO3 reaction
products while those in the 3rd panel included such reactions (shown in Table 1). The simulations in the 4th panel included both secondary reactions and reactions with impurities (see Table S1).
30
Figure 5: Rate coefficient for the reaction of NO3 with alkanes on a logarithm scale
plotted against the exothermicity for each reaction shown in the text. The upper limits for reactions with methane and ethane are shown with arrows to highlight that they are upper limits. Note, the slope of the plot would be larger if the rate coefficients for NO3
reactions with methane and ethane were lower than indicated. -20 -19 -18 -17 -16 lo g k alkane 30 20 10 0 -10
31
Tables
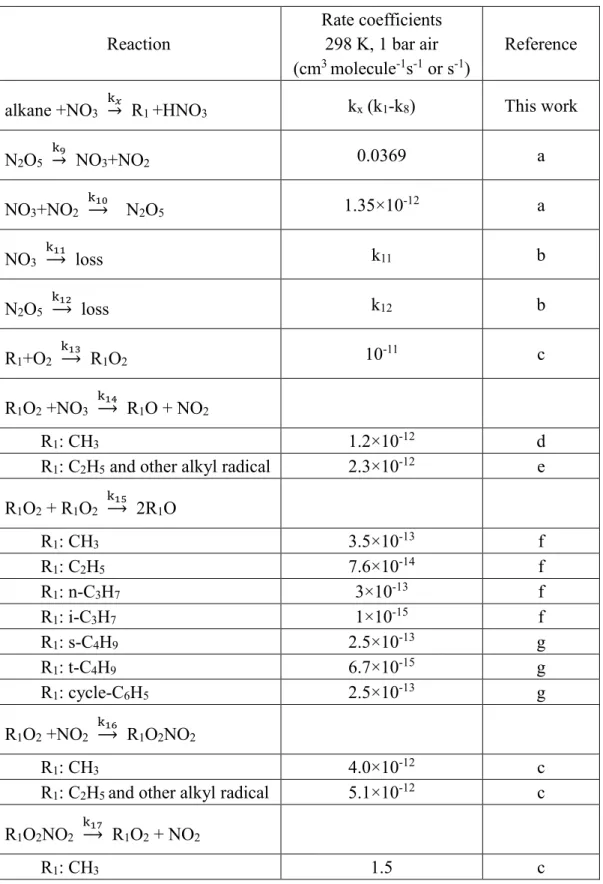
Table 1. Reactions of the products of the NO3 reaction with alkanes in the presence of
O2 and nitrogen oxides included in simulating the temporal profiles of NO3 and N2O5.
Reaction Rate coefficients 298 K, 1 bar air (cm3 molecule-1s-1 or s-1) Reference alkane +NO3 k𝑥
→ R1 +HNO3 kx (k1-k8) This work
N2O5 k9 → NO3+NO2 0.0369 a NO3+NO2 k10 → N2O5 1.35×10⁻¹² a NO3 k11 → loss k11 b N2O5 k12 → loss k12 b R1+O2 k13 → R1O2 10-11 c R1O2 +NO3 k14 → R1O + NO2 R1: CH3 1.2×10⁻¹² d
R1: C2H5 and other alkyl radical 2.3×10⁻¹² e
R1O2 + R1O2 k15 → 2R1O R1: CH3 3.5×10⁻¹³ f R1: C2H5 7.6×10⁻¹⁴ f R1: n-C3H7 3×10-13 f R1: i-C3H7 1×10-15 f R1: s-C4H9 2.5×10⁻¹³ g R1: t-C4H9 6.7×10⁻¹⁵ g R1: cycle-C6H5 2.5×10⁻¹³ g R1O2 +NO2 k16 → R1O2NO2 R1: CH3 4.0×10⁻¹² c
R1: C2H5 and other alkyl radical 5.1×10⁻¹² c
R1O2NO2 k17
→ R1O2 + NO2
32
R1: C2H5 and other alkyl radical 3.4 c
R1O +O2 k18 → R2CHO + HO2 7.14×10⁻¹⁴ g R1O2 + HO2 k19 → R1OOH + O2 R1: CH3 5.2×10⁻¹² f R1: C2H5 7.97×10⁻¹² g R1: i-C3H7 1.19×10⁻¹¹ g R1: s-C4H9 1.43×10⁻¹¹ g R1: t-C4H9 1.43×10⁻¹¹ g R1: C6H13 1.76×10⁻¹¹ g R1: cycle-C6H11 1.76×10⁻¹¹ g R2CHO +NO3 k20 → R3COOO + HNO3 R3: H 5.5×10⁻¹⁶ f
R3: CH3 and other alkyl radical 2.7×10⁻¹⁵ f
HO2 +NO3 k21 → OH + NO2 + O2 4×10-12 f OH +NO3 k22 → HO2 + NO2 2×10-11 f NO2 +OH k23 → HONO2 / HOONO 6.5×10⁻¹¹ f a (21)
b (Derived from the first period of the experiments: observation in the absence of alkanes) c (22) d (23) e (24, 25) f (26) g (27)
33
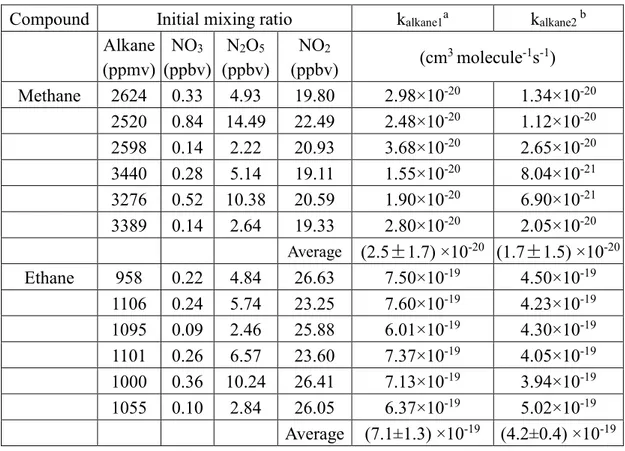
Table 2. Summary of the experimental conditions and upper limits for reaction of NO3
with methane and ethane at 298.0±1.5K.
Compound Initial mixing ratio kalkane1a kalkane2 b
Alkane (ppmv) NO3 (ppbv) N2O5 (ppbv) NO2 (ppbv) (cm 3 molecule-1s-1) Methane 2624 0.33 4.93 19.80 2.98×10⁻²⁰ 1.34×10⁻²⁰ 2520 0.84 14.49 22.49 2.48×10⁻²⁰ 1.12×10⁻²⁰ 2598 0.14 2.22 20.93 3.68×10⁻²⁰ 2.65×10⁻²⁰ 3440 0.28 5.14 19.11 1.55×10⁻²⁰ 8.04×10⁻²¹ 3276 0.52 10.38 20.59 1.90×10⁻²⁰ 6.90×10⁻²¹ 3389 0.14 2.64 19.33 2.80×10⁻²⁰ 2.05×10⁻²⁰ Average (2.5±1.7) ×10-20 (1.7±1.5) ×10-20 Ethane 958 0.22 4.84 26.63 7.50×10⁻¹⁹ 4.50×10⁻¹⁹ 1106 0.24 5.74 23.25 7.60×10⁻¹⁹ 4.23×10⁻¹⁹ 1095 0.09 2.46 25.88 6.01×10⁻¹⁹ 4.30×10⁻¹⁹ 1101 0.26 6.57 23.60 7.37×10⁻¹⁹ 4.05×10⁻¹⁹ 1000 0.36 10.24 26.41 7.13×10⁻¹⁹ 3.94×10⁻¹⁹ 1055 0.10 2.84 26.05 6.37×10⁻¹⁹ 5.02×10⁻¹⁹ Average (7.1±1.3) ×10-19 (4.2±0.4) ×10-19
a The calculated value without including secondary reactions shown in Table 1. Quoted errors are at
the 95% confidence level and are measures of the precision of our measurements. It includes Student t-distribution contribution due to the limited number of measurements.
b The calculated values that include secondary reactions shown in Table 1. Quoted errors are at the
95% confidence level and are measures of the precision of our measurements. It includes Student t-distribution contribution due to the limited number of measurements.
34
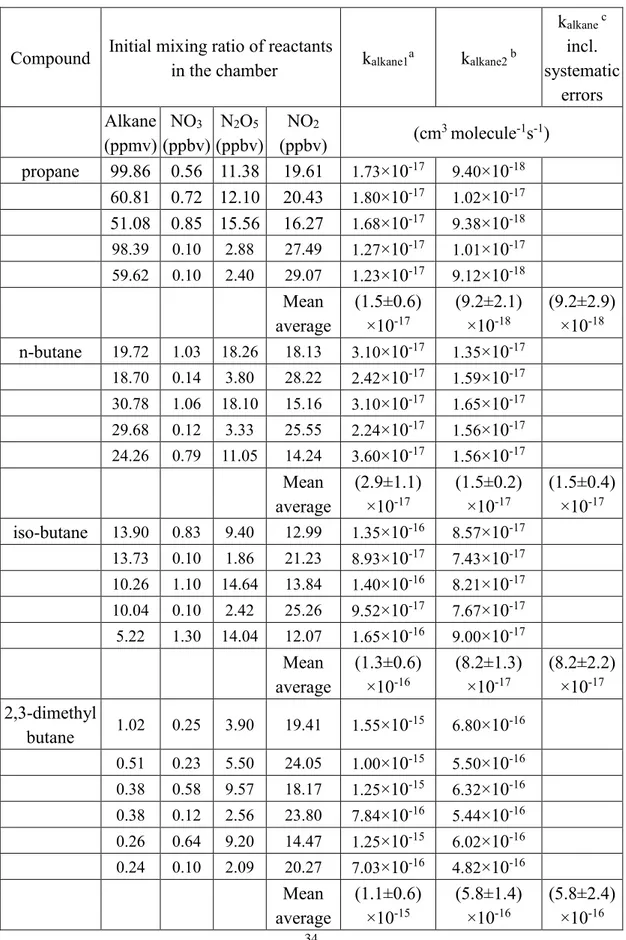
Table 3. Summary of the experimental conditions and rate coefficients for reaction of NO3 with propane, n-butane, iso-butane, 2,3-dimethylbutane cyclopentane and
cyclohexane at 298.0±1.5K.
Compound Initial mixing ratio of reactants
in the chamber kalkane1
a k alkane2 b kalkane c incl. systematic errors Alkane (ppmv) NO3 (ppbv) N2O5 (ppbv) NO2 (ppbv) (cm 3 molecule-1s-1) propane 99.86 0.56 11.38 19.61 1.73×10⁻¹⁷ 9.40×10⁻¹⁸ 60.81 0.72 12.10 20.43 1.80×10⁻¹⁷ 1.02×10⁻¹⁷ 51.08 0.85 15.56 16.27 1.68×10⁻¹⁷ 9.38×10⁻¹⁸ 98.39 0.10 2.88 27.49 1.27×10⁻¹⁷ 1.01×10⁻¹⁷ 59.62 0.10 2.40 29.07 1.23×10⁻¹⁷ 9.12×10⁻¹⁸ Mean average (1.5±0.6) ×10-17 (9.2±2.1) ×10-18 (9.2±2.9) ×10-18 n-butane 19.72 1.03 18.26 18.13 3.10×10⁻¹⁷ 1.35×10⁻¹⁷ 18.70 0.14 3.80 28.22 2.42×10⁻¹⁷ 1.59×10⁻¹⁷ 30.78 1.06 18.10 15.16 3.10×10⁻¹⁷ 1.65×10⁻¹⁷ 29.68 0.12 3.33 25.55 2.24×10⁻¹⁷ 1.56×10⁻¹⁷ 24.26 0.79 11.05 14.24 3.60×10⁻¹⁷ 1.56×10⁻¹⁷ Mean average (2.9±1.1) ×10-17 (1.5±0.2) ×10-17 (1.5±0.4) ×10-17 iso-butane 13.90 0.83 9.40 12.99 1.35×10⁻¹⁶ 8.57×10⁻¹⁷ 13.73 0.10 1.86 21.23 8.93×10⁻¹⁷ 7.43×10⁻¹⁷ 10.26 1.10 14.64 13.84 1.40×10⁻¹⁶ 8.21×10⁻¹⁷ 10.04 0.10 2.42 25.26 9.52×10⁻¹⁷ 7.67×10⁻¹⁷ 5.22 1.30 14.04 12.07 1.65×10⁻¹⁶ 9.00×10⁻¹⁷ Mean average (1.3±0.6) ×10-16 (8.2±1.3) ×10-17 (8.2±2.2) ×10-17 2,3-dimethyl butane 1.02 0.25 3.90 19.41 1.55×10 -15 6.80×10⁻¹⁶ 0.51 0.23 5.50 24.05 1.00×10⁻¹⁵ 5.50×10⁻¹⁶ 0.38 0.58 9.57 18.17 1.25×10⁻¹⁵ 6.32×10⁻¹⁶ 0.38 0.12 2.56 23.80 7.84×10⁻¹⁶ 5.44×10⁻¹⁶ 0.26 0.64 9.20 14.47 1.25×10⁻¹⁵ 6.02×10⁻¹⁶ 0.24 0.10 2.09 20.27 7.03×10⁻¹⁶ 4.82×10⁻¹⁶ Mean average (1.1±0.6) ×10-15 (5.8±1.4) ×10-16 (5.8±2.4) ×10-16
35 cyclopentane 1.76 0.72 8.59 13.33 3.50×10⁻¹⁶ 1.80×10⁻¹⁶ 1.41 0.24 3.91 17.98 3.20×10⁻¹⁶ 1.68×10⁻¹⁶ 2.04 0.57 10.66 19.67 2.70×10⁻¹⁶ 1.31×10⁻¹⁶ 1.71 0.19 4.26 23.97 2.60×10⁻¹⁶ 1.38×10⁻¹⁶ 2.04 0.11 2.49 24.61 1.99×10⁻¹⁶ 1.41×10⁻¹⁶ 1.78 0.63 9.39 17.14 2.60×10⁻¹⁶ 1.29×10⁻¹⁶ 1.71 0.10 2.10 23.84 1.96×10⁻¹⁶ 1.41×10⁻¹⁶ Mean average (2.6±1.1) ×10-16 (1.5±0.4) ×10-16 (1.5±0.6) ×10-16 cyclohexane 2.51 0.39 7.73 22.05 2.30×10⁻¹⁶ 1.20×10⁻¹⁶ 1.88 0.45 7.89 19.40 2.35×10⁻¹⁶ 1.34×10⁻¹⁶ 1.82 0.10 2.16 24.09 1.98×10⁻¹⁶ 1.41×10⁻¹⁶ 1.54 0.46 6.85 16.70 2.50×10⁻¹⁶ 1.27×10⁻¹⁶ 1.50 0.11 2.04 20.55 1.92×10⁻¹⁶ 1.39×10⁻¹⁶ 1.98 0.50 10.42 21.08 2.30×10⁻¹⁶ 1.12×10⁻¹⁶ Mean average (2.2±0.5) ×10-16 (1.3±0.3) ×10-16 (1.3±0.4) ×10-16
a The calculated values do not account for the secondary reactions listed in Table 1. Quoted errors
are at the 95% confidence level and are measures of the precision of our measurements. It includes Student t-distribution contribution due to the limited number of measurements.
b The calculated values include accounting for secondary reactions listed in Table 1. Quoted errors
are at the 95% confidence level and are measures of the precision of our measurements. It includes Student t-distribution contribution due to the limited number of measurements.
36
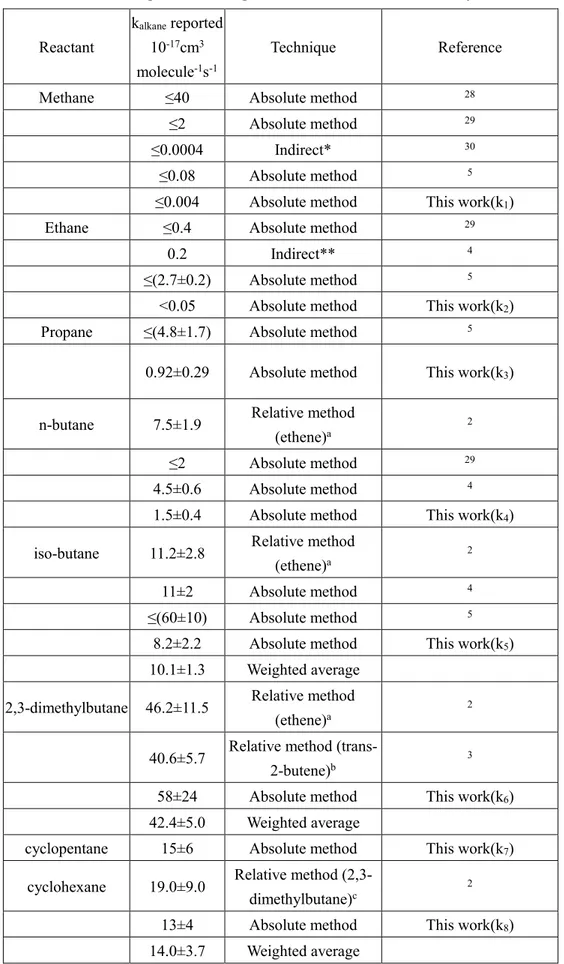
Table 4. Summary of literature values for the rate coefficients of NO3 radicals with
alkanes at room temperature compared with those from this study.
Reactant
kalkane reported
10-17cm3
molecule-1s-1
Technique Reference Methane ≤40 Absolute method 28
≤2 Absolute method 29
≤0.0004 Indirect* 30
≤0.08 Absolute method 5
≤0.004 Absolute method This work(k1)
Ethane ≤0.4 Absolute method 29
0.2 Indirect** 4
≤(2.7±0.2) Absolute method 5
<0.05 Absolute method This work(k2)
Propane ≤(4.8±1.7) Absolute method 5
0.92±0.29 Absolute method This work(k3)
n-butane 7.5±1.9 Relative method (ethene)a
2
≤2 Absolute method 29
4.5±0.6 Absolute method 4
1.5±0.4 Absolute method This work(k4)
iso-butane 11.2±2.8 Relative method
(ethene)a 2
11±2 Absolute method 4
≤(60±10) Absolute method 5
8.2±2.2 Absolute method This work(k5)
10.1±1.3 Weighted average 2,3-dimethylbutane 46.2±11.5 Relative method
(ethene)a 2
40.6±5.7 Relative method
(trans-2-butene)b 3
58±24 Absolute method This work(k6)
42.4±5.0 Weighted average
cyclopentane 15±6 Absolute method This work(k7)
cyclohexane 19.0±9.0 Relative method
(2,3-dimethylbutane)c 2
13±4 Absolute method This work(k8)
37
a The values from the literatures were recalculated by using the rate constant of ethene with NO
3 to
be (2.4± 0.6) × 10−16 cm3 molecule−1 s−1, which was measured here using the absolute method. b The rate constant of trans-2-butene (reference compound) with NO
3 radicals was (3.87 ±0.45)
×10-13cm3 molecule-1s-1.
c The values from the literatures were recalculated by using the rate constant of 2,3-dimethylbutane
with NO3 to be(5.8 ± 2.4) × 10−16 cm3 molecule−1 s−1 obtained in this work.
*Estimated based on the absence of CO and CO2 formation.
** The rate coefficient at room temperature assuming kethane = 2.0 × 10⁻¹⁸ cm3 molecule-1s-1 and via
38
Table 5. Summary of the experimental conditions and rate coefficients for the reactions of NO3 with n-butane-d10 and n-butane-d6 at 298.0±1.5K.
Compound
Initial mixing ratio of reactants in the chamber kalkane1a kalkane2 b kalkane c incl. systematic errors VOC (ppmv) NO3 (ppbv) N2O5 (ppbv) NO2 (ppbv) (cm 3 molecule-1s-1) n-butane -d10 52.43 0.56 13.38 22.55 1.28×10 -17 6.31×10⁻¹⁸ 50.21 0.13 3.75 28.38 1.08×10⁻¹⁷ 6.89×10⁻¹⁸ 30.60 1.07 14.05 14.09 1.62×10⁻¹⁷ 7.98×10⁻¹⁸ 29.03 0.15 3.21 22.86 1.41×10⁻¹⁷ 8.56×10⁻¹⁸ 32.69 0.21 7.52 23.93 1.50×10⁻¹⁷ 8.62×10⁻¹⁸ 31.07 0.14 5.27 25.32 1.31×10⁻¹⁷ 7.78×10⁻¹⁸ Mean average (1.4±0.4) ×10-17 (7.4±2.0) ×10-18 (7.4±2.3) ×10-18 n-butane -d6 11.05 0.08 3.85 28.14 2.12×10 -17 1.81×10⁻¹⁷ 11.00 0.26 11.63 26.47 3.92×10⁻¹⁷ 1.97×10⁻¹⁷ 10.05 0.10 5.21 29.59 3.64×10⁻¹⁷ 2.19×10⁻¹⁷ Mean average (3.2±1.9) ×10-17 (2.0±0.4) ×10-18 (2.0±0.5) ×10-18
a The calculated values without accounting for secondary reactions shown in Table 1. Quoted errors
are at the 95% confidence level and are measures of the precision of our measurements. It includes Student t-distribution contribution due to the limited number of measurements.
b The calculated values accounting for secondary reactions shown in Table 1. Quoted errors are at
the 95% confidence level and are measures of the precision of our measurements. It includes Student t-distribution contribution due to the limited number of measurements.