Working Paper (First Draft AUGUST 2003)
The justification of Napoleon’s statement – if indeed he ever actually made it – that those who form a picture of everything are unfit to command, is to be found as the first defect. A commander who approaches a battle with a picture before him of how such and such a fight went on such and such occasion, will find, two minutes after the forces have joined, that something has gone awry. Then his picture is destroyed. He has nothing in reserve except another individual picture and this too shall not serve him for long. Or it may be that when his first forecast is found to be inapplicable, he has so multifarious and pressing collection of pictures that, equally, he is at a loss what practical adjustments to make. Too great individuality of past reference may be very nearly as embarrassing as no individuality of past reference. To serve adequately the demands of a constantly changing environment, we have not only to pick items out of their general setting, but we must know what parts of them may flow and alter without disturbing their general significance and functions.
F. C. BARTLETT
Adapting Decisions, Optimizing Facts and Predicting Figures
Can Confluence of Concepts, Tools, Technologies and Standards Catalyze Innovation ?
by Shoumen Datta
Massachusetts Institute of Technology
New technologies for supply chain management and flexible manufacturing imply that businesses can perceive imbalances in inventories at an early stage — virtually in real time — and can cut production promptly in response to the developing signs of unintended inventory build up.
ALAN GREENSPAN Testimony to the US Senate Committee on Banking, Housing and Urban Affairs (13 February 2001)
Adapting Decisions, Optimizing Facts and Predicting Figures
Can Confluence of Concepts, Tools, Technologies and Standards Catalyze Innovation ?
by Shoumen Datta
Research Scientist, Engineering Systems Division, School of Engineering and Executive Director, Forum for Supply Chain Innovation Massachusetts Institute of Technology
Contributors: Benson Adams
Executive Deputy Commanding General, Office of the Commanding General, US Army Materiel Command, US Department of Defense Mohua Barari
Professor of Economics, Missouri State University Bob Betts
President and Founder, Mainstreet Applications Mark Dinning
Supply Chain Strategy Group, Dell Corporation Tom Gibbs
Director, Intel Corporation Hui Li
Graduate Student, Department of Aeronautics and Astronautics, Massachusetts Institute of Technology Mike Li
Research Scientist, Department of Civil and Environmental Engineering, Massachusetts Institute of Technology Yichen Lin
Director, Institute for Technology Management, National Tainan University, Taiwan Greg Parlier
Office of Economic Development, University of Alabama and Scientist, Institute for Defense Analysis Micah Samuels
Senior Operations Manager, Amazon.com Santtu Toivonen
Graduate Student, VTT Information Technology, Finland
Disclaimer
This article is over-simplified, incomplete and plagued with digressions. All errors of content or coherence are due to the author. The author apologizes for an unsatisfactory reading experience but hopes that the amalgam of ideas may spark new thinking. This is a mere exploration. In addition to named contributors, the author has freely used several sources of information to ‘connect the dots’ and show how distant disciplines, if coalesced, may offer new directions. The list of references is seriously incomplete. It may be amply clear that the original research is not due to the author. Opinions and comments expressed here are attributable to the author and do not represent the views of MIT as an institution or the contributors or their organizations. For experts, there may be nothing ‘new’ in this article. But, it is the synthesis of ideas from a variety of sources, when presented in confluence, as suggested by the author, may be catalytic in the transformation of some types of decision support systems to adapt or perhaps, with time, to predict. Please e-mail suggestions to Dr. Shoumen Datta, Research Scientist, Engineering Systems Division, School of Engineering and Executive Director, MIT Forum for Supply Chain Innovation, Room 1-179, MIT, Cambridge, MA 02139 (Phone 1.617.452.3211) shoumen@mit.edu
Working Paper (First Draft AUGUST 2003)
CONTENTS
CENTRAL THESIS (Executive Summary) 5
INTRODUCTION 9
TOWARD ADAPTIVE VALUE NETWORKS ? 11
OPERATIONS
RESEARCH
AND
GAME
THEORY 12
Prisoner’s Dilemma 12
Signaling Game 14
ODD-VAR-GARCH
17
GARCH in Forecasting 33
GRID 37
AGENTS 50
Agents versus Equations 54
Agents in Maintenance 59
Agents in Manufacturing 61
Future Agents at Work ? 62
CONTENTS (continued)
AUTOMATIC
IDENTIFICATION
TECHNOLOGIES
70
RFID
Privacy
Issues
–
Where’s
the
Beef
?
77
Ultrawideband: RFID Made Useful 78
Sensor Networks 81
SEMANTIC WEB 84
Semantic Web in Global Security ? 87
Semantic Web in Healthcare ? 88
CONCLUDING COMMENTS 92
ACKNOWLEDGEMENTS 94
NOTES 95
REFERENCES
108
CENTRAL THESIS
(Executive Summary)
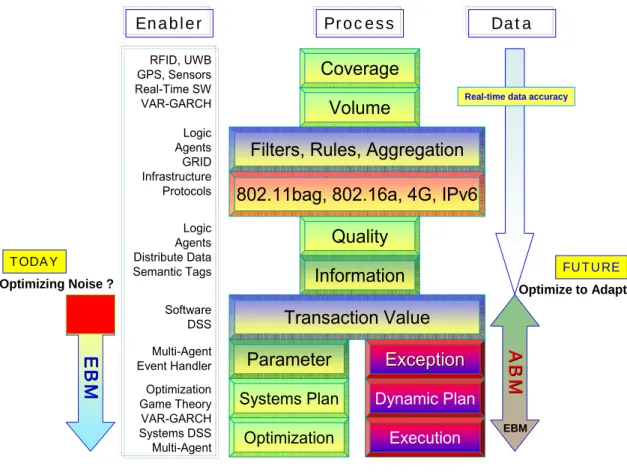
This conceptual article is aimed to provoke a broad spectrum of decision makers who wish to make even better decisions based on deeper insight from process innovation as well as right-time analysis of real-time data. It is not a panacea to rid of all poor decision steps nor can it function without appropriate and in some cases, adequate, help from the ‘enablers’ that we shall discuss. Managing uncertainty is key in decision systems, such as supply chain management or military readiness. We propose a reasonable confluence of existing concepts, tools, technologies and standards that may, collectively, improve adaptability of decision systems to combat uncertainty in such diverse applications as profit optimization, response time in hospitals or military readiness. Improvements must be directed to reduce noise and optimize to adapt. This proposal is illustrated in Figure 1. While thinking about the variety of suggestions in this article, readers are encouraged to consider and evaluate these suggestions in view of their organization from the perspective of [1] efficiency, [2] time compression and [3] transaction cost economics or TCE proposed in 1932 by Ronald Coase (Coase received the 1991 Nobel Prize in Economics for his concept of TCE). Reduction of transaction costs may be the most important value from real-time data, if used at the right-time to execute the right decision.
Coverage
Systems Plan
Volume
Filters, Rules, Aggregation
802.11bag, 802.16a, 4G, IPv6
Quality
Information
Transaction Value
Parameter
Exception
Exception
Optimization
Dynamic Plan
Execution
RFID, UWB GPS, Sensors Real-Time SW VAR-GARCH Logic Agents GRID Infrastructure Protocols Logic Agents Distribute Data Semantic Tags Software DSS Multi-Agent Event Handler Optimization Game Theory VAR-GARCH Systems DSS Multi-AgentA
B
M
A
B
M
E
B
M
E
B
M
Enabler
Process
Data
Optimize to Adapt Optimizing Noise ?
TODAY FUTURE
EBM Real-time data accuracy
In the context of decision systems, we will often refer to supply chain management as an example and discuss how current supply chain practices may change for the better if practitioners (decision makers) adopt and
effectively use new thinking, analytical tools, technologies and emerging standards to reduce uncertainty,
hence, reduce transaction costs. The use of real-time data is crucial for industries (retail, healthcare) and military, yet the past few years (1999-2005) have witnessed a disproportionate focus on data acquisition tools, such as, automatic identification technologies (AIT) aggressively represented by radio frequency identification (RFID). In our opinion, the impact of real-time data on transaction cost economics (the operational process) may be the key parameter for businesses aiming to reduce volatility and/or uncertainty. Use of AIT to identify objects with RFID (UWB) is beneficial when data (systemic, local) is used at the right-time with respect to the operational process and if such processes, then, yield, decisionable information to shape decisions, rapidly, to adapt, if necessary, and to respond through action or preparation. This connectivity that follows from the proposal outlined in Figure 1 is illustrated in Figure 2.
DECISION DECISION PROCESS PROCESS OBJECT OBJECT
OPTIMIZE
INFO
DATA
AGENTS AGENTS Demand “ Pull ” Forecast “ Predict ”Figure 2: Connectivity of real-time data to process (real-time analytics) may improve decisionable information.
Real-time data at the right time (right-time data) may change operational processes and stimulate process innovation. However, real-time data feeds to legacy systems or ERP may not be productive. Adaptability may be enhanced if decision systems can access information at the right time based on real-time data (real-time analytics) which may be acquired from diverse sources (RFID, UWB, sensors, GPS, barcodes). The argument over format (electronic produce code or EPC, universal identifier code or UID) may continue but that should not inhibit the thinking pre-requisite for process innovation to make adequate use of right-time data.
Format agnostic architectures (software) may hold the key to connect real-time data to other software or ERP. In our view, enterprise resource planning (ERP) software packages are unlikely either to handle or analyse the exabytes of real-time data. We echo earlier proposals to explore the use of Agent-based software (ABM or Agent-based models) in combination with traditional equation-based software (EBM or equation-based models) to extract information at the right-time from the emerging abundance of real-time data. Semantic connectivity of this data is as important as sharing of information between entities, to improve decision making.
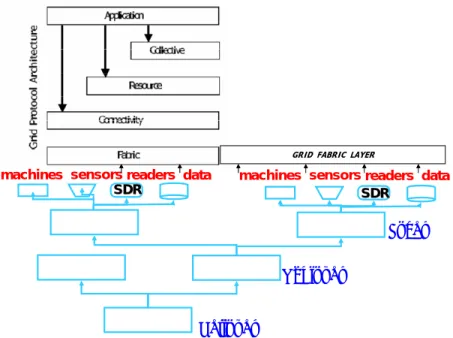
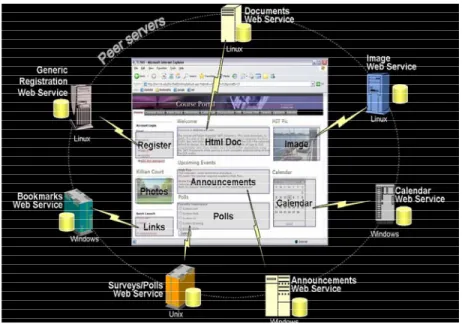
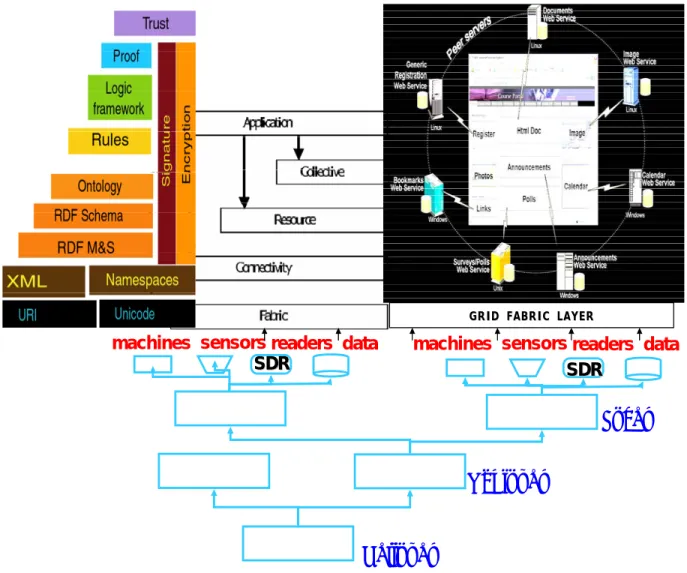
Sharing data (implied by concentric rings, used in a Forrester illustration) or information to improve decisions, then, improves the performance of the entire value network. Interaction between entities demand secure infrastructure and a pervasive open platform for collaboration. We propose such a platform where data interrogators are software defined radio (SDR-SWR) (see note L on page 100) that is ubiquitous, transponder agnostic and part of the civil infrastructure. Access and control of data sharing is regulated and authenticated via the software application layer (delivered over the internet) as would be for an internet appliance (turning on the microwave while driving toward home). The use of semantic software as infrastructure is the next step.
Real Time Data
Streaming Data, Continuous QueriesD2B / RFID / UWB
Object Oriented Hardware Service (Value) Supply ChainSemantic Grid Semantic Grid Web Portal Web Portal
dERP
GRID Internet 0 Internet 0 Internet 1 Internet 1 Internet 2 Internet 2 A G E N T S S E C U R I T YInternet 0 Ubiquitous Infrastructure: Real-Time Data ON/OFF Control
MEMS / NEMS
Intel Motes S er vic e (V alu e) S up ply C ha in From an office in Shinzen, China, you log on a SDR reader in a warehouse in USA, to check if your products arrived on-time. They did. You also get to know that your distributor in Santiago, Chile and retailer in Espoo, Finland also checked the delivery status, moments before you logged on.Bits, Atoms, Decisions
Bits, Atoms, Decisions
Right-Time Analytics
Data Interrogators as Ubiquitous Internet Appliances
In the next 5 years or, more likely, in the next 25-50 years, when we may migrate from adaptive to predictive status of operations, we will require other concepts and tools that may be unknown, today. However, as a contribution to the predictive phase of operations, we propose an idea that draws from the field of time series econometrics. In its simplest form, the proposal explores the possible use of ‘raw’ real-time data (without clustering or classification) to better understand and respond to changes, in near real-time. It may help further reduce risk and uncertainty, perhaps, even, may tame the Bullwhip Effect. Such econometric analytical tools are used in finance (stock price volatility). If econometric tools (such as, GARCH or generalized autoregressive conditional heteroskedasticity, first proposed by Robert Engle) can be modified for use with real-time object-dependent data (ODD), it will not only help predict key supply chain parameters (demand forecast, price) based on input (real-time data) but can also provide a measure of risk, associated with the prediction. In this article, therefore, we will try to coalesce different ideas from a variety of sources to offer a ‘solutions’ approach aimed to reduce uncertainty and improve decisions. This article weaves in ideas from Game Theory, automatic identification technologies (AIT), time series econometrics, Grid computing, Agents, Semantic Web and simulation. It is quite possible that governments, corporations, consulting firms and academics with deep knowledge in one or more fields, may spend the next few decades striving to synthesize one or more models or effective modus operandi to combine these ideas with other emerging concepts, tools, technologies and standards to collectively better understand, analyse, reduce and respond to uncertainty (see Figure 4). Understanding confluence will help explore the paradigm between adaptability and efficiency. Management framework (tools dashboard) to diagnose and determine the dynamic equilibrium (industry specific) may optimize the ‘push-pull’ between adaptability and efficiency (see ‘concluding comments’ on page 92-93).
Concept Development (Pre-Transformation) Unknown Unknown Implementation ( During Transformation) Operations (Post Transformation) Investment Investment Uncertainty Uncertainty Risk Risk
Reduce Risk and Uncertainty: Disentangle Cause and Effect
INTRODUCTION
“At the science museum in Barcelona, I saw an exhibit that beautifully illustrated ‘chaos.’ A nonlinear version of a pendulum was set up so that a visitor could hold the bob and start out in a chosen position with a chosen velocity. One could then watch the subsequent motion, which was also recorded with a pen on a sheet of paper. The visitor was then invited to seize the bob again and try to imitate exactly the previous initial position and velocity. No matter how carefully it was done, the subsequent motion was quite different from what it was the first time. I asked the museum director what the two men were doing who were standing in a corner, watching us. He replied, “Oh, those are two Dutchmen waiting to take away the “chaos.” Apparently, the exhibit was about to be dismantled and taken to Amsterdam. I have wondered ever since whether the services of those two Dutchmen would not be in great demand across the globe, by organizations that wanted their chaos taken away.” (1)
The holy grail of industry is to remove ‘chaos’ from the supply chain to better adapt to demand fluctuations. Managing uncertainty is compounded by the increasing degree of information asymmetry(see note a, page 95) between the supply “chain” or value network(see note b, page 95) partners (designers, suppliers, distributors, retailers, consumers) who have different and often conflicting objectives, that threaten to create barriers on the road to adaptive business networks of the future (2).
Ampex pioneered the video recorder market in 1956. Each unit was priced at $50,000 and the only competitors, RCA and Toshiba, were way behind. Sony, JVC and Matsushita were mere observers. Masaru Ibuka, co-founder of Sony and Yuma Shiraishi, JVC, issued directives for their respective engineers to produce units that would cost $500, a mere 1% of Ampex’s price. In the 1980’s, video recorder sales went from $17 million to $2 billion at Sony, $2 million to $2 billion at JVC, $6 million to $3 billion at Matsushita and $296 million to $480 million at Ampex (3). Adapt or die!
One business objective of suppliers is to secure large volume purchase commitments (with delivery flexibility) from manufacturers. It conflicts with the manufacturer’s objective if rapid response to demand fluctuation leads to excess raw material inventory. The manufacturer must mass produce (to take advantage of economies of scale) yet production runs must adapt to fluctuations even though resource utilization plans were based on demand forecast. Thus, manufacturers may need more or less raw materials and seek flexibility in purchasing raw materials, which conflicts with the supplier’s objective. The manufacturer’s desire to run long production batches are in conflict with the warehouse and distribution centers that aim to reduce storage capacity. The latter increases cost of transportation for all the players (5).
During 2000, supply chain related costs in USA, alone, exceeded $1 trillion (10% of GDP), which is close to the GDP of Russia, more than the GDP of Canada or the combined GDP of the 22 nations who are members of the League of Arab Nations. The combined GDP of all 22 Arab nations, including the oil opulent nations, is less than that of Spain. A mere 10% savings of supply chain costs in USA is nearly equal to the GDP of Ireland (4). Therefore, tools and processes that may reduce supply chain inefficiencies are valuable. Ability to adapt may not depend on technology but may depend on continuous business process innovation in supply chain practice if the management is capable of envisioning use of various, concepts, tools and technologies to reduce (a) inefficiencies, (b) uncertainties and (c) information asymmetry within the value network.
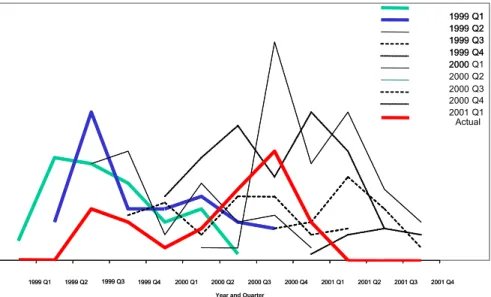
One driver of this transformation (from ‘push’ based supply chain management to ‘pull’ based adaptive value networks) is the potential use of real-time data and information to trigger autonomous decision steps capable of concurrent re-planning and execution. According to Forrester Research, businesses in 2003 generated more than 1 terabyte of data per second (excludes data gathered by automatic identification technologies). Is this equivalent to information? It is unlikely that this data, as is, can be considered as information. The ability to extract intelligence from data to manage information may be the differentiator between companies who will profit from data (such as automatic identification or sensors) versus those who will not. Data that is stored in business systems (ERP) may suffer from problems that reduce the value of their information. ERP systems may also compromise the efficacy of dynamic data if the static systems are unable to respond in near real-time. When such ERP data and/or information sources are used by planners for forecasting or optimization, it leaves room for speculation about the validity of the outcome since the process may have been optimized, or forecast delivered, based on “noise” rather than robust dynamic data, as illustrated in Figure 1. Stemming from poor data quality and information asymmetry between supply chain partners, errors (of optimization, forecasting) accumulate at successive stages of a supply chain and manifests as the Bullwhip Effect (6-9), as illustrated in Figure 5. The Bullwhip Effect based on actual data from the semiconductor industry, is shown in Figure 6.
40 20 0 0 4 8 12 16 20 24 28 32 36 Week O rder s DISTRIBUTOR WHOLESALER FACTORY RETAILER 40 20 0 0 4 8 12 16 20 24 28 32 36 Week O rder s DISTRIBUTOR WHOLESALER FACTORY RETAILER
1999 Q1 1999 Q2 1999 Q3 1999 Q4 2000 Q1 2000 Q2 2000 Q3 2000 Q4 2001 Q1 Actual Q4 Q2 Q3 Q1 1999 1999 1999 1999 2000 1999 Q3 1999 Q3 1999 Q1 1999 Q1 1999 Q21999 Q2 1999 Q41999 Q4 2000 Q12000 Q1 2000 Q22000 Q2 2000 Q32000 Q3 2000 Q42000 Q4 2001 Q12001 Q1 2001 Q22001 Q2 2001 Q32001 Q3 2001 Q42001 Q4
Year and Quarter
Figure 6: The Bullwhip Effect in the semiconductor equipment supply chain shows demand forecast versus actual purchase of equipment (11).
TOWARD ADAPTIVE VALUE NETWORKS ?
Tools and technologies that may be catalytic in taming the Bullwhip Effect (6-9) may also be a driver for supply chains to be more adaptive. The latter assumes that organizations will promote business process innovation aimed at improving interaction between entities (intra- and inter-enterprise information exchange) and target extinction of data silos by investing in semantic connectivity. Organizational ‘culture’ and change management are necessary to stimulate new thinking with respect to confluence of concepts, tools, technologies and standards. Some organizations may appreciate the vision of how to connect objects (atoms) with data (bits) to processes or real-time analytics to extract real-time information for adaptive decisions, that may, in turn, optimize the nature of objects (design, distribution) or characteristics of objects (price, risk) in a value chain.
Tools and Concepts Data Sources
Operations Research Game Theory
Agents (distributed artificial intelligence) Econometric Tools (ODD-VAR-GARCH) Semantic Web
Grid Computing
Tangible User Interfaces
Automatic Identification Technologies (RFID, UWB, GPS, RTLS)
Identification Technologies
(GPRS, Voice, Manual, 2d-Barcode, Barcode) Wireless Protocols (802.11, 802.16)
Sensor Networks (802.15.4 / ZigBee) Software Defined Radio (SDR-SWR)
OPERATIONS RESEARCH AND GAME THEORY
The workhorse of optimization (algorithms) is based on operations research. It is an area of intense research and innumerable sources of information are available (see note c, pages 95-96). Game Theory (GT) was not a “household” name until 1994 when John Nash, and later the movie about him, changed the public perception so much so that generic business journals began touting the virtues of GT (25). For centuries economists have worked on various game-theoretic models but John von Neumann and Oskar Morgenstern (1944) are credited as the fathers of modern Game Theory (12). GT has since enjoyed an explosion of developments, including the concept of equilibrium, games with imperfect information, cooperative games and auctions (13-18, 25). Game theory helps us model, analyze and understand the behavior of multiple self-interested parties who interact for decision making. As such, Game Theory deals with interactive optimization problems. In particular, it is a tool to analyze situations where the parties strive to maximize their (expected) pay-offs while choosing their strategies. Each party’s final pay-off depends on the profile of strategies chosen by all parties. Most business situations can be modeled by a “game” since in any interaction, involving two or more parties, the pay-off of each party depends on the other party’s actions. Thus, the overarching theme in Game Theory is
interactions. In business, each decision maker is a player making a decision or choosing a strategy that will be
impacted by the competitor. We assume that businesses make rational choices to optimize its profits. Do they? A chip manufacturer slashed prices of its desktop and mobile processors days after a similar move by a rival. We’re going to do what it takes to stay competitive on prices, said a representative. The company’s aggressive price-chopping means the company doesn’t want to give up market share gains, even at the cost of losses on the bottom line. (CNet, May 30, 2002)
Why do firms behave this way? In this situation and in some others, firms are caught in what is known in Game Theory as the “Prisoner’s Dilemma” where the rational response may not be the optimal (see note d, page 96). Prisoner’s Dilemma
Alice and Bob are arrested near the scene of a burglary and interrogated separately (19). Each suspect can either confess with a hope of a lighter sentence or refuse to talk (does not confess). The police do not have sufficient information to convict the suspects, unless at least one of them confesses. Each must choose without knowing what the other will do. In other words, each has to choose whether or not to confess and implicate the other. If neither confesses, then both will serve one year on a charge of carrying a concealed weapon. If both confess and implicate each other, both will go to prison for 10 years. However, if one burglar confesses and implicates the other but the other burglar does not confess, then the one who cooperates with the police will go free, while the other burglar will go to prison for 20 years on the maximum charge. The “strategy space” in this case is simple: confess or don't confess (each chooses one of the two strategies). The payoffs (penalties) are the sentences served.
Alice Alice
Confess Does not
Bob Confess 10, 10 0, 20
Bob Does not 20, 0 1, 1
Table 2: Prisoner’s Dilemma: Alice (column) versus Bob (row).
The numbers in each cell show the outcomes for the prisoners when the corresponding pair of strategies are chosen. The number to the left is the payoff to the person who chooses the rows (Bob) while the number to the right is the payoff to the person who chooses the columns (Alice). Thus (reading down the first column) if they both confess, each gets 10 years, but if only Alice confesses and Bob does not, Bob gets 20 and Alice goes free. Therefore, what strategies are "rational" in this game if both of them want to minimize their sentences? Alice might reason, “Two things can happen: Bob can confess or Bob can keep quiet. If Bob confesses, I get 20 years (if I don't confess) and 10 years if I do confess (cooperate), so in that case it is better to confess. On the other hand, if Bob doesn't confess and I don't either, I get a year but in that case, if I confess I can go free. Either way, it is better if I confess. Therefore, I will confess.” But Bob can and presumably will reason in the same way. So they both reason rationally to confess and go to prison for 10 years each. But, if they had acted "irrationally" and did not confess, they each could have gotten off with only a year (19).
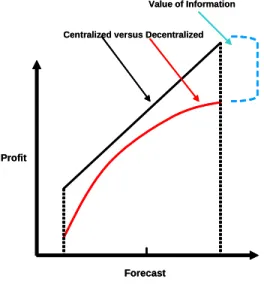
Prisoner’s Dilemma is a simple example of a non-cooperative static game where the players choose strategies simultaneously and are thereafter committed to their chosen strategies (25). The main issue of such games is the existence and uniqueness of Nash equilibrium (NE). NE is the point where no player has incentive to change her strategy since each player has chosen a strategy that maximizes his or her own payoff given the strategies of the other players. A key concept not captured in “Prisoner’s Dilemma” is the repetition of interactions. In business, players know they will be in the ‘game’ for a while. Hence, they may choose to cooperate, especially if they deem that cooperation today may increase the chances of cooperation, or even collaboration, in the future. With repeated actions, companies build a reputation, which influences the actions of others. For example, Intel uses its supplier ranking and rating program, which tracks a supplier’s cost, availability, service, supports responsiveness and quality, to keep its top suppliers on a course for better quality. ‘We reward suppliers who have the best rankings and ratings with more business,’ says Keith Erickson, Director of Purchasing. As an added incentive, Intel occasionally plugs high-quality suppliers in magazine and newspaper advertisements. The company even lets its top performing suppliers publicize their relationship with Intel. In the real world, each party in a supply chain acts entirely on self interest. Thus, individual choices collectively do not lead to an “optimal” outcome for the supply chain. Supply chain profit of a “decentralized” supply chain composed of multiple, independently managed companies, is usually less than the total supply chain profit of the “centralized” version of the same chain where the partner interactions (suppliers, manufacturers, retailers) are managed by a single decision-maker (reduced unknowns) to optimize total supply chain profit. Sharing of information in centralized supply chains reduces inefficiencies that are obvious in decentralized supply chains due to ‘double marginalization’ stemming from self-centered decision making. Thus, optimal profit is higher in centralized supply chains with information sharing.
Forecast Centralized versus Decentralized
Profit
Value of Information
Forecast Centralized versus Decentralized
Profit
Value of Information
Figure 7: Value of Information Sharing – Increase in Total Supply Chain Profit and Performance (20)
One strategy for reducing inefficiencies in decentralized supply chain is ‘vertical integration’ where a company owns every part of its supply chain. A good example of vertical integration was Ford Motor Company. In today’s economy, customer demand and preferences change rapidly. Companies that focus on core competencies are likely to be nimble to stay ahead of competition. Hence, we see a trend towards “virtual integration” where supply chains are composed of independently managed but tightly partnered companies. Information sharing based strategies, such as, vendor managed inventory (VMI) are used by some (Dell, P&G, Wal*Mart) industries. Despite progress in information sharing, ubiquitous knowledge about players and decisions or payoffs is rarely a reality in real world supply chains. It is common that one firm may have a better demand forecast than another or a firm may possess superior information regarding its own costs and operating procedures. If a firm knows that another firm may have better information, it may choose actions that take this into account. Game Theory provides tools to study cases with information asymmetry with increasing analytical complexity. To illustrate the ideas relevant to this article, we focus on one particular type of game, a Signaling Game (20).
Signaling Game
In its simplest form, a Signaling Game has two players, one of which has better information than the other. The player with the better information makes the first move. For example, a supplier must build capacity for a key component for a manufacturer’s product. The manufacturer has a better demand forecast than the supplier. In an ideal world, the manufacturer may share her demand forecast with the supplier so that the supplier may build the appropriate capacity. But the manufacturer benefits from a larger capacity at the supplier in case of higher demand. Hence, the manufacturer has an incentive to inflate her forecast. However, the supplier bears the cost of building capacity if it believes the manufacturer’s (inflated) forecast. The manufacturer hopes the supplier will believe the (inflated) forecast and build capacity. Fortunately, the supplier is aware of the manufacturer’s “game” to inflate (distort) forecast. What move (signal) from the manufacturer may induce the supplier to believe that the manufacturer’s forecast is indeed credible?
S announces:
(w
a,w)
Time
є realized
S updates belief about
ξ
and builds capacity K
M places advance
order y at price w
aM orders (D-y)
+at price w
Signaling
Game
ε
ξ
µ
+
+
=
D
Where,
S announces:
(w
a,w)
Time
є realized
S updates belief about
ξ
and builds capacity K
M places advance
order y at price w
aM orders (D-y)
+at price w
Signaling
Game
ε
ξ
µ
+
+
=
D
=
µ
+
ξ
+
ε
D
Where,
Figure 8: Signaling Game (20)
In this example, Demand (D) is represented as a sum of three forecasts. A market forecast mu (µ) is predicted by analysts. The manufacturer has sources and/or experience to derive private forecast information xi (ξ) which is not known to the supplier in a decentralized system (information asymmetry). However, the supplier can categorize the manufacturer into certain “types” based on prior actions or credibility of the manufacturer. Thus, the supplier updates its “belief” about the “type” of the manufacturer’s forecast information and may select a value of ξ assumed to be represented by a normal distribution. This introduces a random (stochastic) variable. Market uncertainty is given by epsilon (ε) and neither the manufacturer nor the supplier can control its value. This introduces another random variable (error term) which is also assumed to belong to a normal distribution.
These assumptions introduces variability, that are not rigorously quantified, hence, the assumption that they belong to a function given by a normal distribution. Such errors successively accumulate from each stage of multi-stage supply chains (see Figure 9) and collectively contribute to the Bullwhip Effect. We shall advance a proposal, in a later section, to explore how these errors may be reduced through the use of real-time data in analytical tools that combine statistical methods with advances in time series econometrics (21, 26, 27). The signaling game (20), shown above, commences with a price announcement by the supplier: w (regular) and wa (advance purchase) price. The manufacturer creates a demand forecast and based on the strength of forecast, reacts to the supplier’s price package by placing an advanced order (y) to be purchased at wa. The volume of y sends a “signal” to the supplier. The “signal” is used to update the supplier’s “belief” about the credibility of manufacturer’s forecast (D). Based on this, the supplier can determine how much capacity to build (K) to optimize her profit (inventory risk). Moving down the timeline, the market uncertainty is realized and using this value of ε the manufacturer updates its forecast. The volume D-y is ordered by the manufacturer from the supplier at a higher price (w). While optimization based on signaling may increase profits for manufacturer and supplier, it remains vulnerable to errors in the value chosen for the variables ξ and ε.
– Stage i places order q
ito stage i+1.
– L
iis lead time between stage i and i+1.
Retailer
Stage 1
Manufacturer
Stage 2
Supplier
Stage 3
q
o=D
q
1q
2L
1L
2Figure 9: Can real-time data impact the traditional supply chain (5) at the right time?
The signaling game suggests that to reduce uncertainties, improving the values of the variables ξ and ε may be one right step forward. A vast array of research and optimization tools is already aimed at tackling these values or the ability to obtain dependable values. However, persistence of wide fluctuations in supply chains makes it unclear whether existing tools are adequate to stem uncertainty. The latter, in part, is one reason why we propose the use of real-time data to reduce errors, for example, for values of the variables ξ and ε. In addition, developments and techniques from AI may be helpful (see pages 68-69 and see notes M on page 104).
In 1959, GE recruited the reputable consulting firm of Arthur D. Little Inc. in Boston to conduct a study to determine whether there was a market for portable TV sets that GE could now build using solid state transistors. Several months later in 1959, after spending a staggering amount of money (millions) in focus groups and discussions, Arthur D. Little Inc. sent their analysis to GE suggesting that they do not believe there is any market for such TV sets. GE management pushed aside the project proposed by its engineers. Just before Christmas in 1959, Sony introduced a small B&W television in the US market. Sony sold more than 4 million television sets within months (3).
“In contrast, at highly successful firms such as McKinsey and Company […] Hundreds of new MBAs join the firm every year and almost as many leave. But the company is able to crank out high-quality work year after year because its core capabilities are rooted in its processes and values rather than in its resources (vision). I sense, however, that these capabilities of McKinsey also constitute its disabilities. The rigorously analytical, data-driven processes that help it create value for its clients in existing, relatively stable markets render it much less capable in technology markets.” (22).
ODD-VAR-GARCH: An Analytical Tool to Better Use Real-Time Data?
Forecasts made by electronics companies are often inflated. Now, Solectron has $4.7 billion in inventory.
Business Week, March 19, 2001
Cisco is stuck with chips, circuit boards and other components -- $2.5 billion worth of inventory that it believes it won't be able to sell within the next year.
San Jose Mercury News, April 27, 2001
Forecasts influence decisions and inaccurate forecasts can debilitate even the savviest corporations. Current state-of-the-art forecasting tools may be woefully inadequate and appears to be plagued by:
- poor data quality due to data acquisition errors or system-driven inaccuracies - aggregated data punctuated by long intervals that dwell in static repositories - restricted availability and/or visibility for planners or decision makers - weak or inappropriate stochastic algorithms (poor data flow model)
- incomplete computing architectures to handle data or provide real-time decision support
6 5 % o f S K U s
a re in a c c u ra te
A b s o lu te E rro r (u n its )
% o f S K U 3 5 % 2 2 % 1 0 % 6 % 4 % 3 % 3 % 2 % 2 % 1 % 1 % 9 % 1 % 0 % 5 % 1 0 % 1 5 % 2 0 % 2 5 % 3 0 % 3 5 % 4 0 % 0 1 2 3 4 5 6 7 8 9 1 0 1 1 -5 0 5 1 -1 0 0 1 01 -2 0 0 2 0 1 -4 0 0 40 1 +Forecasting accuracy, then, is a function of data accuracy as well as the fit of mathematical models to business processes. Issues regarding data quality, granularity and stage-specific visibility may be addressed, albeit in part, by use of improved data acquisition through automatic identification technologies (RFID, ultrawideband tags, GPS, sensors). Whether or not the abundance of data is acquired and shared depends on AIT infrastructure investments to acquire the data and business strategy decisions to share the data between value network partners. Such practices, if materialized, shall bolster collaborative planning, forecasting and replenishment (CPFR), for example. Data inaccuracies and infrequent data availability may have shaped current business process models that represent and/or analyze seemingly complex interactions by stripping away variables (using constants, assuming normal distribution) in a ‘reductionism’ approach. Perhaps most planners use weighted mean of historical data or classical linear regression models or simple smoothing technique for forecasting (24). In some corporations analytical teams may be reluctant even to use standard deviation and/or variance of historical data.
Even with better statistical tools that may be used in mission critical operations, such as supply chain management in the military establishment, the inadequacies stem from disconnect between operations and inventory. The spare parts inventory may not be coordinated with the process of demand and consumption of spare parts. Because the approved items, overall, are stocked at a certain level, it follows, that the metrics or key performance indicators (KPI) that monitor the inventory situation (divorced from operation) may not reflect the operational discontinuity. In reality, the operation (repairs) suffers since some of the spare parts or unique parts required to complete the job may not be available, as revealed from data summarized in Figure 11 (also, see Figure 27 on page 58).
Forecasting inventory levels or requirements to match the goal, common sense dictates, may benefit from better cross-sectional data visibility as well as integration with demand (field operations) and consumption (repairs). In an earlier book chapter (25) the author referred to the use of Agents in the repair process at Warner-Robbins Air Force base (44). Process-defining Agent based models (42a, 42b, 43) in conjunction with real-time data from AIT, if incorporated with the tools to be described in this section, may be begin to address and resolve some of the operational discrepancies that, in this case, affects readiness. To attain such readiness levels and respond to challenges in near real time, key decision makers may wish to implement the vision, albeit in sequential steps, to bring about the confluence of semantic connectivity to data, process and decisions. Tools discussed here and elsewhere are essential but use of any one tool (AIT-RFID) is only a means to an end, hence, a part of the vision. AIT (especially RFID) proponents emphasize that automated data capture will eliminate a significant amount of errors (Figure 10). Improved data accuracy may be useful if data accuracy can be successfully married to process innovation to improve decisions. If Procter & Gamble suffers from a 10% out-of-stock (OOS) situation for its popular brands, the company’s forecasting measures must be crying out for new blood. Similarly, if the military finds that lack of spare parts prevents it from certifying “mission capable status” for its aviation equipment, surely the element of ‘readiness’ is compromised due to mismatch between inventory and use of the unique spare parts.
Larry Kellam, director (…) at P&G, notes that reducing out-of-stock products by 10% to 20% could boost its (P&G) sales from $400 million to $1.2 billion.
78.6% 12.7% 3.1% 2.0% 1.7% 0.9% 0.8% 0.2% 0.1% 0.1% 0.0% 10.0% 20.0% 30.0% 40.0% 50.0% 60.0% 70.0% 80.0% <100 100-500 500-1K 1K-2K 2K-5K 5K-10K 10K-50K 100K-200K 50K-100K >200K $ Cost / Part Requisitions 45.7% is less than $10 24.4% is between $10 - $50 8.5% is between $50 - $100
Cost of Part vs High Priority Requisitions (June 1995 – February 1996)
Source: US DoD Per cent NM C Suppl y Cost
Low Value Parts Still Causing Systems to be NMC (Not Mission Capable)(Nov 2000 – Oct 2001) Source: US DoD
27.2 9.2 13.1 2.7 2.9 0.6 0.6 0.1
5
10
15
20
25
30
35
40
45
<10 <50 <100 <500 <1K <5K <10K <50K >50K 43.6% is less than $10 80% of items <$100Common items increase averages (metrics) but unique items are critical for readiness.
70 80 90 C-5 C-17 H-53 J-52 F404
Percent Supply Availability
Unique Common
Source: US DoD
100
In parallel, with the surge of interest in AIT (RFID), a similar, but until recently, unrelated, level of interest has been emerging in Grid or utility computing architectures that allows flexible access to virtually any distributed device that can be connected to the internet. Grid was initially developed in the 1990’s are now being extended to embrace the use of semantic language in its architecture (middleware). These approaches may usher in a new paradigm for computing, storage and communications to enable a more productive way to deal with business process, data handling, decision support and execution. We will briefly discuss Grid computing in the next section. This new paradigm may help implement some of the tools we are proposing for improved planning and forecasting.
Within the scope of process innovation, the component of forecasting (prediction), in our opinion, has much room for improvement. To utilize such improvements, organizations, first, must assimilate the vision. Second, if they wish to remain competitive, equip themselves to invest, explore, pilot and deploy advanced forecasting tools. It is well nigh impossible to deploy the existing financial econometric tools, as is, in the context of situations we are discussing in this article (supply chain, manufacturing, military readiness). The economic or financial models are significantly different from the models that these decision systems may require. Hence, a great opportunity is at hand to explore statistical and econometrics tools that may be modified for applications relevant to business scenarios soon to be faced with ultra high volume data. Surge in data may soon demand expression in terms of exabytes per second (1 exabyte = 1018 bytes or 109 gigabytes). To extract value from the accurate high volume
data, it may be shared through advances in open Grid services architecture (Grid computing will be briefly discussed later). In the medium term, by channeling data through appropriate middleware to feed pioneering forecasting tools, we may catapult the ROI from AIT (ROI from RFID) and make profitability gains replicable across industries and sustainable over several economic cycles. In the long term, expect semantic connectivity of data. This proposal was outlined (26) as an interest-provoking point and also noted in the author’s book chapter (25). Since its initial introduction, we decided to change the model name (abbreviation) to ODD-VAR-GARCH to reflect Object Data Dependent - Vector AutoRegression - Generalized AutoRegressive Conditional Heteroskedasticity. ROI from AIT may be only partially realized unless practitioners invest in deeper thinking about the processes that are likely to evolve. Process innovation between entities is key as well as data (semantics) availability maturing to visibility and transparency between stages in the supply chain, then, extending to the extra-enterprise or value network. The value of this data may be considerably improved by using analytical tools that combine advances in statistical and econometric modeling techniques. Thus far, to the best of our limited knowledge, the combined techniques, that we will propose, are not in use by supply chain planners or decision system analysts. It is quite possible that advanced corporations or organizations (military establishments) may have considered using these techniques but could not substantiate the models due to fewer than necessary reliable data points. Data ‘points’ may no longer be a limiting factor if AIP adoption increases. Thus, only now, the field may be gradually maturing to entertain the possibility of exploring time series and econometric tools in supply chain and decision systems. Accurate model building that can be dynamically altered (hence, responsive and adaptive) is at the heart of this discussion. Evaluation, simulation and refinement of these process models for forecasting depend on very high volume accurate real-time data on the critical variable. For example, when forecasting sales or demand, the critical variable in the equation is ‘sales’ or ‘demand’ data. Time series models can relate ‘current’ values of a critical variable to its past (lagged) values and to the values of current and past disturbances or random error terms (rather than the assumptions discussed in the signaling game section).
Time series models, in contrast to econometrics models, may not be limited by its economic roots (hence, the scope to modify the tool, for the purposes of forecasting, in other areas). To explore model building for our purposes, let us re-visit the signaling game (20) and review what determines the market demand forecast (D): D = µ + ξ + ε
where,
µ = market forecast
ξ = manufacturers information
ε = market uncertainty
To determine µ, planners and analysts may use one or more statistical tools (24) that may include:
[1] smoothing techniques (see note e, page 96) [2] classic linear regression models (CLRM) [3] autoregression (AR)
[4] moving averages (MA) [5] ARMA (AR+MA)
[6] vector autoregression (VAR)
Classic linear regression models (CLRM) have been around for a century and widely used for a variety of purposes including some supply chain management software. CLRM may be expressed as an equation for a straight line:
y
t= β
0+ β
1x
t+ ε
t(0)
where,y = dependent variable of interest to be modeled for forecast (for example, sales of a product, say aspirin) t = time period (frequency of observation, for example, t-1 may indicate prior week 1, t-2 Æ week 2) β = coefficients to be estimated (based on values of y and x)
x = explanatory variable that is used to ‘explain’ variations in the dependent variable y (for example, low sales of aspirin may be explained by low in-store inventory {x} of aspirin)
ε = random (stochastic) error term
This simple technique can model multiple explanatory variables, that is, multiple x’s, since the variation in y, say, sales of aspirin, is dependent on multiple parameters, such as inventory (x1), price (x2), expiration date (x3). The
choice of x’s (number of explanatory variables) will drive the validity and accuracy of the model. Therefore, x’s may be based on underlying economic principles (theoretical) and/or business logic (practical underpinnings). However, no matter how many x’s are included, there may be an inherent randomness that cannot be explained by the model. Thus, the random error term (ε) is included in the equation (admission of the fact that the dependent variable (y) cannot be modeled perfectly). To solve for y, a bold assumption is made that ε is characterized by a
normal distribution with a mean = 0 and variance = σ2 for all time periods (t):
The objective of CLRM is to estimate the parameters
(β
0,β
1)
of the model (from data on y and x), depending onthe sample of observations on y and x. Therefore, there can be multiple sets of (β0,β1) that can, when plotted,
produce straight lines with varying slopes (gradient). This statistical procedure introduces two sources of error. First, taking sample data from a large number of observations inherits sampling errors. To eliminate this error, can we use raw AIT data instead of sample data? One reason for use of sample data (as practiced by the US Bureau of Census) may stem from lack of granular data acquisition tools. Another reason may be a lack of computing power. With low cost yet powerful microprocessors and the emergence of Grid computing, we may be increasingly better prepared to process exabytes of raw data. Second, given the multiple sets of (β0,β1) that may be estimated, the
objective of CLRM is to choose that pair of (β0,β1) which minimizes the sum of squared residuals (e12, e22, … ,en2):
n ∑et2
t=1
where, et is the random error term for the sample and εt represents the random error term of the ‘population’
data. This technique is known as the principle of ordinary least squares (OLS). The sole objective of OLS is to minimize forecast errors by selecting the most suitable (β0,β1), thus ignoring the volatility of the sample.
The attractiveness of CLRM based forecasting stems from the fact that we can model cross variable linkages. The regression model is an explicit multi-variate model. Hence, forecasts are made not only on the basis of the variable’s own historical data (for example, sales of aspirin, y, the dependent variable) but also takes into account the historical data of other related and relevant explanatory variables, x1 through xK, that is, any number of x’s
(inventory (x1), price (x2), expiration date (x3)). In our example, the sales of a specific SKU, Bayer’s Aspirin, may
be modeled by the analysts of a retail outlet not only based on the history of its own inventory (x1), price (x2) and
expiration date (x3) but also taking into account the historical data with respect to inventory (x4), price (x5) and
expiration date (x6) of its competitor products (x4t, x4t-1, x4t-2, … , x4t-n) sold in the same store.
To what extent is CLRM used by practitioners, today? Even this simplistic CLRM model, if combined with real-time (RFID) object-dependent data, may represent a step forward both in terms of accuracy of forecasting as well as determining the ROI from RFID. Given the emerging availability and abundance of real-time high volume data, we will extend this simple CLRM model to take advantage of the recent developments in time series techniques that has garnered a Nobel Prize in 2003 (30). It is this (combination or confluence of) idea that was first noted in the author’s book chapter (25). It draws on ARCH (31) and GARCH models (32) hence, ODD-VAR-GARCH.
ODD-VAR-GARCH will require very high volumes of data and may deliver forecasts (or predictions) with far greater accuracy than any one of the individual components (CLRM, VAR, GARCH), separately. Abundance of data (RFID, UWB, RTLS, GPS, sensors) makes it possible to use ODD-VAR-GARCH. In addition to forecasts or predictions, it may be worth exploring in the future, how to predict the risk associated with the forecast (value at risk measure). Because these recent developments in time series techniques (ARCH) also offers a measure of risk (for financial analysis), it may be possible to use these tools to deliver a similar measure associated with forecasts for supply chain scenarios. For example, Pirelli may use these tools to predict how many tires it must manufacture for 2005. With this forecast at hand, it may apply to Bank of America for a loan to invest in production. Bank of America may wish to estimate the risk or validity of this forecast (number of tires) based on which the Bank may choose to modify the amount of the loan or interest on the loan or both or may even reject the loan application.
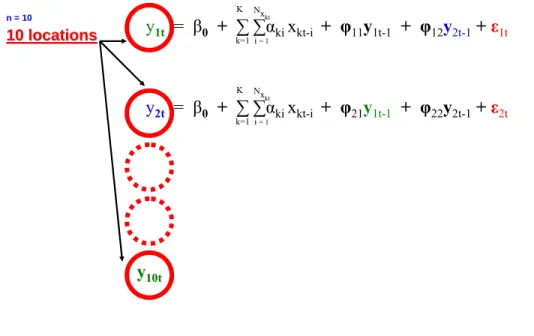
The yet untested concept of ODD-VAR-GARCH requires a few sequential stepwise progressions to combine CLRM with time series techniques. Let us develop the concept by starting with a basic CLRM equation:
y
t= β
0+ β
1x
1t+ β
2x
2t+ … + β
Kx
Kt+ ε
t(1)
The model given by equation 1 may be used to carry out ‘what if’ analysis. For example, what may happen to sales (y, dependent variable) of aspirin in the retail store if the in-store inventory of non-aspirin products were increased by 10%? The usefulness of this “what if” analysis is conditional upon assumptions we make about x’s in the model. The effect of change in only one explanatory variable (x1, … , xK) may be analysed at a time (all else
remains constant). Therefore, in building this model, the choice of x is a process decision based on the model builder’s knowledge about the operation or business.
Because process dependency is critical for success and accuracy of predictions based on such models, it follows, that, feeding real-time automatic identification data to old process models may yield only minor benefits, if at all. Thus, focusing on the technology (RFID) to acquire the high volume accurate data may offer little value because
use of the data requires far greater insight and process innovation. Since the latter is more involved and difficult,
the market digresses to focus on the technology rather than use of the technology as a tool to improve decisions. Processes are reflected in the type of models given by equation 1. A task for process innovation is to explore how these x’s (or their relevance) may change with real-time data to make the model adaptable enough to respond in near real-time. In the past, when supply chain tools were created for forecasting (assuming they were multi-variate models) they may have used explanatory variables (x’s) for which (some) data was available (volume and quality of data remains questionable). Old process models may have excluded some highly relevant explanatory variables simply due to lack of data or data visibility with respect to stage-specificity (pallets in the distributor’s warehouse versus in-transit). With the deployment of automatic identification technologies, there will be a surge of stage-specific data (work-in-progress, transit, theft) that presents a great opportunity for effective use of data. The opportunity in the area of forecasting and prediction may be closely linked to our ability to use this real-time data to adapt and respond in a manner that was not possible, in the past. To harvest data-dependent opportunities we must use the data in models that includes variables of the processes that may have surfaced, brimming with data. In other words, we may need to add new x’s that now offer data and eliminate other x’s that may have been made redundant by the abundance of AIT data. Process innovation, reflected in the choice of x’s in new CLRM models should better define the operation and maximize the effective use of AIT data.
Note that data that may not be ‘connected’ to reflect the entire operational scenario (above). The latter may be made possible with the increasing diffusion of the semantic web. In future, improved CLRM models and accurate stage-specific RFID data may be monitored by Agents and shared through OGSA or open Grid services architecture (28). Applications in an OGSA environment may simulate scenarios based on observed data. These operations can take advantage of Grid computing to access (via semantic web services portal) applications hosted on a remote computer yet run the computation at the local site by harvesting unused processing power in its local domain (for example, powerful Pentium microprocessors in point-of-sale terminals). Thus, local data can help local as well as global optimization necessary to keep pace with the global economy.
Let us re-visit the ‘what if’ scenario. What happens to sales (y, dependent variable) of aspirin in the retail store if the in-store inventory of non-aspirin products increased by 10%? Are we playing a ‘what if’ game or is 10% increase a real-world scenario? The retail outlet surely knows what has happened in the past. This segues to the next phase (in the development of ODD-VAR-GARCH) where it is not necessary to assume values of the explanatory variable x (in this case 10% increase in inventory of non-aspirin products) to forecast y (the dependent variable). We start by forecasting the values of x’s to obtain an unconditional forecast for y. Instead of inserting arbitrary values for future x’s (such as, 10%), we use forecasted values based on historical data. To forecast x, we fit an univariate model to x where we use past (lagged) values of x to forecast x, as given in equation 2 (for x1t, …, xKt):
x
1t= α
01+ α
11x
1t-1+ α
12x
1t-2+ ... + α
1Nx
1t-N+ u
x
1tx
1tx
1tx
Kt= α
01+ α
11x
kt-1+ α
12x
kt-2+ ... + α
1Nx
1t-N+ u
x
ktx
ktx
kt2
2
4
4
3
3
y
t
= β
0
+ ∑α
1i
x
1t-i
+...+ ∑α
Ki
x
Kt-i
+ ε
t
N
x
1i
=1
N
x
kti
=1
y
t
= β
0
+ ∑ ∑α
ki
x
kt-i
+ ε
t
K N
x
ktk=1 i = 1
where,x1t = variable x1 at time t (for example, we used x1 for inventory thus x1t is inventory at time t)
xKt = variable xKat time t (up to K number of x’s)
x1t-1 = value of x1 at time t-1 (referred to as the laggedvalue by one period)
N = period up to which the lagged values of x1t will be used in the equation
U = random error term
In equation 2, α11, α12 are coefficients of x1t-1, x1t-2 and are referred to as lagged weights. An important distinction
is that instead of arbitrarily assigning weights, these coefficients are estimated using OLS technique. The error term in equation 2 represented by u is analogous to ε in equation 1. Depending on the number of x’s (x1, … ,xK)
that adequately represents the process being modeled in equation 1, there will be K number of equations (of the type equation 2) that must be estimated to forecast the x’s (x1, … ,xK) which will then be used to obtain an
unconditional forecast of y. Thus, to simplify the task, we can estimate all the parameters (α, β) simultaneously by re-writing equation 1, the basic CLRM equation, as equation 3 or its shortened version, as in equation 4 (above).
Equation 4 is another step toward forecasting the dependent variable (y) with greater accuracy using forecasts of x’s based on historical data of x’s (lagged values). But no sooner, we have moved a step ahead, it is clear that equation 4 ignores the impact on y of the past values of y itself (lagged values). Consequently, a preferable model will include not only lagged values of x but also lagged values of y, as shown in equation 5 (below).
y
t
=
β
0
+ ∑φ
j
y
t-j
+ ∑ ∑α
ki
x
kt-i
+ ε
t
N
y
j= 1
K N
x
kt
k=1 i = 1
5
5
Moving from conditional to unconditional forecasts of y using CLRM, it is evident that we are vastly increasing the number of parameters to be estimated. The latter necessitates high volume data. Precision in forecasting, in turn, demands accurate high volume data. AIT enables the acquisition of accurate high volume data. In equation 1, we estimate K parameters (β1, … , βK) excluding (β0). In equation 2, we estimate n parameters (α1, … , αN) excluding
the intercept (α0) for each of the K number of x’s (x1, … , xK). In equation 5 we estimate j parameters for lagged
values of yt-j (φ1, … , φj) in addition to all the parameters for equation 2. If we set K=5 (only 5 explanatory
variables, the x’s), N=10 (number of lagged values to forecast the x’s) and j=10 (number of lagged values of yt),
then, we have increased the number of parameters to be estimated from 5 in equation 1 to 50 in equation 4 to 50+10 = 60 in equation 5.
What is N? In the example above, it is the number of lagged values for each of the x’s in the model. If N = 10, it could refer to daily data from past 10 days (N=1 indicates data from day 1). Is that sufficient? Let us assume that supply chain planners currently choose to use data from the immediate past 100 days. Then, using the traditional model, N = 100 days. With AIT, the granularity of data, say, from RFID, is expected to be far greater than using daily aggregates. Let us assume that real-time data is available in hourly buckets. Now, if we consider N = 100, we have used 100 hours or only 5 days worth of ‘historical’ data (assuming 20 hours as the ‘active’ handling time per day). If planners choose hourly aggregates of RFID data from the immediate past 50 days, then, N=1000. Similarly, let us say j=1000 and still keep K=5. Now, equation 5 now requires 6,000 parameters to be estimated!
Since ‘historical’ data is an agonizing cliché for products that have a tryst with obsolescence (high ‘clockspeed’ industries (58), such as mobile phones, digital cameras, laptop computers), the availability of high volume data may unleash analytical opportunities inconceivable in the past. It may be one more reason why the return on investment (ROI) in AIT (such as, RFID) may hold promise for industries that must meet immediate demand from customers (retail, consumer goods) or where the product lifecycle is short (electronics). For a product with a sales life cycle of 200 days (about 6 months), if we use the example of N=100 (past 100 days of data), it may be difficult to ‘change course’ and respond or adapt (based on forecasts or predictions after half the life cycle is over). The granularity of RFID type high volume accurate data, if available, may be modeled with N=100 where it is lagged every hour and the volume of data (item level) may be sufficient for reliable forecasts. For example, if hourly data is used and N=100, then predictive analysis can be made available within 5 days from launch of a product with 195 days or 97.5% of its sales life cycle still intact (if necessary to adapt and respond). Compare that to data flow on a daily basis. For the same number of parameters to be estimated, that is, N=100, suitable forecasts may be available only after 100 days or with 50% of the product sales life cycle still remaining. Thus, use of high volume real-time data in these models makes it not only possible but also feasible for sales, marketing, production or distribution to adapt. Changes can be initiated, based on forecasts, earlier in the (sales) life cycle of the product. Increase in data volume made possible, by AIT, therefore, is necessary if reliability and accuracy of estimation is desired from the model given by equation 5 to forecast y. This “necessity” is rooted in the concept of ‘degrees of freedom’ which, by definition, is the excess of number of observations or data (EPC or GTIN product code) over the number of parameters to be estimated. Hence, the greater the volume of data, the higher is the degree of freedom. The precision of the forecast or prediction is directly proportional to the degrees of freedom.
Small and medium enterprises may vociferously complain that estimating 6,000 parameters or more (as we shall soon see) for each SKU is not feasible no matter how precise the outcome (forecast) may be. Such complaints may fade away when the power of Grid computing bears on the issue. In our opinion, the ‘invention’ of fire by our ancestors, Homo australopithecus may be analogous to what the Grid may be for precision forecasting. Estimating thousands or even millions of parameters to dynamically adapt and respond to changes and challenges may be a reality sooner that one might expect, due to semantic Grid services (discussed briefly, later). It is worth repeating that high throughput computation can be made feasible by harvesting unused processing power within many domains via the Grid. Thus, local autonomy or decision making is preserved, yet the system is not limited to local optimization. Decision makers and supply chain planners at subsequent higher echelons (local, regional, national, international) can harvest the local data or optimized data in near real-time to update or adapt the global coordinates and take advantage of economies of scale or risk pooling strategies. Thus, concurrent planning and execution through local and global optimization is a feasible scenario that relies on the confluence of real-time data (RFID), analytical models (for example, equation 5) and Grid computing. In a later section, we will discuss how Agents may occupy a prominent role in this confluence and continue to point out the need for semantic web.
To drive precision to the next (logical) step, equation 5 may be expanded to include the important real-world observations regarding trend, seasonality and other cyclical dynamics. Businesses struggle to uncover ‘trends’ and once found, they are avidly pursued. Because of the dominant role of trends and seasonality in some industries (and promotions linked to such events), the principle of cointegration (29) and its application in decision systems (other than econometrics) deserves a deeper analysis. (In a future version of this article we will explore, in further details, co-integration as well as risk with respect to value at risk (VaR) measure and use of extreme value theory.)