HAL Id: hal-03053697
https://hal.archives-ouvertes.fr/hal-03053697
Submitted on 11 Dec 2020
HAL is a multi-disciplinary open access
archive for the deposit and dissemination of
sci-entific research documents, whether they are
pub-lished or not. The documents may come from
teaching and research institutions in France or
abroad, or from public or private research centers.
L’archive ouverte pluridisciplinaire HAL, est
destinée au dépôt et à la diffusion de documents
scientifiques de niveau recherche, publiés ou non,
émanant des établissements d’enseignement et de
recherche français ou étrangers, des laboratoires
publics ou privés.
selection in the evolution of chimpanzee subspecies
Matthew Mitchell, Sabrina Locatelli, Lora Ghobrial, Amy Pokempner, Paul
Sesink Clee, Ekwoge Abwe, Aaron Nicholas, Louis Nkembi, Nicola Anthony,
Bethan Morgan, et al.
To cite this version:
Matthew Mitchell, Sabrina Locatelli, Lora Ghobrial, Amy Pokempner, Paul Sesink Clee, et al.. The
population genetics of wild chimpanzees in Cameroon and Nigeria suggests a positive role for selection
in the evolution of chimpanzee subspecies. BMC Evolutionary Biology, BioMed Central, 2015, 15,
�10.1186/s12862-014-0276-y�. �hal-03053697�
R ES EAR CH A R T I C LE
Open Access
The population genetics of wild chimpanzees in
Cameroon and Nigeria suggests a positive role
for selection in the evolution of chimpanzee
subspecies
Matthew W Mitchell
1,2†, Sabrina Locatelli
2,3†, Lora Ghobrial
2,4, Amy A Pokempner
2,5, Paul R Sesink Clee
1,2,
Ekwoge E Abwe
6,7, Aaron Nicholas
8, Louis Nkembi
9, Nicola M Anthony
10, Bethan J Morgan
6,7,11, Roger Fotso
12,
Martine Peeters
3, Beatrice H Hahn
13and Mary Katherine Gonder
1,2*Abstract
Background: Chimpanzees (Pan troglodytes) can be divided into four subspecies. Substantial phylogenetic evidence suggests that these subspecies can be grouped into two distinct lineages: a western African group that includes P. t. verus and P. t. ellioti and a central/eastern African group that includes P. t. troglodytes and P. t. schweinfurthii. The geographic division of these two lineages occurs in Cameroon, where the rages of P. t. ellioti and P. t. troglodytes appear to converge at the Sanaga River. Remarkably, few population genetic studies have included wild
chimpanzees from this region.
Results: We analyzed microsatellite genotypes of 187 wild, unrelated chimpanzees, and mitochondrial control region sequencing data from 604 chimpanzees. We found that chimpanzees in Cameroon and eastern Nigeria comprise at least two, and likely three populations. Both the mtDNA and microsatellite data suggest that there is a primary separation of P. t. troglodytes in southern Cameroon from P. t. ellioti north and west of the Sanaga River. These two populations split ~200-250 thousand years ago (kya), but have exchanged one migrant per generation since separating. In addition, P. t. ellioti consists of two populations that split from one another ~4 kya. One population is located in the rainforests of western Cameroon and eastern Nigeria, whereas the second population appears to be confined to a savannah-woodland mosaic in central Cameroon.
Conclusions: Our findings suggest that there are as many as three genetically distinct populations of chimpanzees in Cameroon and eastern Nigeria. P. t. troglodytes in southern Cameroon comprises one population that is
separated from two populations of P. t. ellioti in western and central Cameroon, respectively. P. t. ellioti and P. t. troglodytes appear to be characterized by a pattern of isolation-with-migration, and thus, we propose that neutral processes alone can not explain the differentiation of P. t. ellioti and P. t. troglodytes.
* Correspondence:gonder@drexel.edu
†Equal contributors
1Department of Biology, Drexel University, Philadelphia, Pennsylvania 19104,
USA
2Department of Biological Sciences, University at Albany - State University of
New York, Albany, New York 12222, USA
Full list of author information is available at the end of the article
© 2015 Mitchell et al.; licensee BioMed Central. This is an Open Access article distributed under the terms of the Creative Commons Attribution License (http://creativecommons.org/licenses/by/4.0), which permits unrestricted use, distribution, and reproduction in any medium, provided the original work is properly credited. The Creative Commons Public Domain Dedication waiver (http://creativecommons.org/publicdomain/zero/1.0/) applies to the data made available in this article, unless otherwise stated.
Mitchell et al. BMC Evolutionary Biology (2015) 15:3 DOI 10.1186/s12862-014-0276-y
Background
Chimpanzees (Pan troglodytes) are still widely distrib-uted across sub-Saharan Africa, and the species exploits a wide range of habitats including rainforests, ecotones and savannas [1-3]. Across this range they exhibit considerable genetic [4], behavioral [5] and ecological diversity [3]. Studies consisting mostly of samples from wild-born captive chimpanzees have given great insights regarding the phylogenetic history of this species, but genetic data from wild individuals remain sparse. Recent studies of captive wild-born chimpanzees include datasets such as complete mitochondrial (mt) genomes [6], genome-wide single nucleotide polymorphisms (SNPs) [7], and complete genome sequences [8]. The overall picture to emerge from these studies suggests that chimpanzees are divided into two geographically- and genetically-defined groups: a western African group that includes P. t. verus and P. t. ellioti and a central/eastern African group that includes P. t. troglodytes and P. t. schwein-furthii [8] (Figure 1). This classification is consistent with earlier studies using mtDNA control region sequence diversity from wild individuals from Nigeria and adjacent parts of Cameroon, which suggested that animals in this region form a genetically distinct population of chimpanzees [9,10], now widely recognized as P. t. ellioti [11]. These studies have also been important for under-standing differences in subspecies population histories, and how these histories are connected to landscape and forest history. For example, the western and central/east-ern groups appear to have split from one another very early in the history of this species. Analysis of complete genomes suggests that since their genetic and geographic separation, these groups have experienced markedly differ-ent demographic histories, and the subspecies within each group show different patterns of population growth and decline throughout their respective histories [8].
While the phylogenetic relationships among chimpan-zee subspecies are now well-resolved, their population structure, migration patterns and patterns of population growth still remain unknown, particularly in areas where the ranges of subspecies converge. This is mostly due to a lack of fine-scale geographic sampling of wild chimpanzee populations around areas where subspecies overlap, which has revealed mechanisms of diversifica-tion in gorillas [12]. Analysis of mtDNA from wild chimpanzees from Nigeria and Cameroon has suggested that the Sanaga River delimits P. t. ellioti from P. t. trog-lodytes in southern Cameroon [9]. This split is old, but incomplete, as there is a zone in central Cameroon where the ranges of the mtDNA haplotypes that define these two subspecies overlap. These findings suggest that some introgression may have occurred between these two subspecies [4,10,13] or that a pattern of
isolation-by-distance (IBD) might be revealed by more fine scale population sampling across this region.
The Sanaga River has been proposed to delimit the distributions of several primate species and subspecies [12,14-18] including chimpanzees [4,19]. This region of Africa also contains diverse habitats. Cameroon lies at the intersection of two major rainforest biomes, the Guinean and Congolian rainforests [20] (Figure 1a). These two forests converge in central Cameroon and are connected by a zone of open woodland, savannah and ri-parian forest [20,21] which has been termed an ‘ecotone’ [22]. Therefore, denser geographic sampling and more comprehensive genetic data are necessary to tease apart the relative contributions of forest history and biogeo-graphic boundaries in driving patterns of genetic vari-ation in chimpanzees.
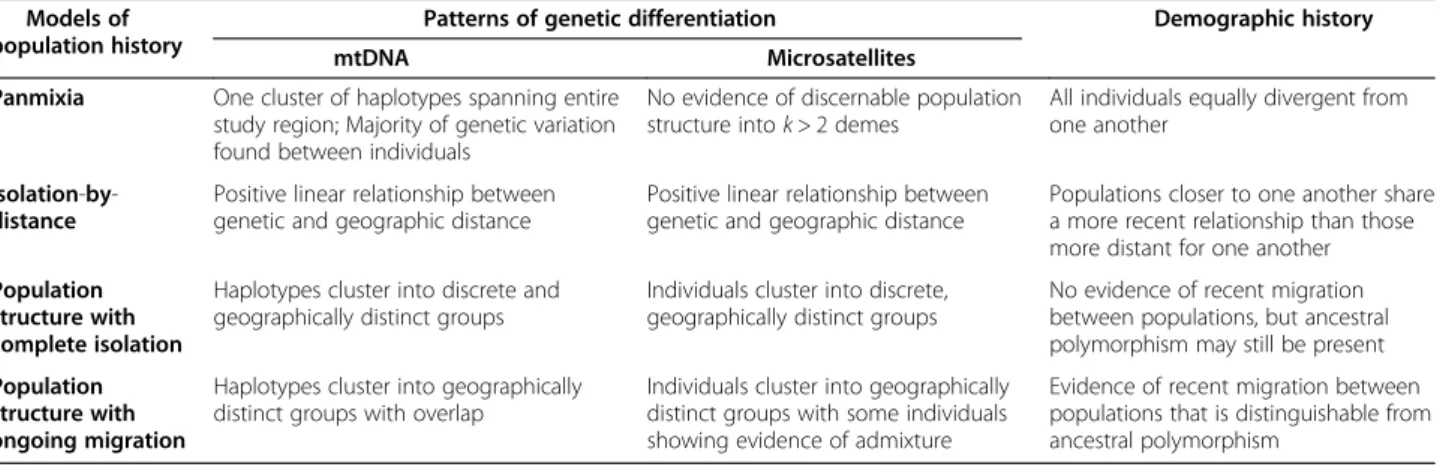
This study uses DNA extracted from fecal and hair samples to examine the population structure and genetic history of chimpanzees from Cameroon and eastern Nigeria at a fine geographic scale across this ecologically diverse region (Figure 2). The overall goals of the study were to use mtDNA haplotypes along with microsatellite genotype profiles of wild individuals to: (1) test between a variety of hypotheses for the presence and type of population structure (Table 1), including (i) panmixia, (ii) isolation-by-distance, (iii) population structure with complete isolation, and (iv) population structure with ongoing migration; (2) test the specific hypothesis that the Sanaga River has been important in delimiting the range of P. t. ellioti from neighboring P. t. troglodytes; and (3) compare the demographic histories of these two subspecies by inferring the time to their most recent common ancestor (TMRCA), their historical and current
effective population sizes, and finally, the rates and di-rections of migration between them.
Results and discussion
Dataset preparation
We calculated pairwise estimates of relatedness for all pairs of genotyped individuals using the software pro-gram COANCESTRY [23] and removed duplicate indi-viduals and those that were closely related to one another. A total of three individuals with a relatedness index value [24] above 0.75 were determined to be either identical individuals or highly related and were excluded from all further analyses. The analyses presented here include mtDNA sequencing data from 604 sequences from 35 sampling locations, and microsatellite data were included from 187 unrealated individuals from 28 sam-pling locations (Additional file 1).
In order to ensure that all of the genetic markers were selectively neutral, and therefore suitable for further ana-lysis, the data were subjected to various neutrality tests. We found that all microsatellite loci met expectations of
Hardy-Weinberg equilibrium and expectations of neu-trality (Additional files 2 and 3). We further subjected the microsatellite loci to an outlier test based on observed heterozygosity and FST, and all 21 loci fell within the
acceptable range of neutrality (Additional file 4).
mtDNA diversity analysis
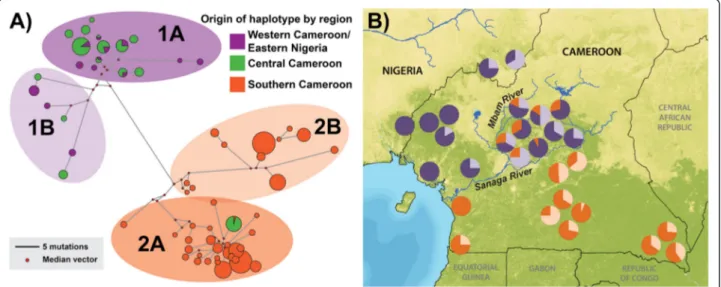
We constructed a median-joining mtDNA haplotype network (Figure 3a) and plotted a frequency distribution
of inferred haplotypes found at each sampling location across Cameroon and Nigeria (Figure 3b). The results were similar to observations from previous studies [10,13]. Specifically, there are two primary mtDNA hap-logroups, each comprised of two distinct haplotypes, found across the study area. One haplogroup (Figure 3a light purple and dark purple) occurs only in individuals north of the Sanaga River (range of P. t. ellioti). The sec-ond haplogroup (Figure 3a light orange and dark orange)
Figure 1 Distribution and current phylogeny of Pan. (A) Major rainforest biomes of tropical Africa. (B) Phylogeny of chimpanzees, bonobos and humans using whole genome data, adapted from Prado-Martinez et al. [8]. (C) Distribution of chimpanzee subspecies and bonobos across tropical Africa.
occurs in P. t. troglodytes primarily south of the Sanaga. However, these two haplogroups overlap with each other in the ecotone in central Cameroon, north of the Sanaga River and east of the Mbam River. Interestingly, the P. t. troglodytes–like mtDNA sequences found in the ecotone belong to a single sub-type within haplogroup 2A. This suggests either a pattern of historic gene flow between the subspecies, which is consistent with other studies [10,13], or alternatively that there was a single migration event from south to north of the Sanaga followed by the proliferation of this haplotype exclusively within central Cameroon.
Overall, the results of the mtDNA haplotype analysis suggest that panmixia does not describe the population structure of chimpanzees. There is clear evidence that there are two main mtDNA haplogroups: a group in east-ern Nigeria and westeast-ern Cameroon and a second group in southern Cameroon. The geographic distributions of these
groups converge with one another in central Cameroon, with an abrupt transition between them along the Sanaga River. Overlap between these groups appears to be con-fined to the ecotone of central Cameroon, which also co-incides with the confluence of the Sanaga with the Mbam River–another river of biogeographic significance for primates [16]. It is also worthy to note that P. t. ellioti in central Cameroon are more diverse than those in western Cameroon/eastern Nigeria (Figure 3b). Lower haplotype diversity in western Cameroon and eastern Nigeria, which has been proposed to be an area of putative Pleistocene re-fugia [25,26], may either be the result of local extinctions of haplotypes, or a diversification of mtDNA haplotypes as the result of increased habitat variation in central Cameroon.
We grouped results of the Analysis of Molecular Vari-ance (AMOVA) (Table 2) for mtDNA sequences accord-ing to variation: (i) within populations (ΦST); (ii) among
populations in groups (ΦSC); and (iii) among groups
north or south of the Sanaga River (ΦCT), the major
population partition indicated in previous studies [9,10]. Dividing the haplotypes by their origins north versus south of the Sanaga River accounted for 52.41% of the variation among groups, whereas 43.22% of the variation occurred within sampled populations within these groups. This population pattern is markedly different from the partitioning of genetic variation found in P. t. schweinfurthii [27] where less than 2% of the genetic variation were reported to have accounted for the differ-ences between P. t. schweinfurthii groups that were sep-arated from one another by more than a 600 km straight-line distance (Table 2), whereas the groups in-cluded in this AMOVA are separated by no more than 30 km at their points of closest sampling north versus south of the Sanaga River (Figure 2). Similarly, results for a spatial AMOVA (SAMOVA) [28] that assumed two populations (k = 2) were present across the study area confirmed the geographic grouping of sampling locations north and south of the Sanaga River. The division of
Figure 2 Sample locations of chimpanzees. Locations spanned Cameroon and eastern Nigeria. Probable distributions of P. t. ellioti (purple) and P. t. troglodytes (orange) ranges are shown. Circles denote both hair and fecal samples were collected at the location. Squares denote only hair samples were collected.
Table 1 Hypotheses and predictions
Models of
population history mtDNA Patterns of genetic differentiationMicrosatellites Demographic history Panmixia One cluster of haplotypes spanning entire
study region; Majority of genetic variation found between individuals
No evidence of discernable population structure into k > 2 demes
All individuals equally divergent from one another
Isolation-by-distance Positive linear relationship betweengenetic and geographic distance Positive linear relationship betweengenetic and geographic distance Populations closer to one another sharea more recent relationship than those more distant for one another
Population structure with complete isolation
Haplotypes cluster into discrete and geographically distinct groups
Individuals cluster into discrete, geographically distinct groups
No evidence of recent migration between populations, but ancestral polymorphism may still be present Population
structure with ongoing migration
Haplotypes cluster into geographically distinct groups with overlap
Individuals cluster into geographically distinct groups with some individuals showing evidence of admixture
Evidence of recent migration between populations that is distinguishable from ancestral polymorphism
haplotypes according to geographically homogeneous groups, accounted for 49.37%, and 45.56% of the variation within sample locations within these groups (Additional file 5). This pattern was statistically significant and recapitu-lated the results of the AMOVA (Table 2).
We generated two sets of mismatch distributions to examine whether the sampled populations had experienced recent botttlenecks, population expansions or demographic stability (Additional files 6 and 7). Individuals were grouped into either two or three separate groups, as identi-fied by microsatellite cluster analysis. None of the mis-match distributions were found to be significantly different from the null model, which indicates demographic stability of all populations included in the analyses (Additional files 6 and 7) [29].
Microsatellite genotype analysis
Mantel tests of 21 microsatellite loci (Figure 4) revealed a significant (p < 0.05) pattern of isolation-by-distance across the study area as a whole. However, the relation-ship between genetic and geograpahic distance is weak. The R2 value is low (R2= 0.0186) and overall accounts
for for less than 2% of the total genetic variation present across the study area. Because isolation-by-distance only weakly explains the population structure of chimpan-zees, we next examined the number and distribution of populations across the study area.
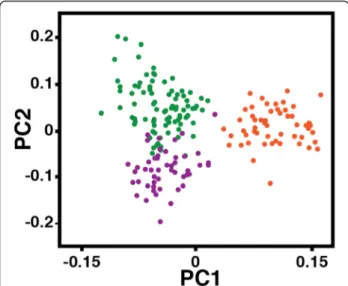
A Principal Components Analysis (PCA) was carried out to examine how many different gene pools were present across the study region. The PCA shown in Figure 5 classi-fied the first four eigenvectors as significant (p < 0.05). The
Figure 3 mtDNA haplotype network and map. (A) Median-joining haplotype network of mtDNA HVRI locus generated using Network 4.5. Each cluster is color coded to display the inferred geographic origin of individuals; (i) purple representing western Cameroon and eastern Nigeria (north of the Sanaga River and west of the Mbam River), (ii) green representing central Cameroon (north of the Sanaga and east of the Mbam), and (iii) orange representing southern Cameroon (south of the Sanaga). Haplotypes cluster into two main groups (1 and 2), and 4 sub-groups (1A, 1B, 2A and 2B). (B) Pie charts show the frequency distribution of mtDNA haplogroups (1A, 1B, 2A and 2B) across the study area.
Table 2 Analsis of Molecular Variance (AMOVA) for mtDNA HVRI
Partition Fixation indices Variance components Percentage of variation Significance North (P. t. ellioti) versus south of Sanaga (P. t. troglodytes)a
Among groups (ΦCT) 00.52 10.09 52.41 p < 0.05
Among populations in groups (ΦSC) 00.56 00.84 04.37 p < 0.05
Within populations (ΦST) 00.09 08.32 43.22 p < 0.05
DRC versus eastern forests (both P. t. schweinfurthii)b
Among groups (ΦCT) 00.00 00.00 00.00 Not significant
Among populations in groups (ΦSC) 00.10 00.05 10.23 p < 0.05
Within populations (ΦST) 00.10 00.45 89.77 p < 0.05
aAMOVA results of data from this study.
bAMOVA analysis reported by Goldberg and Ruvolo [27]. The samples included eastern chimpanzees (P. t. schweinfurthii) divided into two groups of samples
recovered from chimpanzees in northeastern Democratic Republic of Congo (DRC) and ‘eastern forests’ that includes sampling locations in Rwanda, Tanzania and Uganda. These two groupings are separated from one another by more than 600km straight-line distance.
first Principal Component (PC 1) separated chimpanzees north and south of the Sanaga River (P. t. ellioti and P. t. troglodytes), and accounted for 71% of the total extracted variation in the dataset. PC 2 accounted for 21% of the total extracted variation and separated P. t. ellioti chimpan-zees into two groups: one cluster of individuals mostly from the forests of western Cameron (further designated as: P. t. ellioti (Rainforest), purple) and another cluster of individuals from the ecotone in central Cameroon (further designated as: P. t. ellioti (Ecotone), green). PC 3 and PC4 accounted for 5% and 3% respectively, and separated small
clusters of individuals from the same sampling locations from the rest of the dataset. These final PCs were sample location specific and are possibly the result of sampling bias (i.e. sampling of related individuals below our related-ness threshold).
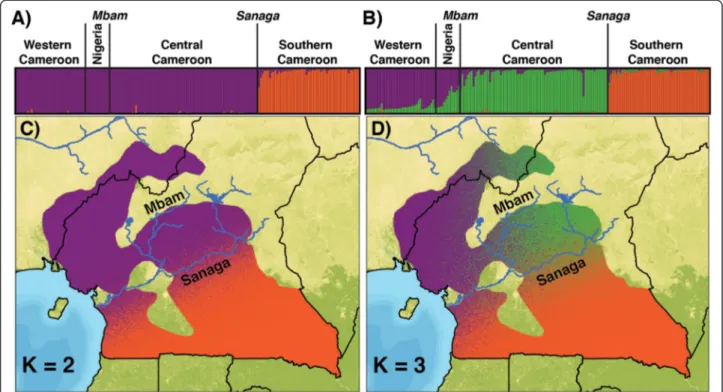
Results of the cluster analysis in TESS [30] are shown in Figures 6a and b. We used several methods to infer the maximum number of populations, K, represented by this dataset. Deviance Information Criteria (DIC) [31] values suggest that KMAX is 2 (Additional file 8a). In
contrast, the post hoc statistic, ΔK [32], suggests a KMAX
of 3 (Additional file 8b). Overall, these results suggest that there is a primary separation along the banks of the Sanaga River. P. t. ellioti, (purple) is found north and west of the river, whereas P. t. troglodytes (orange) oc-curs south of the Sanaga (Figure 6a). There is additional evidence of a population subdivision within P. t. ellioti: a population located in the forests of western Cameron (P. t. ellioti (Rainforest), purple) and another population located in the ecotone in central Cameroon (P. t. ellioti (Ecotone), green) (Figure 6b).
The spatial interpolations generated by TESS Ad-Mixer [33] show the separation of these two populations (P. t. ellioti, purple and P. t. troglodytes, orange) corresponds to banks of the Sanaga River (Figure 6c). Setting k = 3, which was supported by the ΔK statistic and the PCA, provided evidence of further subdivision within P. t. ellioti. Setting k = 2 and k = 3 using TESS (Figure 6) distinguished the same populations as PC1 and PC2 (Figure 5). The TESS Ad-Mixer [33] results show that this subdivision exists ex-clusively north of the Sanaga River, and the east–west div-ision of populations (purple and green) coincides with the Mbam River, although this division is much less pro-nounced than the division of P. t. ellioti and P. t. troglo-dytes at the Sanaga River (Figure 6d), and there is predicted overlap between these two groups in Nigeria, north of the Mbam.
Values for three measures of genetic differentiation, D2
[34], RST[35], and δμ2[36], are shown in Additional file 9
between the three populations identified in the cluster analyses (Figures 5 and 6). All three measures were corre-lated with one another; D2and R
ST, r2= 0.94; D2and δμ2,
r2= 0.58; and R
STand δμ2, r2= 0.81; and all pairwise
differ-ences were significantly different from null expectations of the data (Additional file 9). Genetic differentiation was highest between populations of chimpanzee across the Sanaga River (P. t. ellioti versus P. t. troglodytes) and low-est between populations of chimpanzee north of the Sanaga River (P. t. ellioti (Rainforest) versus P. t. ellioti (Ecotone)). Additional file 9 shows the estimated number of migrants exchanged between populations per gener-ation (2Nm) as calculated using in the Arlequin version 3.5 software package [37]. Between 1 and 2 migrants per generation are exchanged between populations located
Figure 4 Isolation-by-distance. Results of a Mantel test performed to identify a correlation between genetic differentiation and the geographic distance between sampling locations (Figure 2). Points on the chart represent pairwise comparisons and the trend line represents linear correlation (p = 0.0045, R2= 0.0186).
Figure 5 Principal Components Analysis (PCA). PCA generated on the basis of individual genotypes. Individuals are color coded according to geographic origin; (i) purple – western Cameroon and eastern Nigeria, (ii) green – central Cameroon, and (iii) orange – southern Cameroon. PCs 1 and 2 (shown) represent the eigenvectors that accounted for 71 and 21%, respectively, of the total extracted variation.
north vs. south of the Sanaga River, and approximately 11 migrants exchanged between the two populations found north of the Sanaga River in western and central Cameroon, respectively.
Allele richness and number of private alleles by popula-tion, corrected for unequal population size, is shown in Additional files 10a and 10b. Allele richness varied consid-erably between populations, with P. t. troglodytes displaying almost twice as many distinct alleles per locus compared to P. t. ellioti (Rainforest) and P. t. ellioti (Ecotone). How-ever, the mean number of private alleles per locus did not vary considerably between regions, although we observed a similar pattern, with P. t. troglodytes exhibiting the greatest
number of private alleles, when corrected for unequal sam-ple size. Additional file 10c shows the mean number of shared private alleles between the three combinations of population pairs, when corrected for equal population size. Interestingly, the highest number of shared private alleles occurs between P. t. ellioti (Rainforest) and P. t. troglodytes, with the other two population pairs exhibiting similar numbers of shared alleles.
Population history
We pooled the mtDNA and microsatellite data together for analysis in IMa [38], which allowed for the estimation of several population parameters (Table 3), including
Figure 6 Cluster analysis and spatial interpolations. (A and B) TESS bar plots for K = 2-3. Each vertical line represents an individual, and colors represent their inferred ancestry from K ancestral populations. Individuals are ordered by their geographic sampling location. (C and D) Spatial interpolations of the Q matrices generated by the program TESS Ad-Mixer for K = 2-3. Spatial interpolations were plotted on probable extents of chimpanzee ranges in Nigeria and Cameroon.
Table 3 Summary of demographic parameters for population pairs
Comparison Migrants per generation* Population Size* Population Divergence* Population 1 x Population 2 Into Pop. 1 Into Pop. 2 Ne Pop. 1 Ne Pop. 2 Na TMRCA(kya)
P. t. ellioti x P. t. MLE 1.10 1.15 2,140 3,365 3,002 200,979 (Rainforest) troglodytes 95% CI 0.52 - 2.37 0.32 - 2.53 1,748 - 2,696 2,720 - 4,091 222 - 15,294 180,157 - 334,096
P. t. ellioti x P. t. MLE 1.58 0.79 2,633 9,084 7,208 254,553 (Ecotone) troglodytes 95% CI 1.03 - 2.34 0.20 - 1.71 1,984 - 3,282 7,549 - 10,961 1,493 - 45,421 202,149 - 328,715 P. t. ellioti x P. t. ellioti MLE 2.49 4.39 2,368 860 5,920 4,219 (Rainforest) (Ecotone) 95% CI 0.62 - 13.73 1.84 - 8.84 1,466 - 3,077 658 - 1,231 4,200 - 12,465 2,298 - 67,636
*Demographic parameters were inferred in IMa [38]. These parameters were scaled assuming an mtDNA mutation rate of 1.64 x 10⁻⁷[89], an intermediate
microsatellite mutation rate of 7.75 x 10- 5[87], and 20-year generation time [90]. Demographic estimates assuming different microsatellite mutation rates are
shown in Additional file11.
descendant (N1 and N2) and ancestral (NA) population
sizes, time of divergence and migration rates between each of the three populations recovered by the cluster analysis (Figure 6) and PCA (Figure 5). All three population com-parisons yielded well-resolved posterior probability distri-butions for each population parameter (Additional files 11, 12 and 13). Both P. t. ellioti (Rainforest) and P. t. ellioti (Ecotone) last shared a common ancestor with P. t. troglo-dytes approximately 200 to 250 kya, which is consistent with other studies using similar data [39]. The two P. t. ellioti populations last shared a common ancestor with each other much more recently, about 4 kya. The results of these analyses also included estimates of ancestral and descendant effective population sizes for all pairs of popu-lations. Estimates of effective population size for the present P. t. ellioti (Rainforest) population were consistent across runs, showing an effective population size of ap-proximately 2,000 individuals. There was considerably more variation detected between comparisons for ef-fective population sizes of P. t. ellioti (Ecotone) and P. t. troglodytes. In P. t. ellioti (Ecotone), effective population size was estimated to be between approximately 1,000 and 2,500 individuals. The current effective population size of P. t. troglodytes in southern Cameroon, may range from 3,000 to 10,000 individuals. The estimates for ancestral population size show that P. t. ellioti north of the Sanaga River were approximately 6,000 individuals, and that the ancestral populations of chimpanzees likely ranged be-tween approximately 3,000 and 7,000 individuals. The number of migrants per generation was also estimated for all three pairs of populations. Between 0.79 and 1.58 mi-grants per generation have been exchanged between pop-ulations across the Sanaga River, since the initial separation of P. t. troglodytes and P. t. ellioti. Higher levels of migration were found between the P. t. ellioti popula-tions (Table 3 and Additional file 7).
Overall the results of the IMa suggest very clearly that the gene pools of P. t. ellioti and P. t. troglodytes are mostly, but not completely isolated from one another (Figures 3, 5 and 6). We conclude that these two subspe-cies are characterized by an isolation-with-migration popu-lation history model [40] for several reasons. The results of the IMa analysis shows that the P. t. ellioti populations last shared a common ancestor with P. t. troglodytes approxi-mately 200–250 kya, and since this separation they have exchanged approximately one migrant per generation. Moderate levels of gene flow (≥1 migrant/generation) between populations should prevent divergence, under a model that assumes that drift occupies the dominant role in population differentiation [40]. Population divergence in the presence of gene flow is often cited as evidence that local adapatation is driving the separation of two or more populations [41-43]. However, the observed value of migra-tion between P. t. elioti and P. t. troglodytes (2 Nm ~ 1) is a
minimal threshold [40], making it difficult to fully distin-guish whether allopatric speciation or local adaptation has occupied the dominant role in driving this separation.
Demographic histories can be influenced by climatic histories. The climate of Africa has been affected by os-cillations in global temperature and species assemblages in tropical Africa are often influenced by these changes, particularly the Last Glacial Maximum (LGM) [25]. It is also important to understand demographic history in the context of climatic histories. Interestingly, the dates of di-vergence between P. t. ellioti and P. t. troglodytes predate the LGM, but do coincide with a pronounced glacial epi-sode approximately 250kya [26], with evidence that sand dunes extended all the way to the Niger Delta [25].
It may be possible that these fluctuations in local climate may have influenced the Sanaga River, but little is known regarding its historical course and size. Rivers are known to dramatically change in course and size over time, thus affecting their ability to act as dispersal barriers [44]. Thus, it is possible that chimpanzee migration across the Sanaga could have occurred in bursts when river size was min-imal, but we are unable to directly test this hypothesis, given the nature of the genetic data used in this study.
Conclusions
This study represents the most comprehensive genetic dataset available for wild chimpanzees from Cameroon, which is important because it is the only known area where the distributions of two chimpanzee subspecies overlap. Microsatellite genotype profiles from 187 unre-lated individuals and mtDNA haplotypes of 607 individ-uals were used to test between a variety of hypotheses for the presence and type of population structure of chim-panzees across the study area, including (i) panmixia, (ii) isolation-by-distance, (iii) population structure with complete isolation, and (iv) population structure with ongoing migration. Overall, the results suggest that P. t. ellioti and P. t. troglodytes represent genetically distinct populations in Cameroon, confirming results from previ-ous studies of captive chimpanzee with inferred origins [6-8,39] and previous analyses of mtDNA haplotypes of wild individuals [9,10]. Surprisingly, we found additional evidence that P. t. ellioti consists of two genetically- and geographically-distinct populations. One population is lo-cated in forested regions of eastern Nigeria and western Cameroon and the second is located in central Cameroon, in a savanna-woodland mosaic that occurs between the Mbam and Sanaga Rivers. The results of the IMa analysis show that the P. t. ellioti populations and P. t. troglodytes diverged from one another 200–250 kya, and have experi-ence moderately high (2Nm ~ 1) gene flow since (Table 3). This, coupled with the overlap of these populations in the mtDNA haplotype network analysis (Figure 3) and micro-satellite cluster analyses (Figures 5 and 6) call in question
the role of the Sanaga River in acting as a biogeographic barrier that has separated these chimpanzee subspecies.
Several riverine barriers have been proposed as bio-geographic boundaries for primates in the region [4,9,12,14-18,45], but the role of habitat variation in driv-ing primate speciation remains unknown. For instance, in addition to being important for chimpanzees, the Sanaga River has been proposed to influence the distribution of several pairs of primates, including Mandrillus leuco-phaeus/M. sphinx, Cercopithecus erythrotis/C. cephus, C. nictitans martini/C. n. nictitans, and C. pogonias pogo-nias/C. p. grayi [4,14-16,18]. These pairs of primates all occupy vastly different habitats and niches [14,15]. This ob-servation suggests that other factors along with, or instead of, the Sanaga River may be important in separating the distribution of these species, subspecies and populations across the region. It is well documented that non-riverine barriers, such as the Dahomey Gap, also separate taxa, and likely separates P. t. verus from P. t. ellioti (although the role of the Niger River is unclear) [10,44]. Other factors have also been proposed to shape African tropical biodiver-sity in the region [12,46-49]. Thus, it is important that we reevaluate the role that the allopatric speciation, as driven by the Sanaga River, may have had in governing distribu-tions of rainforest taxa, particularly primates.
Cameroon lies at the intersection of two major rainforest biomes. The Congolian Rainforest extends northward into southern Cameroon from central Africa, and the Guinean Rainforest extends southward into eastern Nigeria and western Cameroon from western Africa (Figure 1a). These two biomes converge in central Cameroon at the location of a pronounced ecotone [20], which is composed of open woodland, savannah and riparian forest [20,21]. Recent studies in this area that have combined genetic, morpho-logical and environmental data have found that this eco-tone appears to drive evolutionary diversification in insects [50], reptiles [51] and birds [22,52]. This is especially inter-esting, given that neutral processes are unlikely to explain the population history of chimpanzees in the region, as they seem to follow an isolation-with-migration model. The results of the mtDNA haplotype analysis shows an overlap of the two major haplogroups (Figure 3), and the results of the cluster analysis show a distinct deme of chimpanzee in this ecotone (Figure 6d). However, the loci included in this study meet expectations of neutral evolu-tion, and thus, do not allow for us to draw additional con-clusions regarding how ecological variation may drive diversification in chimpanzees. These observations under-score the importance of testing alternative hypotheses with loci that that are neutral and under selection.
Even though the migration rate between P. t. ellioti and P. t. troglodytes (2Nm ~ 1) is a minimal threshold to propose that selection has driven the separation of these populations, there is mounting evidence that allopatric
speciation alone cannot account for the divergence of these populations. A complimentary study of the ecological niche differentiation in these populations shows that the demes of chimpanzees found in this study also occupy signifi-cantly different niches [53], suggesting that environmental variation contributes to driving the differentiation of these populations. The alternative hypothesis, that speciation in chimpanzees is driven by allopatric speciation, would be ex-plained by an absence of niche divergence among these three demes [54,55]. Furthermore, in another complimentary study we found significant associations between genetic dif-ferentiation in these three demes and environmental vari-ation across the study area [56], which led us to conclude that these populations likely follow a pattern of isolation-by-environment [57], a relationship between populations that arises as a result of local adaptation to different environ-ments. Taken together, these findings are consistent with the observation that chimpanzees in Cameroon and Nigeria may be adapted to their local evironments, and that this variation has contributed to the genetic differentiation of chimpanzee subspecies.
A broader understanding about the role of local adapta-tion in chimpanzees and other taxa may provide import-ant clues regarding why this region of Africa contains such a high proportion of the Earth’s biodiversity. Future studies that more closely examine the history of the Sanaga River and the role of historic climatic variation in shaping chimpanzee genetic diversity are crucial for build-ing this understandbuild-ing. Additionally, a better understand-ing of how chimpanzee social stuctures and dispersal patterns are shaped by habitat variation, and how this may contribute to regional genetic diversity, is of vital import-ance to unravelling the forces that have helped make this region such an incredibly diverse place on Earth.
Methods
Dataset preparation
We gathered fecal (n = 247) and hair samples (n = 223) from wild-living, non-habituated chimpanzee populations from 36 remote regions spanning eastern Nigeria through southern Cameroon (Figure 2 and Additional file 1). Most samples originating from the regions of Belgique (BQ), Boumba Bek (BB), Diang (DG), Dja Biosphere (DB), Duomo Pierre (DP), Ekom (EK), Lobeke (LB), Mambele (MB) and Minta (MT) were collected between 2004 and 2006 by the team of BHH and MP. Hair and tissue samples from Nigeria and Cameroon were collected during a series of studies from 1994 – 2010 by the team of MKG. We recruited a team of ~9 field assistants for each mission and base camps were established in the vicinity of forests were chimpanzee presence was reported by local hunters and villagers. We initially walked transects, hunters’ paths or elephants paths in search of chimpanzees presence (e.g. night nests, foot prints and vocalizations). The Campo
Ma’an (CP), Cross River (CR), Deng Deng (DD), Diang (DG), Dja Biosphere (DB), Douala-Edea (DE), Gashaka Gumti (GG), Mbam et Djerem (MD) and Mount Cameroon (MC) sites are located in National Parks or forests reserves, whereas the remaining field sites are located in unprotected forests. Fecal samples were identified to be of likely chimpanzee origin by experienced trackers and/or by the researchers. Fecal samples (15–20 g) were placed into 30 or 50 mL tubes and mixed with equal amounts of RNA-later® (Ambion, Austin, TX). Hair samples were collected directly from abandoned sleeping nests and a minimum of three hairs per nest were stored into glassine envelopes, and kept dry in silica gel. Fecal samples were inspected to esti-mate their likely time of deposition, whereas night nests age was estimated according to a leaf decay index [58]. Time, date, location, longitude, latitude and name of collector were also recorded. Fecal and hair samples were generally kept at ambient temperature for no longer than 2 weeks and subse-quently stored at−20°C once back in Yaoundé, Cameroon. Samples were shipped to the United States at ambient temperature, then stored at−20°C upon receipt. All sam-ples were transported from Cameroon to the United States in full compliance with Convention of International Trade in Endangered Species of Wild Fauna and Flora (CITES) and Center for Disease Control (CDC) export and import regulations. This research was carried out with IACUC approval from the University at Albany – State University of New York.
We extracted fecal DNA using the QIAamp Stool DNA Mini kits (Qiagen, Valencia, CA) following well-established protocols [59]. We briefly resuspended 1.5 mL of fecal RNAlater® mixture in stool lysis buffer and clarified them by centrifugation. We treated the supernatants with an InhibitEx tablet, subjected them to proteinase K digestion, and passed them through a DNA binding column. Bound DNA was eluted in 100 μL elution buffer. We extracted DNA from hair samples using a chelating resin protocol [60] followed by filtration using Microcon 100 columns (Millipore, Billerica, MA) to concentrate DNA extracts. We conducted the preparation of the DNA quantification standards, reagents and reactions according to the Quanti-filer® DNA Manufacturer’s protocol [61]. We analyzed the data using a 7500 System v1.2.3 software as an ‘Absolute Quantification (standard curve)’ assay with the settings recommended in the Quantifiler® Kit User’s Manual [61].
We used primers L15997 (5′-CACCATTAGCACCCA AAGCT-3') and H16498 (5′-CCTGAAGTAGGAACCA GATG-3′) to amplify a 460 – 500-bp mtDNA fragment spanning the hypervariable D-loop region (HVRI) in all samples that were newly collected for this study, using methods described in previous studies [10,13,59]. We as-sembled and aligned the resulting sequences with SEQ-MAN DNASTAR software (Lasergene, DNASTAR, Inc., Madison, WI), along with georeferenced sequences from
previous studies [9,10,59,62]. We deposited all newly gen-erated sequences from this study in GenBank under acces-sion numbers KM401682-KM401815.
We used twenty-one autosomal microsatellite loci to produce genotype profiles from both hair and fecal sam-ples. Additional file 14 lists information about the markers including the primers flanking the selected regions and the fluorescent dye set (Applied Biosystems, Foster City, CA) chosen. These markers were originally developed for use in humans [63], but have been shown to be highly informative for use in chimpanzee population genetics studies [39,64]. We also included the Amelogenin locus to determine the sex of the individual sampled. We divided these 22 loci into 4 multiplex PCR reactions that were performed using the Quiagen Multiplex PCR Kit (Qiagen, Valencia, CA) in Eppendorf Mastercyclers (Eppendorf, Westbury, NY). We used 0.5-1 ng DNA, along with Q-Solution (included in the kit). We adopted the following PCR conditions: an initialization at 95°C for 15 min, followed by 40 cycles in-cluding a denaturation step at 95°C for 30 sec, an annealing temperature of 60°C for 1 min, an elongation at 72°C for 1 min and 30 sec, and a final extension at 72°C for 10 min. For samples that failed to produce reliable genotype pro-files, we increased the amount of DNA template to up to 8 μL per reaction, regardless of the DNA quantitation re-sults. Many of the hair samples from the Nigerian locations had been typed previously for some of the loci selected, and were adjusted to the differences in base pair sizes due to apparatus and protocol discrepancies [13,65]. All PCR reactions included negative control samples for quality as-surance. We analyzed each multiplex PCR product on an ABI 3130 capillary array genetic analyzer (Applied Biosystems, Foster City, CA). We determined fragment sizes against a Genescan 600 Liz size standard (Applied Biosystems, Foster City, CA), and allele sizes using the Genemapper ID version 2.7 software (Applied Biosys-tems, Foster City, CA). We scored alleles between three and 6 times to avoid problems associated with allelic dropout, which frequently occurs when genotyping low-yield DNA samples [66]. Samples that did not include at least 15 (70%) or more loci after multiple attempts at PCR fragment amplification were excluded from this study.
We subjected all 21 autosomal microsatellite loci to out-lier tests using LOSITAN [67]. LOSITAN is a Java based selection detection platform, based on the fdist FSToutlier
methods [68]. We ran 1,000,000 simulations of the data while (i) assuming a stepwise mutation model, (ii) assum-ing three populations, (iii) forcassum-ing a correct mean FST, and
(iv) calculating a “neutral” mean FST. We also subjected the
21 autosomal microsatellites, in addition to the mtDNA HVRI sequences, to an exact test of Hardy-Weinberg equi-librium [69] using the Arlequin version 3.5 software pack-age [37]. We tested deviations from Hardy-Weinberg
equilibrium for each locus against 1,000,000 random per-mutations of the data.
We calculated pairwise estimates of relatedness for all samples that produced reliable microsatellite genotypes using the software program COANCESTRY [23]. COAN-CESTRY implements three inbreeding estimators and seven relatedness estimators [24,70-76] to estimate related-ness between individuals and inbreeding coefficients from multi-locus genotype data. We tested 95% confidence inter-vals for relatedness and inbreeding estimates for all geno-typed individuals against 1000 bootstrap permutations of the data. Samples estimated to come from the same indi-vidual or close relatives, with a relatedness index [24] above 0.75, were excluded in order to remove all pairs of individ-uals down to first cousins from all further data analyses.
mtDNA diversity analysis
We generated haplotype networks for HVRI mtDNA sequences via the median-joining algorithm of Network 4.5 (http://www.fluxus-engineering.com). Because it allows for reticulation, the median-joining approach for inferring haplotype relationships is appropriate for the analyses of mtDNA control region sequences, which exhibits high levels of homoplasy in humans [77,78]. We identified hypermutable sites by post-processing using the Steiner maximum parsimony algorithm within Network 4.5 and were excluded from the network analyses.
We performed an AMOVA using Arlequin version 3.5 software package [37]. We tested population differentiation values against 10,000 random permutations of the data. For the AMOVA, we grouped individuals according to their origin either north or south of the Sanaga River. In addition to the AMOVA, we ran a spatial AMOVA (SAMOVA) at k = 2, to confirm the groupings used in the AMOVA, as well as to test how geospatial partitioning of the sampled populations affected population differentiation [28].
We generated mismatch distributions by computing dis-tribution of the number of pairwise differences between mtDNA haplotypes using Arlequin version 3.5 software package [37]. We generated distributions by grouping individuals into either two or three separate groups (as identified by microsatellite cluster analysis), using 100 bootstrap replicates.
Microsatellite genotype analysis
We examined the relationship between genetic differenti-ation and geographic distance by carrying out partial Mantel tests on the microsatellite data using the Arlequin version 3.5 software package [37]. Pairwise FSTvalues were generated
between all sampling locations and genetic differentiation was plotted against straight-line, geographic distance. We fit the data with a linear regression, calculated a correl-ation coefficient and tested for statistical significance.
We used the EIGENSOFT software package [79] to per-form PCA on individual genotypes to identify individuals that could be grouped into significantly different popula-tions. We converted microsatellite data into a false SNP format by scoring the presence or absence of each of n-1 alleles (where n is the number of alleles in the sample) using a script in MATLAB (The MathWorks, Natick, MA) described previously [39]. We processed this file in SmartPCA, which produced eigenvectors and eigenvalues. We conducted this analysis blindly to a priori population labels for individuals in the dataset. We tested the statis-tical significance of each eigenvector using Tracy-Widom statistics. Each significant eigenvector recovered by this PCA approach separates the samples in such a way that the first and subsequent eigenvectors distinguish, in order, the most to least differentiated populations in the sample [79]. All analyses using EIGENSOFT were performed blinded to a priori population labels.
We examined population structure and individual an-cestry using a Bayesian clustering approach implemented in the TESS (version 2.3) software package [30]. This pro-gram estimates the shared population history of individ-uals based on their genotypes and geographic origin under a model that assumes Hardy–Weinberg equilibrium and linkage equilibrium, thereby making no a priori assump-tions regarding population classificaassump-tions. TESS estimates individual proportions of ancestry into K clusters, where K is specified for the program in advance across independ-ent runs and corresponds to the number of putative an-cestral populations. The program then assigns admixture estimates for each individual (Q) from each inferred ances-tral population cluster. It also produces posterior predictive values of Q for geographic areas located in between and around the individual data points.
TESS runs were performed: (i) with a model that allows individuals to have ancestry in multiple popula-tions (CAR model [80]); (ii) with correlated allele fre-quencies; and (iii) blinded to a priori population labels. Runs were performed with a burn-in step of 500,000 Markov Chain Monte Carlo (MCMC) iterations and 1,000,000 MCMC iterations. Fifty runs each for K = 2 through K = 8 were performed for all datasets. We processed TESS outputs with CLUMPP [81] and a G-statistic >99% was used to assign groups of runs to a common clustering pattern. CLUMPP outputs for each K value were plotted with DISTRUCT [82]. We used a combination of methods to infer a maximum number of chimpanzee populations (KMAX) including, (i) the K value that had the highest
aver-age DIC [31], (ii) high stability of clustering patterns between runs, (iii) the KMAXvalue at which KMAX+ 1 no longer split
the cluster distinguished by KMAX[83], (iv) correspondence
between maximum PPD values from TESS runs and signifi-cant eigenvectors recovered by PCA, and (v) calculating an ad hoc statistic, ΔK [32].
We created spatial interpolations of the Q matrix using the option in TESS to generate posterior predictive maps of admixture proportions. We created a template map of the extent of probable chimpanzee ranges in Nigeria and Cameroon in ArcMap Version 10 (ESRI Corp., Redlands, CA) in the ASCII-raster format and input into TESS in order to generate posterior predictive maps of admixture proportions. Using these predictive maps, we generated spatial interpolations of the Q matrices by implementing a matrix based vector algorithm in the program TESS Ad-Mixer [33]. These spatial interpolations use color mixing to predict admixture proportions across space in order to bet-ter visualize the spatial partitioning of genetic differentiation. We calculated allele size range, observed and expected heterozygosity, and an M-Ratio [84] for each locus for three populations as identified by cluster analysis. We tested these values against 10,000 random permutations of the data using the Arlequin version 3.5 software package [37].
We calculated three measures of population genetic dif-ferentiation using the Arlequin version 3.5 software pack-age [37]: D2, R
STand δμ2. The D2[34] genetic distance is
based on a model in which genetic drift is the only force influencing allele frequency differences across populations and is sensitive to recent differentiation events. RST [35]
and δμ2[36] are similar to D2, but both assume a stepwise
mutation model (SMM). Consequently, RSTand δμ2 are
more likely to capture whether differences in the mutation processes are important in driving population differenti-ation and enable assessment of sensitivity to mutdifferenti-ation model assumptions [83]. These latter models differ in that RSTis based on the fraction of the total variance in allele size
between populations and is analogous to FST[35], whereas
δμ2 is based on differences in the means of microsatellite allele sizes [36]. Recent work has shown convincing evidence that the loci typed for this study appear to follow the SMM in both chimpanzees and bonobos [64,85]. D2calculations
were completed on untransformed allele size calls. Since RST
and δμ2assume the SMM, we transformed allele sizes to
re-peat size units prior to analysis in Arlequin version 3.5 [37]. We transformed allele sizes such that the smallest allele for each locus was scored as n and each subsequent allele was scored as n + 1. In infrequent cases where repeat unit sizes did not follow the n + 1 model, and instead repeat units skipped x repeat(s), we scored the next allele in the data as (n + × +1), as described in a previous study [39]. We deter-mined each pairwise genetic distance calculation by 100,000 replications in Arlequin, and the significance of these pair-wise population genetic distances were evaluated by a signifi-cance test at p < 0.05.
We calculated distributions of alleles within and be-tween populations using ADZE [86]. ADZE is a general-ized rarefaction approach that counts alleles private to populations as well as combinations of populations. We used this program to infer (i) the mean number of distinct
alleles per locus, per population; (ii) the mean number of private alleles per locus, per population; and (iii) the mean number of uniquely shared private alleles per locus, between populations.
Population history
We used the program IMa [38] to estimate: (i) the popula-tion mutapopula-tion parameter, θ, for both descendant populapopula-tions (θ1and θ2) and an ancestral population (θA); (ii) rates of
mi-gration from population 1 to population 2(m1) and from
population 2 to population 1 (m2); (iii) and time of
popula-tion divergence (t) for all possible pairs of the three assumed populations: P. t. ellioti in western Cameroon & Nigeria, P. t. ellioti in central Cameroon, and P. t. troglodytes in southern Cameroon. We used IMa instead of the more recently re-leased IMa2 [40] for several reasons. The dataset is com-posed mostly of microsatellites with poorly characterized mutation rates [39,64,87]. Also, due to the complexity of the IMa2 model, the high number of microsatellite alleles, and few number of microsatellite loci, we used the version of the IM model with the fewest assumptions. Additionaly, IMa2 requires the user to input a well resolved, rooted phylogeny of the populations to be tested, and based on the results of the cluster analysis, it was counterproductive to swap through an already well resolved, and simple phylogeny.
We ran multiple iterations of IMa in parallel, for each paired population, using a multi-processor computer clus-ter located at the SUNY College of Nanoscale Science and Engineering. First, we ran the IMa analysis using “M-Mode” (MCMC Mode) with a full complement of model parame-ters, and a broad range of priors for all parameters (θ1, θ2,
θA, m1 m2, and t). Each run was performed with heated
chains using the two-step scheme [88]. For each run, we ran burn-in replicates for a total of five days. We then re-duced the ranges of the model parameters over repeated runs in order to sample more densely their respective pos-terior distributions for each of the three population com-parisons. This resulted in different lengths of analysis for each comparison: the western Cameroon/central Cameroon comparison generated 1,004,512 genealogies using 58 chains; the western Cameroon/southern Cameroon comparison generated 684,192 genealogies using 40 chains; and the cen-tral Cameroon/southern Cameroon comparison generated 947,723 genealogies using 38 chains. After the runs con-verged toward the same values, we loaded the saved geneal-ogies from multiple runs into “L-Mode” (Load Trees Mode) in order to calculate values for model parameters for each pair of populations pooled across these multiple independent runs.
We converted the migration parameters, m1 and m2,
into the number of migrants exchanged per generation (Nm) using the equation Nm = (θ*m)/2. We converted the demographic parameter (t) into years by scaling by muta-tion rate (t/μ). We scaled the t parameter for mtDNA
assuming a mutation rate (μ) of 1.64 × 10⁻⁷ [89]. We
scaled the t parameter for microsatellite loci using several microsatellite mutation rates, given the uncertainty in microsatellite mutation rates in the literature [36,39,64,87]. We used a slow mutation rate of 3.53 × 10⁻⁵
[64], an intermediate mutation rate of 7.75 × 10⁻⁵
(calcu-lated from the geometric mean of rates from Wegmann and Excoffier [87]), and a fast mutation rate of 1.6 × 10⁻⁴
[36,39]. We scaled final values for demographic parame-ters assuming a 20-year generation time for chimpanzees [90]. We scaled effective population sizes (NE) using θ and
a per generation μ using the equation NE= θ/(4*μ*20).
Additional files
Additional file 1: Sample locations and number of individuals included in study.aIndividuals determined by relatedness indices calculated using COANCESTRY [23].bSamples from these locations were not genotyped for microsatellite loci.
Additional file 2: Summary Statistics for mtDNA HVRI.aSignificant values of Fu’s FS shown as bold.bp = 0.04.cp < 0.001.
Additional file 3: Summary statistics for microsatellite loci. *Observed heterozygosity calculated in Arlequin [37]. †Expected heterozygosity calculated in Arlequin [37]. ‡M-Ratio from Garza & Williamson [84].
Additional file 4: Identification of neutral versus outlier loci. Heterozygosity was plotted against FSTfor all 21 microsatellite loci using LOSITAN [67]. Ranges of values for balancing selection (yellow), positive selection (red) and neutrality (gray) were identified. All 21 microsatellite loci fell into the acceptable range of neutrality.
Additional file 5: Spatial Analysis of Molecular Variance (SAMOVA) for mtDNA HVRI.
Additional file 6: Mismatch distribution for two populations. Mismatch distribution using the mtDNA HVRI locus for P. t. ellioti (A) and P. t. troglodytes (B). Harpending’s Raggedness Index for P. t. ellioti (A) was 0.003 (p = 0.977), and for P. t. troglodytes (B) it was 0.007 (p = 0.168). Additional file 7: Mismatch distribution for three populations. Mismatch distribution using the mtDNA HVRI locus for P. t. ellioti (Rainforest, A), P. t. ellioti (Ecotone, B) and P. t. troglodytes (C). Harpending’s Raggedness Index for P. t. ellioti (Rainforest, A) was 0.002 (p = 0.989), for P. t. ellioti (Ecotone, B) it was 0.008 (p = 1) and for P. t. troglodytes (C) it was 0.007 (p = 0.168). Model frequency for P. t. ellioti (Ecotone, B) was not plotted, because the analysis only generated a value for one sample point.
Additional file 8: Estimating KMAX.KMAXwas inferred from 50 independent TESS [30] runs for each value of K from 1 to 8. (A) Estimated values for the Deviance Information Criteria (DIC) [31]. (B) Estimated ΔK [32] values.
Additional file 9: Genetic differentiation (D2,R
STand δμ2) and migration (2Nm) between populations from across the study area from 21 autosomal microsatellite loci.aMeasures of differentiation were computed between populations as inferred by the cluster analyses. bValues above the diagonal are based on Reynold’s Coancestry Coefficient, D2, which does not assume that mutations follow the SMM [34].cValues in underlined italics are migrants exchanged between populations each generation (2Nm).dValues below the diagonal are based on an RST[35] model of evolution that assumes that mutations follow the SMM.eValues in parentheses are based onδμ2model of evolution that also assumes that mutations follow the SMM [36].fAll population pairwise values were significantly different from null expectations from 10,000 permutations of the data in Alrequin [37]. Additional file 10: Inference of microsatellite allelic diversity. (A) Mean number of distinct alleles found in sampled populations.
(B) Mean number of private alleles found in sampled populations. (C) Mean number of uniquely shared alleles between sampled populations. Additional file 11: Summary of results from IMa analysis assuming slow, medium, and fast mutations rates for microsatellite loci. *Demographic parameters were scaled assuming a mtDNA mutation rate of 1.64 x 10⁻⁷[89]. There is a great deal of uncertainty in microsatellite mutation rates. Thus, we scaled demographic parameter estimates using slow, intermediate and fast microsatellite mutation rates. Green cell show a demographic estimates calculated using a slow rate of 3.53 x 10⁻⁵from Becquet et al. [64]. Blue cells show demographic estimates using an intermediate rate of 7.75 x 10⁻⁵calculated from the geometric mean of rates from Wegmann and Excoffier [87]. Red cells show demographic estimates scaled with the fastest mutation rate of 1.6 x 10⁻⁴[36,39]. Demographic parameters were scaled assuming a generation time of 20 years for chimpanzees [90].
Additional file 12: Tests of nested models from IMa for three populations of chimpanzees.aDescription of model tested.bLLR test statistics are calculated as twice the difference in log-likelihood between the indicated model and the full model (Θ1Θ2ΘAm1m2), with degrees of freedom equal to the difference in the number of parameters free to be estimated from the data.cP values are obtained by comparison to the Chi-square distribution.dNumber of free parameters, or degrees of freedom for each model.eWhen the null model is true and has a parameter fixed at the boundary of the parameter space, the expected distribution is a mixture [38].fBold numbers indicate models that could not be rejected (p > 0.05) by the 2LLR log-likelihood ratio test.
Additional file 13: IMa probability distributions. Posterior probability distributions for three parameters: (i) migration (2Nm); (ii) effective population size (4Neμ); and time of population divergence (TMRCA). Parameters are not scaled according to a mutation rate or chimpanzee generation time. Parameters were tested for three population comparisons: (A) P. t. ellioti (Rainforest) – P. t. troglodytes, (B) P. t. ellioti (Ecotone) – P. t. troglodytes, and (C) P. t. ellioti (Rainforest) – P. t. ellioti (Ecotone).
Additional file 14: Microsatellite loci information.aPolymorphic Information Content estimated in CERVUS version 3.0 [91]. Competing interests
The authors declare that they have no competing interests. Authors’ contributions
MWM, SL and MKG designed the research. MWM, SL, LG and MKG performed research. MWM, SL, PRSC and MKG analyzed data. SL, AAP, EEA, AN, LN, NMA, BJM, RF, MP, BHH and MKG contributed samples. MWM, SL, PRSC and MKG wrote the paper. All authors read and approved the final manuscript.
Acknowledgements
We thank the governments of Cameroon and Nigeria for permission to conduct this research. We thank the Zoological Society of San Diego, the Ebo Forest Research Project, the Wildlife Conservation Society and the World Wildlife Fund for their support in Cameroon. We thank Joe Kujawski, Anne Shelton, and the State University of New York – College of Nanoscale Science and Engineering (CNSE) for their assistance with running IMa on the CNSE servers. We thank Caro-Beth Stewart, George Robinson, Jeremy Kirchman and Adam Freedman for helpful comments on early drafts of this manuscript. National Science Foundation awards 0755823 and 1243524 (to MKG), National Institutes of Health award R37 AI 50529 (to BHH and MP), funding from National Geographic (to AN), the Offield Family Foundation (to BJM), the USFWS Great Apes Conservation Fund (to BJM), the Arcus Foundation (to BJM), and the University at Albany – State University of New York (to MKG) supported this work.
Author details
1Department of Biology, Drexel University, Philadelphia, Pennsylvania 19104,
USA.2Department of Biological Sciences, University at Albany - State
University of New York, Albany, New York 12222, USA.3Institut de Recherche
pour le Développement (IRD) and Université Montpellier 1 (UM1), 34394 Montpellier, France.4Forensic Biology Section, North Carolina State Crime
Laboratory, Raleigh, North Carolina 27603, USA.5Wildlife Conservation
Society, Bronx, New York 10460, USA.6Institue for Conservation Research,
Zoological Society of San Diego, Escondido, CA 92027, USA.7Ebo Forest
Research Project, BP 3055, Messa, Yaoundé, Cameroon.8Wildlife Conservation
Society - Tazania, Ruaha-Katavi Landscape, Iringa, Tanzania.9Environment
and Rural Development Foundation, BP 189, Buea, Cameroon.10Department
of Biological Sciences, University of New Orleans, New Orleans, Louisiana 70148, USA.11School of Natural Sciences, University of Stirling, Stirling FK9
4LA, UK.12Wildlife Conservation Society - Cameroon, BP 3055, Messa,
Yaoundé, Cameroon.13Departments of Medicine and Microbiology,
University of Pennsylvania, Philadelphia, Pennsylvania 19104, USA.
Received: 9 September 2014 Accepted: 15 December 2014
References
1. Caldecott JO, Miles L. United Nations Environment Programme., World Conservation Monitoring Centre. World Atlas of Great Apes and their Conservation. Berkeley: University of California Press, in association with UNEP-WCMC, Cambridge, UK; 2005.
2. Lambert JE. Seasonality, fallback strategies, and natural selection: A chimpanzee and cercopithecoid model for interpreting the evolution of hominin diet. In: Ungar PS, editor. Evolution of the human diet: The known, the unknown, and the unknowable. Oxford; New York: Oxford University Press; 2007. p. 324–43.
3. Stumpf R. Chimpanzees and Bonobos, Diveristy within and between species. In: Campbell CJ, Fuentes A, MacKinnon KC, Panger M, Bearder SK, editors. Primates in perspective. New York: Oxford University Press; 2007. p. 321–44. 4. Gagneux P, Gonder MK, Goldberg TL, Morin PA. Gene flow in wild
chimpanzee populations: what genetic data tell us about chimpanzee movement over space and time. Philos Trans Royal Soc B: Biol Sci. 2001; 356(1410):889–97.
5. Whiten A, Goodall J, McGrew WC, Nishida T, Reynolds V, Sugiyama Y, et al. Cultures in chimpanzees. Nature. 1999;399(6737):682–5.
6. Bjork A, Liu W, Wertheim JO, Hahn BH, Worobey M. Evolutionary history of chimpanzees inferred from complete mitochondrial genomes. Mol Biol Evol. 2011;28(1):615–23.
7. Bowden R, MacFie TS, Myers S, Hellenthal G, Nerrienet E, Bontrop RE, et al. Genomic tools for evolution and conservation in the chimpanzee: Pan troglodytes ellioti is a genetically distinct population. PLoS Genet. 2012;8(3): e1002504.
8. Prado-Martinez J, Sudmant PH, Kidd JM, Li H, Kelley JL, Lorente-Galdos B, et al. Great ape genetic diversity and population history. Nature. 2013; 499(7459):471–5.
9. Gonder MK, Oates JF, Disotell TR, Forstner MR, Morales JC, Melnick DJ. A new west African chimpanzee subspecies? Nature. 1997;388(6640):337. 10. Gonder MK, Disotell TR, Oates JF. New genetic evidence on the evolution of
chimpanzee populations, and implications for taxonomy. Int J Primatol. 2006;27(4):1103–27.
11. Oates JF, Groves CP, Jenkins PD. The type locality of Pan troglodytes vellerosus (Gray, 1862), and implications for the nomenclature of West African chimpanzees. Primates. 2009;50(1):78–80.
12. Anthony NM, Johnson-Bawe M, Jeffery K, Clifford SL, Abernethy KA, Tutin CE, et al. The role of Pleistocene refugia and rivers in shaping gorilla genetic diversity in central Africa. Proc Natl Acad Sci. 2007; 104(51):20432–6.
13. Ghobrial L, Lankester F, Kiyang JA, Akih AE, de Vries S, Fotso R, et al. Tracing the origins of rescued chimpanzees reveals widespread chimpanzee hunting in Cameroon. BMC Ecology 2010, 10(1):2.
14. Groves CP. Primate Taxonomy. Washington, D.C: Smithsonian Institution; 2001. 15. Grubb P, Butynski TM, Oates JF, Bearder SK, Disotell TR, Groves CP, et al.
Assessment of the Diversity of African Primates. Int J Primatol. 2003; 24(6):1301–57.
16. Kingdon J. The Kingdon Field Guide to African Mammals. Princeton: Princeton University Press; 2003.
17. Clifford SL, Anthony NM, Bawe-Johnson M, Abernethy KA, Tutin CE, White LJ, et al. Mitochondrial DNA phylogeography of western lowland gorillas (Gorilla gorilla gorilla). Mol Ecol. 2004;13(6):1551–65.
18. Oates JF, Bergl R, Linder J, Oates JF. New genetic evidence on the evolution of chimpanzee populations, and implications for taxonomy. Int J Primatol. 2006;27(4):1103–27.
19. Gonder MK, Disotell TR, Oates JF. New genetic evidence on the evolution of chimpanzee populations, and implications for taxonomy. Int J Primatol. 2006;27(4):1103–27
20. White F. The Vegetation of Africa. Paris: UNESCO; 1983.
21. Maisels F. Mbam Djerem National Park, Cameroon: at the forest’s edge. Canopee. 2005;27:2–6.
22. Smith TB, Wayne RK, Girman DJ, Bruford MW. A role for ecotones in generating rainforest biodiversity. Science. 1997;276(5320):1855–7. 23. Wang J. COANCESTRY: A program for simulating, estimating and
analysing relatedness and inbreeding coefficients. Mol Ecol Resour. 2011;11(1):141–5.
24. Wang J. Triadic IBD coefficients and applications to estimating pairwise relatedness. Genet Res. 2007;89(3):135–53.
25. Maley J. The African rain forest - Main characteristics of changes in vegetation and climate from the Upper Cretaceous to the Quaternary. Proc R Soc Edinb Biol Sci. 1996;104:31–73.
26. Nichol JE. Geomorphological evidence and Pleistocene refugia in Africa. The Geogr J. 1999;165(1):79–89.
27. Goldberg TL, Ruvolo M. The geographic apportionment of mitochondrial genetic diversity in east African chimpanzees, Pan troglodytes schweinfurthii. Mol Biol Evol. 1997;14(9):976–84.
28. Dupanloup I, Schneider S, Excoffier L. A simulated annealing approach to define the genetic structure of populations. Mol Ecol. 2002; 11(12):2571–81.
29. Rogers AR, Harpending H. Population growth makes waves in the distribution of pairwise genetic differences. Mol Biol Evol. 1992;9(3):552–69. 30. Chen C, Durand E, Forbes F, François O. Bayesian clustering algorithms
ascertaining spatial population structure: A new computer program and a comparison study. Molecular Ecology Notes. 2007;7(5):747–56.
31. Spiegelhalter DJ, Best NG, Carlin BP, Van Der Linde A. Bayesian measures of model complexity and fit. J Royal Stat Soc: Series B (Statistical Methodology). 2002;64(4):583–639.
32. Evanno G, Regnaut S, Goudet J. Detecting the number of clusters of individuals using the software STRUCTURE: A simulation study. Mol Ecol. 2005;14(8):2611–20.
33. Mitchell MW, Rowe B, Sesink Clee PR, Gonder MK. TESS Ad-Mixer: A novel program for visualizing TESS Q matrices. Conserv Genet Resour. 2013;5(4):1075–8. 34. Reynolds J, Weir BS, Cockerham CC. Estimation of the coancestry coefficient:
basis for a short-term genetic distance. Genetics. 1983;105(3):767–79. 35. Slatkin M. A measure of population subdivision based on microsatellite
allele frequencies. Genetics. 1995;139(1):457–62.
36. Goldstein DB, Ruiz Linares A, Cavalli-Sforza LL, Feldman MW. Genetic absolute dating based on microsatellites and the origin of modern humans. Proc Natl Acad Sci. 1995;92(15):6723–7.
37. Excoffier L, Lischer HEL. Arlequin suite ver 3.5: A new series of programs to perform population genetics analyses under Linux and Windows. Mol Ecol Resour. 2010;10(3):564–7.
38. Hey J, Nielsen R. Integration within the Felsenstein equation for improved Markov chain Monte Carlo methods in population genetics. Proc Natl Acad Sci. 2007;104(8):2785–90.
39. Gonder MK, Locatelli S, Ghobrial L, Mitchell MW, Kujawski JT, Lankester FJ, et al. Evidence from Cameroon reveals differences in the genetic structure and histories of chimpanzee populations. Proc Natl Acad Sci. 2011; 108(12):4766–71.
40. Hey J. The divergence of chimpanzee species and subspecies as revealed in multipopulation Isolation-with-Migration analyses. Mol Biol Evol. 2010;27 (4):921–33.
41. Millicent E, Thoday JM. Effects of disruptive selection. Heredity. 1961;16:199–217. 42. Maynard Smith J. Sympatric speciation. Am Nat. 1966;100(916):637–50. 43. Endler JA. Geographic Variation, Sepeciation, and Clines. Pinceton,
New Jersey: Princeton University Press; 1977.
44. Oates JF. The distribution of Cercopithecus monkeys in West African forests. In: Gautier-Hion A, Boulière F, Gautier JP, Kingdon J, editors. A Primate Radiation: Evolutionary Biology of the African Guenons. Cambridge: Cambridge University Press; 1988. p. 79–103.
45. Harcourt AH, Wood MA. Rivers as barriers to primate distributions in Africa. Int J Primatol. 2012;33(1):168–83.
46. Haffer J. Speciation in Amazon forest birds. Science. 1969;165:131–7. 47. Endler JA. Pleistocene forest refuges: Fact or fancy? In: Prance GT, editor.
Biological Diversification in the Tropics. New York: Columbia Univeristy Press; 1982. p. 641–57.