HAL Id: hal-02386113
https://hal.archives-ouvertes.fr/hal-02386113
Submitted on 29 Nov 2019
HAL is a multi-disciplinary open access
archive for the deposit and dissemination of
sci-entific research documents, whether they are
pub-lished or not. The documents may come from
teaching and research institutions in France or
abroad, or from public or private research centers.
L’archive ouverte pluridisciplinaire HAL, est
destinée au dépôt et à la diffusion de documents
scientifiques de niveau recherche, publiés ou non,
émanant des établissements d’enseignement et de
recherche français ou étrangers, des laboratoires
publics ou privés.
Dynamics of CD32a+ CD4+ T Cells From Early HIV
Infection to Effective cART
Sixtine Coindre, Nicolas Tchitchek, Lamine Alaoui, Bruno Vaslin, Christine
Bourgeois, Cécile Goujard, Véronique Avettand-Fenoel, Camille Lecuroux,
Pierre Bruhns, Roger Le Grand, et al.
To cite this version:
Sixtine Coindre, Nicolas Tchitchek, Lamine Alaoui, Bruno Vaslin, Christine Bourgeois, et al.. Mass
Cytometry Analysis Reveals the Landscape and Dynamics of CD32a+ CD4+ T Cells From Early HIV
Infection to Effective cART. Frontiers in Immunology, Frontiers, 2018, 9, �10.3389/fimmu.2018.01217�.
�hal-02386113�
Original research published: 04 June 2018 doi: 10.3389/fimmu.2018.01217 Edited by: Aurelio Cafaro, Istituto Superiore di Sanità, Italy Reviewed by: Michael Betts, University of Pennsylvania, United States Paul Urquhart Cameron, University of Melbourne, Australia *Correspondence: Benoit Favier benoit.favier@cea.fr Specialty section:
This article was submitted to Viral Immunology, a section of the journal Frontiers in Immunology
Received: 14 March 2018 Accepted: 15 May 2018 Published: 04 June 2018 Citation:
Coindre S, Tchitchek N, Alaoui L, Vaslin B, Bourgeois C, Goujard C, Avettand-Fenoel V, Lecuroux C, Bruhns P, Le Grand R, Beignon A-S, Lambotte O, Favier B and The ANRS CO6 PRIMO Cohort (2018) Mass Cytometry Analysis Reveals the Landscape and Dynamics of CD32a+
CD4+ T Cells From Early HIV Infection to Effective cART. Front. Immunol. 9:1217. doi: 10.3389/fimmu.2018.01217
Mass cytometry analysis reveals
the landscape and Dynamics of
cD32a
+
cD4
+
T cells From early
hiV infection to effective carT
Sixtine Coindre1, Nicolas Tchitchek1, Lamine Alaoui1, Bruno Vaslin1, Christine Bourgeois1,
Cecile Goujard2, Veronique Avettand-Fenoel3, Camille Lecuroux1, Pierre Bruhns4,5,
Roger Le Grand1, Anne-Sophie Beignon1, Olivier Lambotte1,2, Benoit Favier1*
and The ANRS CO6 PRIMO Cohort
1 CEA-Université Paris Sud 11-INSERM U1184, Immunology of Viral Infections and Autoimmune Diseases (IMVA), IDMIT Department, IBFJ, DRF, Fontenay-aux-Roses, France, 2 Assistance Publique-Hôpitaux de Paris, Service de Médecine Interne et Immunologie Clinique, Groupe Hospitalier Universitaire Paris Sud, Hôpital Bicêtre, Le Kremlin-Bicêtre, France, 3 Paris Descartes University, EA 7327, Sorbonne Paris Cité, APHP, Necker Hospital, Virology Department, Paris, France, 4 Institut Pasteur, Department of Immunology, Unit of Antibodies in Therapy and Pathology, Paris, France, 5 INSERM, U1222, Paris, France
CD32a has been proposed as a specific marker of latently HIV-infected CD4+ T cells.
However, CD32a was recently found to be expressed on CD4+ T cells of healthy donors,
leading to controversy on the relevance of this marker in HIV persistence. Here, we used mass cytometry to characterize the landscape and variation in the abundance of CD32a+
CD4+ T cells during HIV infection. To this end, we analyzed CD32a+ CD4+ T cells in
primary HIV infection before and after effective combination antiretroviral therapy (cART) and in healthy donors. We found that CD32a+ CD4+ T cells include heterogeneous
sub-sets that are differentially affected by HIV infection. Our analysis revealed that naive (N),
central memory (CM), and effector/memory (Eff/Mem) CD32a+ CD4+ T-cell clusters that
co-express LILRA2- and CD64-activating receptors were more abundant in primary HIV infection and cART stages. Conversely, LILRA2− CD32a+ CD4+ T-cell clusters of either
the TN, TCM, or TEff/Mem phenotype were more abundant in healthy individuals. Finally, an
activated CD32a+ CD4+ TEff/Mem cell cluster co-expressing LILRA2, CD57, and NKG2C
was more abundant in all HIV stages, particularly during primary HIV infection. Overall, our data show that multiple abundance modifications of CD32a+ CD4+ T-cell subsets
occur in the early phase of HIV infection, and some of which are conserved after effective cART. Our study brings a better comprehension of the relationship between CD32a expression and CD4+ T cells during HIV infection.
Keywords: cD4+ T-lymphocytes, cD32a, mass cytometry cyTOF, primary hiV infection, combination antiretroviral
therapy
inTrODUcTiOn
Effective combination antiretroviral therapy (cART) leads to the control of HIV replication and disease progression in HIV-infected patients (1, 2). Yet, a reservoir of latently infected CD4+ T cells persists
despite effective cART and can rapidly re-establish high viremia following treatment interruption (3–6). Hence, characterization of latently infected CD4+ T cells is required for the design of
CD32a (also known as FcγRIIa) could be a critical marker for a substantial portion of the latently HIV-infected CD4+ T cells that
harbor replication-competent proviruses (7). However, CD32a expression was also reported on CD4+ T cells displaying HIV
replication and on CD4+ T cells from healthy donors (8–11),
leading to controversy over the relevance of this marker for the characterization of latent HIV reservoirs. Moreover, CD4+ T cells
include naive, effector, and memory populations that are differen-tially expanded and infected by HIV, in particular during primary infection (12, 13). Thus, evaluating the heterogeneity of CD32a+
CD4+ T cells in early HIV infection, before and after effective
cART, could be helpful to better characterize the relationship between CD32a expression and HIV infection.
Here, we carried out a pan-leukocyte analysis of CD32a expres-sion by mass cytometry to assess CD32a+ CD4+ T-cell diversity
in primary HIV-infected patients longitudinally collected before and after 12 months of effective cART. We then compared dif-ferences in the abundance of the identified CD32a+ CD4+ T-cell
subpopulations among all HIV+ stages and under healthy
condi-tions. CD32a is generally found on myeloid cells but also appears to be specifically found on a subpopulation of CD4+ T cells
associ-ated with HIV persistence (7). Thus, our pan-leukocyte analysis included lymphoid and myeloid markers that could help to better characterize the phenotype and heterogeneity of CD32a+ CD4+
T cells. In this respect, we explored the expression of inhibitory and activating leukocyte immunoglobulin-like receptors (LILRs) that are distantly related to FcRs (14). LILRs are mainly distributed on myeloid cells, but some members are also found on T-cell subsets, similar to FcRs (15–18). Moreover, LILRs can directly regulate the activity of CD32a and CD64 (19–22) and play an important role in the dysregulation of immune responses against HIV (23–26).
Previous studies analyzed CD32 expression with only a pan-CD32 antibody. We thus also included antibodies that discrimi-nate CD32a from CD32b to unambiguously identify CD32a+
CD4+ T cells. We also investigated the expression of CD16 and
CD64, belonging to the FcR family, within the CD32a+ CD4+
T-cell population.
Here, we show that primary HIV and cART stages are associated with a higher proportion of CD32a+ CD4+ T cells, co-expressing
LILRA2 and CD64, among naïve (TN), central memory (TCM),
and effector/memory (TEff/Mem) subpopulations. In addition, we
found that a subset of activated TEff/Mem CD32a+ LILRA2+ CD57+
NKG2C+ cells was more abundant in all HIV stages and positively
correlated with HIV DNA levels.
Altogether, our results unravel the diversity of CD32a+ CD4+
T cells and the various phenotypic changes that occur during early immune responses against HIV and after effective cART.
resUlTs
Mass cytometry analysis reveals
the Diversity of cD32a
+cD4
+T-cell
Populations among hiV-infected Patients
and healthy Donors
We characterized the heterogeneity of CD32a+ CD4+ T-cell
populations in primary HIV-infected patients, before and after
effective cART, as well as in healthy donors, using a pan-leukocyte mass cytometry panel of 35 markers. For this purpose, a first group of six patients were longitudinally sampled at the time of diagnosis, in the primary phase of HIV infection (primary HIV), and after 12 months of successful cART (HIV cART). Primary HIV infection referred to blood samples collected between 18 and 30 days after HIV infection (Fiebig stage III/IV) with a high-level plasma viral load (number of copies/ml > 200,000) including parameters described by Krastinova et al. (27).
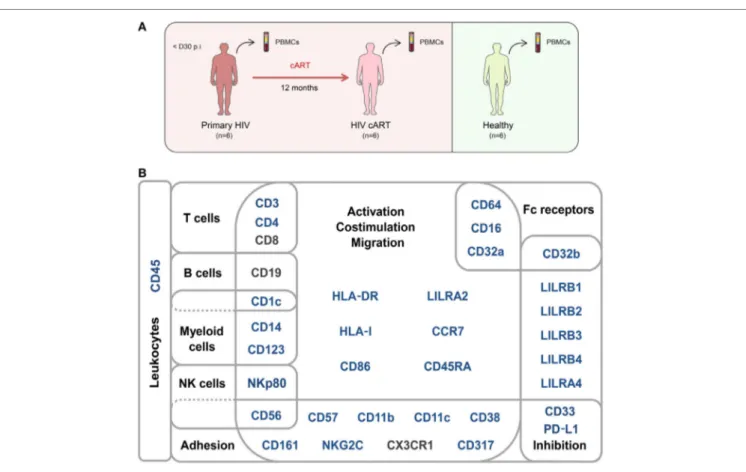
A second group of individuals was comprised of six healthy HIV-negative donors (healthy) (Figure 1A). Clinical characteris-tics of these groups are shown in Table 1. The pan-leukocyte mass cytometry panel included markers for lymphoid and myeloid cells, migration and adhesion markers, and activating and inhi bitory immunoreceptors (Figure 1B). CD32 includes highly homologous isoforms (15). We thus used monoclonal antibodies that specifi-cally recognize either CD32a (clone IV.3) or CD32b (clone 2B6) to avoid misinterpretation of the data (Table S1 in Supplementary Material). The specificity of these antibodies was confirmed by the detection of CD32a, but not CD32b, on monocytes and CD32b on only B cells (Figure S1 in Supplementary Material), in agree-ment with previous studies (15). Thus, our results unambiguously reflect CD4+ T cells expressing CD32a protein on their surface.
We applied a gating strategy to select the whole CD4+ T-cell
population (CD19−, CD3+, CD8−, and CD4+) from total
leuko-cytes (CD45+) (Figure S2 in Supplementary Material). We next
characterized the simultaneous expression of the markers from our panel on total CD4+ T cells by performing a Spanning-tree
Progression Analysis of Density-normalized Events (SPADE) (28). The SPADE algorithm aims to identify cell clusters with similar expression of selected markers, regardless of the sample cell origin (29). We benchmarked a set of parameters (as described in sec-tion “Materials and Methods”) to optimize the SPADE analysis. We obtained 322 CD4+ T-cell clusters from all cell samples, after
excluding a few contaminant myeloid cell clusters, and generated a heatmap representing their respective relative marker expression (Figure S3 in Supplementary Material). The range of expression for each marker (5th to 95th percentiles of expression) is represented using a gradient color scale ranging from white (not expressed) to dark red (highly expressed) (Figure S4 in Supplementary Material). Some CD4+ T-cell clusters exhibited CD32a at their
surface at various levels, as previously reported (7).
HIV latency was proposed to be associated with increased expression of CD32a (7). We thus focused on CD4+ T-cell clusters
displaying high levels of CD32a (CD32a+), indicated on the heatmap
in red and dark red (Figures S3 and S4 in Supplementary Material), and generated a second heatmap representing only CD32a+ CD4+
T-cell clusters (Figure 2A). The total number of cells (from all conditions) associated with each CD32a+ CD4+ T-cell cluster was
quantified (Figure S5 in Supplementary Material). Characterization of these clusters revealed heterogeneous phenotypes within CD32a+ CD4+ T cells that were associated with naive (TN: CCR7+
CD45RA+), central memory (TCM: CCR7+ CD45RA−), and effector/
memory (TEff/Mem: CCR7− CD45RA−) subsets (Figure 2A). Further
analysis showed that among CD32a+ CD4+ T-cell clusters, HIV+
patients under cART displayed a significantly higher proportion of TCM than TN (p = 0.016) (Figure S6 in Supplementary Material).
FigUre 1 | Study design and mass cytometry panel. (a) Schematic representation of the study design. Two groups of individuals were studied. The first group
corresponds to HIV-infected patients collected during primary HIV infection, diagnosed within 30 days post-infection (primary HIV), and after 12 months of combination antiretroviral therapy (HIV cART). The second group corresponds to healthy donors (healthy). Blood samples were collected from the two groups of individuals and PBMCs isolated for mass cytometry analysis. (B) Pan-leukocyte mass cytometry panel, including 35 parameters, used to characterize CD32a+ CD4+
T-cell diversity in leukocytes from PBMC samples. Markers used for Spanning-tree Progression Analysis of Density-normalized Events (SPADE) clusterization of CD4+ T cells are indicated in blue. Non-SPADE clustering markers are indicated in gray.
Coindre et al. CD32a+ CD4+ T Cells in HIV Infection
These subsets of CD32a+ CD4+ TCM and TN represented an average
of 5.25 and 1.01% of HIV cART CD4+ T cells, respectively. CD32a
was also expressed on CD4+ T cells from healthy donors (Figure
S6 in Supplementary Material). In healthy donors, the proportion of CD32a+ CD4+ T cells was significantly higher among TCM than
TN (p = 0.034), similar to HIV cART patients, representing an
average of 3.37 and 1.20% of CD4+ T cells, respectively (Figure
S6 in Supplementary Material). The percentages of CD32a+ CD4+
TN, TCM, and TEff/Mem also varied in primary HIV+ patients, but the
differences were not statistically significant.
These results show that CD32a+ CD4+ T cells are present in
HIV+ patients, as well as healthy donors, and are contained within
heterogeneous populations showing naive, central memory, or effector/memory phenotypes that may be differentially affected by HIV infection.
clusters of lilra2
+cD32a
+cD4
+T cells
are More abundant in hiV-Primary
infection and after effective carT
We determined whether HIV infection was associated with specific CD32a+ CD4+ T-cell clusters by characterizing the
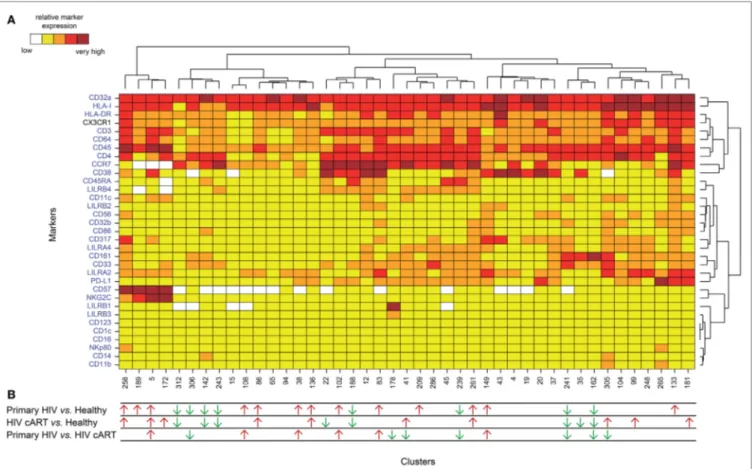
differentially abundant clusters (DACs) between two conditions, including primary HIV vs. healthy donors, HIV cART vs. healthy donors, and primary HIV vs. HIV cART (Figure 2B). DACs were identified based on their cell abundance relative to that of CD32a+
CD4+ T cells. DACs showing a significantly (p < 0.05) higher cell
proportion in each HIV+ stage (primary HIV and cART) vs.
healthy donors (red arrows) were selected for further analysis. Five DACs (#5, #258, #136, #86, and #261) were significantly more abundant in HIV+ patients in primary infection and after
cART than in healthy donors (Figures 3A,B). One, cluster #5, was also significantly (p = 0.045) more abundant in primary HIV infection than after cART (Figure 3A). This cluster displayed an activated TEff/Mem (CCR7− CD45RA− HLA-DRmid CD38+)
phenotype, expressing the activating immune-receptor LILRA2 and the high-affinity IgG receptor CD64. Cluster #5 was also characterized by the expression of CD57, which is associated with replicative senescence, NKG2C-activating receptor, and the HIV-restriction factor CD317 (also known as BST2 or Tetherin) (Figure 3A).
We also analyzed the phenotype of the four other DACs that showed statistically significant differences in abundance between HIV-infected patients and healthy donors (Figure 3B). Two (#258
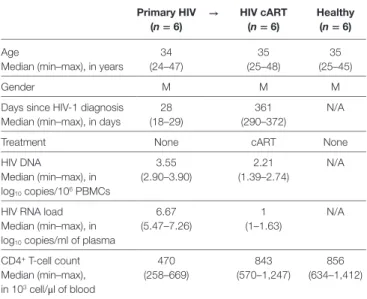
TaBle 1 | Summary of patient and subject clinical parameters. Primary hiV (n = 6) → hiV carT (n = 6) healthy (n = 6) Age 34 (24–47) 35 (25–48) 35 (25–45) Median (min–max), in years
Gender M M M
Days since HIV-1 diagnosis 28 (18–29)
361 (290–372)
N/A Median (min–max), in days
Treatment None cART None
HIV DNA 3.55 (2.90–3.90) 2.21 (1.39–2.74) N/A Median (min–max), in log10 copies/106 PBMCs
HIV RNA load 6.67
(5.47–7.26)
1 (1–1.63)
N/A Median (min–max), in
log10 copies/ml of plasma
CD4+ T-cell count 470 (258–669) 843 (570–1,247) 856 (634–1,412) Median (min–max), in 103 cell/μl of blood
Twelve Caucasian men were involved in this study to constitute two groups of individuals. These groups are composed of six primary HIV-infected patients before treatment (primary HIV) and after 12 months of combination antiretroviral therapy (HIV cART) and six healthy subjects (healthy). The gender and median patient age, days since HIV-1 diagnosis, total DNA level, RNA viral load, and CD4+ T-cell count are indicated for each group.
cART, combination antiretroviral therapy; N/A, not applicable; M, male.
portion of T cells from healthy donors were previously found to express CD32 (9–11). We thus focused on DACs that were significantly less abundant in primary HIV and cART patients than in healthy donors (Figures 3C,D).
Six DACs (#241, #162, #312, #243, #188, and #142) were significantly less abundant in all HIV+ stages than in healthy
donors (Figures 3C,D). Clusters #241 and #162 were also signifi-cantly less abundant in primary HIV infection than after cART (Figure 3C). These clusters displayed a resting TEff/Mem phenotype
(CCR7− CD45RA− HLA-DRmid CD38−) and highly expressed
CD161 (Figure 3C). Moreover, they also showed medium expres-sion of CD64, CX3CR1, and CD33 (high for cluster #241). Cluster #241 also displayed medium expression of CD317, CD32b, and CD11c (Figure 3C).
The four other DACs (#312, #243, #188, and #142) showed no statistical difference in abundance between primary HIV-infected patients before and after effective cART (Figure 3D). Two DACs, clusters #312 and #243, were associated with a resting TCM
phe-notype (CCR7+ CD45RA− HLA-DRmid CD38−), with medium
expression of CD64, CX3CR1, LILRB4, and CD33 for cluster #243 (Figure 3D). Finally, clusters #188 and #142 displayed an activated (HLA-DRmid CD38+) and resting (HLA-DRmid CD38−)
TN profile (CCR7+ CD45RA+/mid), respectively. They also showed
expression of CD64, CX3CR1, and CD33, with cluster #188 co-expressing LILRB4 and PD-L1 and cluster #142 co-co-expressing CD86, CD161, and CD14.
Our data show that the proportion of CD32a+ CD4+ T-cell
clusters with specific resting memory or resting/activated naive phenotypes in healthy donors are significantly reduced during HIV infection. In contrast to the HIV-associated subsets, these clusters showed low expression of CD64 and no expression of LILRA2. This suggests that LILRA2 expression may be associated with CD32a+
CD4+ T cells that are preferentially preserved, differentiated,
and/or expanded from primary HIV infection to the cART stage. Finally, our data also demonstrate that TEff/Mem CD32a+ LILRA2−
CD161+ clusters are less represented during primary HIV infection
than under cART and healthy conditions, suggesting that early infection induces their depletion or phenotypic modification.
cell abundance of the lilra2
+cD32a
+cD4
+T-cell cluster #5 correlates With
hiV Dna levels
The total amount of HIV DNA in PBMCs has been shown to correlate with the size of HIV reservoir (30). Therefore, we next investigated whether the abundance of CD32a+ CD4+ T cells was
associated with HIV DNA in PBMCs. There was no correlation between HIV DNA levels and the percentage of total CD32a+ cells
among CD4+ T cells (Figure S7A in Supplementary Material),
in accordance with previous studies (10, 11). Thus, we further investigated the association of HIV DNA levels with the abun-dance of cell populations at the cluster level. Correlations were based on the number of cells associated with each cluster relative to the number of cells in the parent population, corresponding, respectively, to CD32a+ CD4+ T cells or CD4+ T cells.
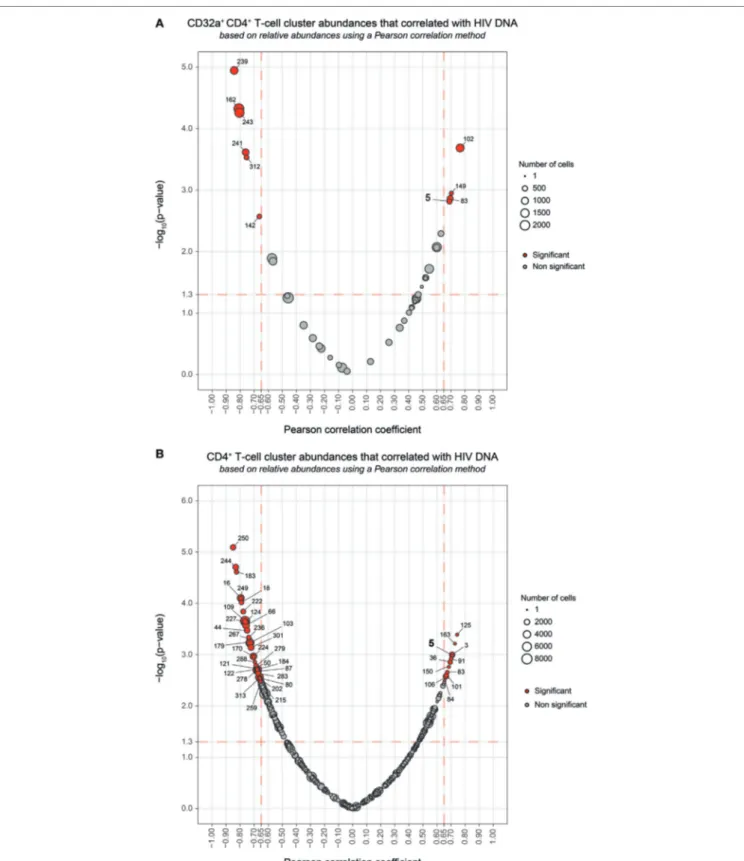
Among the CD32a+ CD4+ T-cell clusters, 10 significantly
(Pearson correlation coefficient > 0.65, p < 0.05) correlated with and #136) also displayed a TEff/Mem phenotype (CCR7− CD45RA−),
expressing LILRA2, CD64, and CX3CR1 (Figure 3B). However, cluster #258 showed an activated phenotype (HLA-DR+ CD38mid),
with co-expression of CD57, NKG2C, CD317, CD161, CD33, and CD11c, whereas cluster #136 displayed a resting profile (HLA-DRmid CD38−), with medium expression of PD-L1. Finally, cluster
#86 showed a resting TCM phenotype (CCR7mid CD45RA−
HLA-DRmid CD38−), co-expressing LILRA2, CD64, and CX3CR1, and
cluster #261 was associated with an activated TN profile (CCR7+
CD45RAmid HLA-DRmid CD38mid), co-expressing
immunomodu-latory receptors LILRA2, CD64, CX3CR1, LILRB4, CD32b, CD161, CD33, costimulatory/inhibitory molecules CD86 and PD-L1, and HIV-restriction factor CD317.
Our analysis demonstrates that specific LILRA2+ CD64+
CD32a+ CD4+ T-cell clusters, characterized by naive and memory
T-cell phenotypes, were more abundant in HIV+ patients from
the early phase of infection. Among these clusters, the activated TEff/Mem CD32a+ LILRA2+ CD57+ NKG2C+ cluster (#5) showed
a gradient of abundance which was lowest in healthy samples, higher in those undergoing cART, and highest in those with a primary HIV infection. These data suggest that the increase in the proportion of the activated TEff/Mem CD32a+ LILRA2+ CD57+
NKG2C+ subset occurred early during HIV infection and that
it remained elevated, but to a lesser extent, after effective cART.
The Proportion of the lilra2
−cD32a
+cD4
+T-cell subset is lower in Primary
hiV infection and carT stages Than in
healthy condition
We also investigated whether some clusters of CD32a+ CD4+
FigUre 2 | Phenotypic landscape and variation in cell abundance of CD32a+ CD4+ T-cell clusters from HIV-infected and healthy donor samples. (a) Heatmap
showing relative marker expression for CD32a+ CD4+ T-cell clusters. The mean of the median expression of each marker was determined and classified using a five-tiered color scale, from white (not expressed) to dark red (highly expressed), according to their range of expression (5th to 95th percentile) throughout the dataset. Clustering markers are shown in blue. Hierarchical clustering of both the cell clusters and clustering markers were performed and represented using dendrograms. (B) Chart summarizing the clusters showing significantly different cell abundances between the biological conditions [differentially abundant
clusters (DACs)]. For each comparison of corresponding DACs, red arrows indicate an increase in the abundance of the cell cluster, whereas green arrows indicate a decrease in abundance, for the left condition relative to that on the right.
Coindre et al. CD32a+ CD4+ T Cells in HIV Infection
HIV DNA levels (Figure 4A). Six were differentially abundant between HIV+ and healthy conditions (Figure 2B). Among
them, clusters for which the abundance negatively correlated with HIV DNA levels were those previously identified as rest-ing TEff/Mem #241 and #162, TCM #312 and #243, and TN #142
clusters. However, these clusters did not negatively correlate with HIV DNA levels among CD4+ T-cell clusters (Figure 4B).
Our analysis revealed only cluster #5 was differentially abundant between HIV+ and healthy conditions and positively correlated
with HIV DNA levels (Pearson correlation coefficient = 0.690,
p = 0.0015) (Figure 4; Figure S7B in Supplementary Material). This correlation was observed among both CD32a+ CD4+ and
CD4+ T-cell clusters (Figure 4). Cluster #5 also showed unique
significant differences in abundance relative to CD4+ T cells
between all conditions (Figure S8A in Supplementary Material). This activated TEff/Mem CD32a+ LILRA2+ CD57+ NKG2C+ subset
represented an average of 0.37% of primary HIV CD4+ T cells
vs. only 0.1 and 0.01% under HIV cART and healthy conditions, respectively (Figure S8A in Supplementary Material). We also determined the percentages of cells (relative to CD4+ T cells)
associated with the clusters described in Figure 3 (Figures S8B–D in Supplementary Material).
We further characterized the phenotype of this activated TEff/Mem CD32a+ LILRA2+ CD57+ NKG2C+ subset by quantifying
differences in marker expression between this subset and all CD4+
T cells by the Kolmogorov–Smirnov distance (KS) (Figure S9 in Supplementary Material). CD57 showed the highest difference between cluster #5 and the whole set of CD4+ T cells (KS = 0.9214).
The next most distant markers were CCR7 (KS = 0.6434), CD32a (KS = 0.6387), CD45 (KS = 0.5899), NKG2C (KS = 0.5892), CD38 (KS = 0.4817), HLA-I (KS = 0.4619), CD64 (KS = 0.3763), LILRB1 (KS = 0.3130), and LILRA2 (KS = 0.3036). These results are consistent with the phenotypic characterization of cluster #5 displayed in the heatmap representation (Figure 2A). Moreover, these data provide further details on the specificity of the markers associated with this cluster that could be helpful for cell sorting.
Overall, our results show that the abundance of the LILRA2+
CD32a+ CD4+ T-cell cluster, displaying an activated TEff/Mem
pheno-type and co-expressing CD57, NKG2C, and CD317 positively correlated with HIV DNA levels.
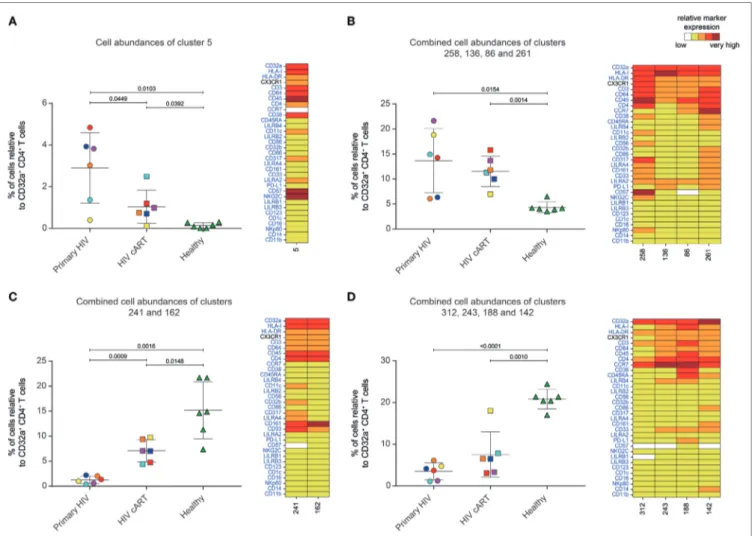
FigUre 3 | Characterization of CD32a+ CD4+ T-cell clusters showing significant differences in cell abundance for HIV+ conditions. (a) Graph showing the cell
abundance of the cluster #5 relative to CD32a+ CD4+ T cells for all samples, and heatmap representation illustrating the phenotype of this cluster. Cluster #5 was significantly more abundant under primary HIV (circle) and HIV cART (square) than healthy (triangle) conditions. This cluster was also more abundant under primary HIV than HIV cART conditions. (B) Graph showing the cell abundance of the clusters #258, #136, #86, and #261 relative to CD32a+ CD4+ T cells for all samples,
and heatmap representation of the phenotype of these clusters. These clusters were significantly more abundant under primary HIV and HIV cART than healthy conditions. (c) Graph showing the cell abundance of the clusters #241 and #162 relative to CD32a+ CD4+ T cells for all samples, and heatmap representation showing the phenotype of these clusters. Clusters #241 and #162 were significantly less abundant under primary HIV and HIV cART than healthy conditions. These clusters were also less abundant under primary HIV than HIV cART conditions. (D) Graph showing the cell abundance of the clusters #312, #243 #188, and
#142 relative to CD32a+ CD4+ T cells for all samples, and heatmap representation showing the phenotype of these clusters. These clusters were significantly less
abundant under primary HIV and HIV cART than healthy conditions. In the abundance graph representations, samples from the same HIV-infected patients were represented in the same color. For each condition, the mean cell abundance is indicated (black lines). Statistical differences between conditions were calculated using an unpaired Student’s t-test with a p-value threshold of 0.05. For heatmap representations, the relative marker expression for each cluster was indicated by a five-tiered color scale ranging from white (not expressed) to dark red (highly expressed).
DiscUssiOn
A previous study has proposed CD32a as a specific marker of CD4 T latently infected cells (7). However, CD32a was also reported on CD4+ T cells showing HIV replication and on CD4+
T cells from healthy donors; suggesting a complex relationship between HIV infection and CD32a expression on CD4+ T cells
(8–11). Here, we aimed to better characterize the heterogeneity and abundance of CD32a+ CD4+ T cells in various conditions
including primary HIV infection, cART, and healthy conditions. Indeed, CD4+ T cells include various subsets that are selectively
activated during early HIV infection, resulting in changes in
protein expression and clonal expansion. In addition, CD4+
T-cell subsets are differentially infected and killed by HIV, thus increasing the complexity of their dynamics during the infection.
High-dimensional analyses are critical for disentangling the numerous cellular and molecular events induced by HIV infec-tion. Our mass cytometry panel included typical and atypical T-cell markers that may be associated with the uncommon expression of CD32a on CD4+ T cells during HIV infection.
Moreover, all previous studies carried out flow-cytometry analy-sis using a pan anti-CD32 antibody that binds both CD32a and CD32b receptors, possibly leading to misinterpretation of the data (7, 10). We thus included antibodies that make it possible
FigUre 4 | Correlation analyses of CD32a+ CD4+ and CD4+ T-cell cluster abundances with HIV DNA levels. (a,B) Correlations were based on the number of cells
associated with each cluster relative to the number of cells in the parent population, corresponding to CD32a+ CD4+ T cells or CD4+ T cells, respectively. Clusters
having an abundance positively (right) or negatively (left) correlated with total HIV DNA levels are represented in red. The two-dimensional charts represent the association between the cell abundance and total HIV DNA for each cluster using the Pearson correlation coefficient and associated p-value. Each dot in the representation corresponds to a cell cluster. Significantly correlated clusters are indicated in red with a Pearson correlation coefficient > 0.65 and a p-value < 0.05. The size of the dot is proportional to the number of cells of the whole dataset associated with the cluster. The Pearson correlation coefficient is represented on the
X-axis and the associated p-value, shown as −log10, on the Y-axis. Cluster #5 is indicated in bold.
to clearly distinguish CD32a from CD32b isoforms (Figure S1 in Supplementary Material). Hence, our data unambiguously reflect CD4+ T cells expressing CD32a, but not CD32b, protein on their
surface (Figure 2A).
Our study showed that CD32a+ CD4+ T cells can be found not
only in HIV+ patients but also in healthy donors and encompass
heterogeneous populations. Indeed, we detected CD32a+ CD4+
T cells from HIV-infected patients and healthy donors within TCM,
TEff/Mem, and TN subsets. Under cART and healthy conditions, the
proportion of CD32a+ TCM was significantly higher than CD32a+ TN
(Figure S6 in Supplementary Material). These data are in accordance with previous reports showing CD32 expression on small subsets of CD4+ or CD8+ T cells from healthy donors (9–11). Moreover,
we also showed that some CD32a+ CD4+ T-cell subsets were more
abundant under healthy than HIV+ conditions (Figures 3C,D).
Such subsets of CD32a+ CD4+ T cells may be more prone to
deple-tion or modificadeple-tion of protein expression during HIV infecdeple-tion, resulting in the negative correlation of their abundance with total HIV-DNA levels observed in our study (Figure 4A).
We analyzed the abundance of CD32a+ CD4+ T-cell clusters
in HIV+ patients in the primary-infection phase and after
effec-tive cART and compared them with those from healthy donors (Figure 3). CD32a+ CD4+ T-cell clusters co-expressing LILRA2
and CD64 were highly represented in all HIV+ stages, in contrast
to healthy conditions. Conversely, the proportion of CD32a+ CD4+
T-cell clusters with lower CD64 and negative LILRA2 expression was higher under healthy conditions. These data suggest that LILRA2 expression may be associated with CD32a+ CD4+ T cells
that are preserved, differentiated, and/or expand in primary HIV infection and maintained after effective cART. A previous study reported that LILRA2 is expressed by monocytes and neutrophils and recognizes bacterially cleaved immunoglobulin, leading to the activation of signaling pathways and subsequent immune responses (31). Thus, CD64+ LILRA2+ CD32a+ CD4+ T-cell
popu-lations that increase in proportion during primary HIV infection and cART treatment may be more prone to activation through the engagement of CD32a, CD64, or LILRA2 activating receptors. Given that CD4+ T cells can uptake membrane fragments
dur-ing cell–cell interactions through a process named trogocytosis (32, 33), it is also possible that the expression of uncommon myeloid markers on the surface of CD32a+ CD4+ T cells could result from
intercellular membrane exchanges. Analysis of the distribution of these molecules on CD4+ T cells by confocal microscopy but also
characterization at mRNA level should be helpful to determine the implication of trogocytosis in the unusual markers found on CD32a+ CD4+ T cells.
Among LILRA2+ CD32a+ CD4+ T-cell clusters that were more
abundant in HIV+ stages, only cluster #5 was also more abundant
during primary HIV infection than during cART treatment. This cluster showed an Eff/Mem phenotype and displayed high expression of CD38, CD57, NKG2C, and CD317 restriction fac-tor for HIV that retains nascent virions at the cell surface, thus preventing their release (34). Expression of NKG2C was reported on a rare CD4+ T-cell population in pathological situations,
such as multiple sclerosis or cytomegalovirus (CMV) infection (35, 36). In addition, the expression of CX3CR1 was reported on CMV-specific CD4+ T cells in patients showing HIV-associated
atherosclerosis (37). In this regard, CMV serological status was assessed in HIV+ samples and demonstrated that patients were
already positive for IgG (but not IgM), indicating they were not in the primary stage of CMV infection. In addition, no clinical parameters associated with CMV reactivation were detected dur-ing our study, ruldur-ing-out the implication that cluster abundance modification was a result of CMV activity.
Previous studies based on classical CD4+ T-cell markers could
not detect any correlation between the percentage of CD32+ CD4+
T-cell subsets and the amount of HIV DNA (10, 11). We found a single cluster (#5) that positively correlated with HIV DNA levels, not only among the CD32a+ CD4+ T-cell clusters but also the CD4+
T-cell clusters (Figure 4; Figure S7B in Supplementary Material). These results suggest that not all CD32a+ CD4+ T cells are
associ-ated with HIV DNA, but only specific subsets, including the activated TEff/Mem CD32a+ LILRA2+ CD57+ NKG2C+ subset. The
abundance of this subset was significantly higher in HIV+ samples
than those from healthy donors and also higher in primary HIV infection than after cART. It was previously reported that the total amount of HIV DNA reflects the global HIV reservoir (30). Thus, due to its formation during the early stages of HIV infection and its maintenance under cART, this CD32a+ LILRA2+ CD57+ NKG2C+
TEff/Mem cluster displaying an activated profile may contribute to
HIV persistence as an active reservoir. However, our analysis does not directly show the presence of higher levels of HIV DNA in CD4+ T cells belonging to this cluster. Moreover, total HIV DNA
included integrated and non-integrated viral genomes coding for both competent and defective viruses. Therefore, future studies with purified CD32a+ CD4+ T cells are required to determine if
there is an enrichment with HIV DNA within this cluster and if this DNA supports viral transcription.
Our analysis also revealed that numerous CD32a+ CD4+ T-cell
clusters show expression of HLA-DR. These data are in agreement with a recent study demonstrating that a high portion of CD32+
CD4+ T cells from HIV-infected patients under cART express
HLA-DR (38). In this regard, most of the samples analyzed in our study were collected from HIV+ patients under cART, or in
early phase of HIV infection (before cART), which is associated with enhanced immune activation and high viral load. Hence, it is likely that the samples acquired from HIV+ patients may
account for the elevated number of HLA-DR+ CD32a+ CD4+
T-cell clusters found in our analysis. Moreover, concordantly with the study from Abdel-Mohsen et al., our results show that some activated, and not resting, CD32a+ CD4+ T-cell clusters positively
correlated with the level of HIV DNA (38).
In conclusion, our results unravel the landscape and abun-dance modifications of CD32a+ CD4+ T cells induced from early
HIV infection to effective cART. Overall, this study brings a new view of CD32a+ CD4+ T cells during HIV infection that could be
helpful in the discussions about HIV persistence and reservoirs.
MaTerials anD MeThODs
study subjects and ethics statements
All 12 subjects gave written informed consent to participate in the study. This study involved patients with primary HIV-1
Coindre et al. CD32a+ CD4+ T Cells in HIV Infection
infection enrolled in the French ANRS CO6 PRIMO cohort, which was approved by the Ethics Committee of Cochin Hospital. Patients were enrolled in the study if HIV infection was estimated to have occurred less than 30 days previously. All patients were antiretroviral naive and were negative for hepatitis B and C viruses. Even though the HIV+ patients show
previ-ous CMV infection (IgM−/IgG+), there were no clinical signs
of reactivation of CMV since HIV diagnosis. Blood samples were collected at enrollment. Patients were then placed under antiretroviral treatment, and 12 months later, new blood samples were collected. The plasma HIV-RNA load was measured, as well as the number of total HIV-DNA copies per million PBMCs. CD4+ T cells were also counted for each sample before and after
cART. All primary HIV-infected patients showed a viral load of fewer than 50 copies of viral RNA/ml and had more than 500 CD4+ T cells/μl of blood once under cART. This study also
involved blood samples of healthy subjects obtained from the Etablissement Français du Sang.
sample Processing and storage
PBMCs from each sample were isolated by Ficoll density gradient centrifugation. The number of viable PBMCs was determined using an automated blood counter (Vi-Cell/Beckman Coulter). Approximately 10 million PBMCs were put in a cryotube with 90% heat-inactivated FBS (Eurobio) and 10% DMSO (Sigma). All samples were stored at −150°C in cryotubes.
hiV Dna Quantification
Total HIV DNA was quantified in PBMCs by qPCR (Biocentric, Bandol, France), as previously described (39).
antibodies
Antibodies (listed in Table S1 in Supplementary Material) were either pre-conjugated from the manufacturer (Fluidigm, San Francisco, CA, USA) or conjugated in-house with the appropriate metal isotopes. Between 200 and 400 µg pure mAbs (carrier-protein- free) from various manufacturers were coupled to Lanthanide from the MaxPar Antibody Labeling Kit X8 4Rxn (Fluidigm). Conjugated Abs were adjusted to 1 µg/µl in Ab Stabilizer Solution (Candor, Biosciences, Wangen, Germany), supplemented with 0.01% sodium azide (Santa Cruz Biotechnology), and stored at 4°C. Abs conjugated in-house, as well as those obtained pre-conjugated, were titrated and validated on samples that were processed identically to those used in the study.
cell staining
All samples were stained on the same day with the same batch of antibodies and acquired within 1 day to avoid batch effects and instrument signal fluctuations. Cells were thawed, and 200 µl of the suspension containing 5 × 10⁶ PBMCs transferred
per well. PBMCs were incubated 20 min at 37°C with 1 µM Rhodium DNA-intercalator (Fluidigm). Cells were then washed twice with staining buffer (BD Biosciences) and stained with the primary surface antibody mix in a total volume of 60 µl staining buffer. Cells were incubated for 1 h at 4°C and washed twice. The secondary surface antibody mix was added to the cells in a total volume of 50 µl staining buffer and incubated
for 15 min at 4°C. After two washes, cells were resuspended in 200 µl 1.6% PFA (EMS 15710) in PBS (Invitrogen) and incubated 20 min at 4°C. Cells were then washed twice in permeabilization buffer (eBioscience) and incubated 30 min at 4°C in 200 µl permeabilization buffer with 1 µM Iridium DNA-intercalator (Fluidigm). After two washes, PBMCs were incubated at 4°C overnight in 200 µl 1.6% PFA with 0.1 µM Iridium DNA-intercalator. For acquisition, cells were washed once with staining buffer, once with PBS, and twice with ddH2O
and filtered through a cell strainer cap of a 5-ml polystyrene round-bottom tube (BD Biosciences). Fifty microliters of normalization beads (Fluidigm) were added to each sample. Then, samples were acquired using a mass cytometer (CyTOF; Fluidigm) following the standard procedure recommended by the manufacturer. An average of 207,233 ± 17,141 events was acquired per sample.
Data normalization
Raw cytometry profiles generated by CyTOF were normalized with the MatLab Compiler software normalizer (40), using the signal from the normalization beads, as recommended by the software developers.
Manual gating of cD45
+cD4
+T cells
Normalized events were gated to exclude doublets and triplets from the analysis by selecting cells with only one Iridium level. Then, beads added for normalization and dead cells were removed by selecting cells negative for Cerium (Ce140) and Rhodium, respectively. Finally, leukocytes were selected based on the posi-tive expression of CD45. CD4+ T cells were then selected based
on the expression of CD3, CD19, CD4, and CD8 (Figure S2 in Supplementary Material). After this gating strategy, an average of 28,305 ± 3,375 cells remained per sample.
automatic identification of cell clusters
The automatic identification of cell clusters was performed using SPADE with the publicly available R package. We observed large differences in the number of manually gated CD4+ T cells in each
sample, ranging from 6,864 to 53,599 cells. We avoided over-representation of cell populations present in samples with a high number of cells by first randomly selecting 6,864 cells for each sample. This number corresponded to the sample with the lowest number of cells. These uniformly down-sampled events were up-sampled at the end of the SPADE analysis to better ascertain the phenotype of identified clusters. The SPADE heatmap was generated using 32 clustering markers (shown in blue Figure 1B). CD8 and CD19 were discarded from the SPADE analysis as we used them to pre-select CD4+ T cells and CX3CR1 was not
included in the set of clustering markers due to high heterogene-ity of expression among samples. SPADE was parametrized to identify 350 cell clusters using a down-sampling parameter of 40%. These parameters were found to be the most efficient to obtain clusters with uniform phenotypes with a sufficient number of associated cells by SPADEVizR (29). Uniform clusters were defined as those with unimodal density expression (Hartigan’s dip test) and a low range of expression (IQR < 2) for all clustering markers.
Phenotypic characterization of identified
cell clusters
The phenotypic categorization of the 350 cell clusters was per-formed using SPADEVizR (29), based on the average median expression of each marker for all individuals. Marker expression was classified into five relative expression categories. The cate-gories were defined based on the range of expression (5th to 95th percentile) of each marker relative to that of CD4+ T cells.
The marker intensity ranges were then divided into five uniform categories representing negative, low, medium, high, and very high marker expression and represented using a color scale ranging from white to dark red on the heatmaps. Hierarchical clustering was computed based on the Euclidian distance, using the complete linkage method.
Clusters displaying a myeloid phenotype were identified among the 350 cell clusters and removed from the SPADE analy-sis, leaving only CD4+ T-cell clusters. In addition, clusters with
less than 40 cells were also removed from the analysis, as their phenotypes could not be assessed accurately. Thus, 322 CD4+
T-cell clusters remained from the 350 SPADE clusters. Finally, CD4+ T-cell clusters displaying high or very high expression of
CD32a (named CD32a+) were selected to perform all analyses.
Detailed phenotypic characterization of cluster five relative to other CD4+ T-cell clusters was performed using CytoCompare
(41), based on the KS, using a threshold of 0.30.
identification of Dacs and correlating
clusters
Differentially abundant clusters were identified using SPADEVizR (29), based on the percentage of cells in the clusters relative to total CD32a+ CD4+ T cells by unpaired Student’s t-tests with
a fold-change threshold of 2 and a p-value threshold of 0.05. Correlated clusters (CCs) were identified based on the percent-age of cells in clusters relative to either CD32a+ CD4+ or CD4+
T cells that correlated with total HIV DNA levels. CCs were also identified using SPADEVizR and based on the Pearson correla-tion coefficient with a threshold of 0.65 and a p-value < 0.05.
Data availability
Normalized cytometry profiles are available on the FlowRepository database through accession number FR-FCM-ZYGJ.
eThics sTaTeMenT
All 12 subjects gave written informed consent to participate in the study. This study involved patients with primary HIV-1 infection enrolled in the French ANRS CO6 PRIMO cohort, which was approved by the Ethics Committee of Cochin Hospital.
aUThOr cOnTriBUTiOns
Conceptualization: SC, A-SB, OL, RG, and BF. Methodology: SC, NT, LA, A-SB, OL, RG, and BF. Validation: SC, NT, LA, BV, CB, CG, VA-F, CL, PB, RG, A-SB, OL, and BF. Formal analysis: SC, NT, LA, VA-F, CB, CG, BV, A-SB, OL, RG, and BF. Investigation: SC, LA, NT, and BF. Resources: CG, VA-F, CL, PB, and A-SB.
Writing—original draft: SC, NT, and BF. Writing—review and editing: SC, NT, BV, CB, CG, VA-F, PB, RG, A-SB, OL, and BF. Supervision: RG, A-SB, OL, and BF.
acKnOWleDgMenTs
We thank the ANRS (French National Agency for AIDS research) CO6 PRIMO cohort for helpful collaboration and all the medical professionals involved in blood sampling at the Hôpital Kremlin-Bicêtre. We also thank Bruno Iannascoli (Institut Pasteur) for the in vitro production of anti-CD32b antibodies. This work was supported by French government “Programme d’Investissements d’Avenir” (PIA) under Grant ANR-11-INBS-0008 that fund the Infectious Disease Models and Innovative Therapies (IDMIT, Fontenay-aux-Roses, France) infrastructure and PIA grant ANR-10-EQPX-02-01 that funds the FlowCyTech facility.
sUPPleMenTarY MaTerial
The Supplementary Material for this article can be found online at https://www.frontiersin.org/articles/10.3389/fimmu.2018.01217/ full#supplementary-material.
FigUre s1 | Characterization of CD32a and CD32b antibody specificity by
mass cytometry. Representative analysis of metal-conjugated CD32a-Dy161 (upper panels) and CD32b-Sm149 (lower panels) antibody staining of monocytes, B cells, and CD4+ T cells performed on PBMCs from one
healthy donor (out of six) using FlowJo software.
FigUre s2 | Gating strategy used to identify CD4+ T cells. “Singlets” were identified using cell length vs. Ir191-DNA intercalator and calibration beads were excluded (cells no beads). Living leukocytes were identified by selecting Rhodium (Rh103)Di-negative cells and then CD45+ cells. Finally, CD4+ T cells
were identified by gating on CD3+ CD19− and then CD4+ CD8− cells.
FigUre s3 | Phenotypic landscape of CD4+ T-cell Spanning-tree Progression
Analysis of Density-normalized Events (SPADE) clusters. A heatmap showing relative marker expression for SPADE clusters was generated. The mean of the median expression of each marker was determined and classified in a five-tiered color scale, from white (not expressed) to dark red (highly expressed), according to their range of expression (5th to 95th percentile) throughout the dataset. Clustering markers are shown in blue. Hierarchical clustering of both the cell clusters and clustering markers were performed and are represented by dendrograms.
FigUre s4 | Relative range of marker expression of Spanning-tree Progression
Analysis of Density-normalized Events clusters. Graph showing the relative range of marker expression of clusters obtained after manual gating of CD4+ T cells. The range of expression for each marker (5th to 95th percentiles of expression throughout the dataset) are represented using a five-tiered color scale ranging from white (not expressed) to dark red (highly expressed). Clustering markers are shown in blue.
FigUre s5 | Cell number in each CD32a+ CD4+ T-cell cluster. This
representation shows the number of cells associated with each CD32a+ CD4+
T-cell cluster, regardless of sample cell origin. Cluster names are indicated on the
X-axis and the corresponding number of cells on the Y-axis. The size of the dots
is proportional to the number of cells in the cluster.
FigUre s6 | Percentages of CD32a+ CD4+ TN, TCM, and TEff/Mem subsets among
CD4+ T cells from HIV-infected patients and healthy donors. This representation
shows the percentage of naive (TN), central memory (TCM), and effector/memory
(TEff/Mem) CD4+ T cells among CD32a+ CD4+ T cells for primary HIV-infected
patients before (primary HIV, red circles) and after 12 months of combination antiretroviral treatment (HIV cART, blue squares) and that of healthy donors (healthy, green triangles).
Coindre et al. CD32a+ CD4+ T Cells in HIV Infection
FigUre s7 | Correlation analysis of total CD32a+ CD4+ T-cell cluster and cluster
#5 cell abundances with HIV DNA levels. (a) Correlation analysis of total CD32a+
CD4+ T-cell cluster cell abundances with total HIV DNA levels. The HIV DNA load (log10 copies/106 PBMCs) for each sample are indicated on the X-axis, and the
associated percentage of cells relative to CD4+ T cells for CD32a+ CD4+ T-cell
clusters on the Y-axis. The Pearson correlation coefficient was equal to 0.4329 (p = 0.0727). (B) Correlation analysis between cluster #5 cell abundance and HIV DNA levels. For each sample, the HIV DNA load (log10 copies/106 PBMCs)
is indicated on the X-axis, and associated percentage of cells relative to CD32a+
CD4+ T cells for cluster #5 on the Y-axis. The Pearson correlation coefficient was equal to 0.6902 (p = 0.0015).
FigUre s8 | Percentages of cells associated with clusters #5, #258, #136,
#86, #261, #241, #162, #312, #243, #188, and #142 among CD4+ T cells in
HIV-infected patients and healthy donors. (a–D) Graphs showing the cell
abundance relative to that of CD4+ T cells for clusters previously shown to be
differentially abundant between HIV-infected patients (primary HIV and HIV cART) and healthy donors (healthy) among CD32a+ CD4+ T cells. (a,B) Clusters
#5, #258, #136, #86, and #261 were significantly more abundant in Primary HIV (circle) and HIV cART (square) than Healthy (triangle) samples among CD32a+
CD4+ T cells. Cluster #5 was also more abundant in primary HIV than in HIV
cART samples among CD32a+ CD4+ T cells. (c,D) Clusters #241, #162, #312,
#243, #188, and #142 were significantly less abundant in primary HIV (circle) and HIV cART (square) than in healthy (triangle) samples among CD32a+ CD4+
T cells. Clusters #241 and #162 were also less abundant in primary HIV than in HIV cART samples among CD32a+ CD4+ T cells. Samples from the same
HIV-infected patients are shown in the same color. For each condition, the mean cell abundance is indicated (black lines). Statistical differences between conditions were calculated using an unpaired Student’s t-test with a p-value threshold of 0.05.
FigUre s9 | Marker expression densities showing the phenotypic specificity of
cluster #5 relative to whole CD4+ T-cell clusters. The expression densities of all
clustering markers and CX3CR1 are shown for cluster #5 and whole CD4+ T-cell clusters. The marker expression densities for cluster #5 are shown in blue whereas the marker expression densities for all CD4+ T-cell clusters are shown in
gray. The differences between marker expression densities were quantified using the Kolmogorov–Smirnov distances (KS).
TaBle s1 | Overview of the mass cytometry panel. The metal, antigen, clone,
isotype, and supplier are indicated for each antibody. Non-clustering markers are indicated by a star.
reFerences
1. Murphy EL, Collier AC, Kalish LA, Assmann SF, Para MF, Flanigan TP, et al. Highly active antiretroviral therapy decreases mortality and morbidity in patients with advanced HIV disease. Ann Intern Med (2001) 135:17–26. doi:10.7326/0003-4819-135-1-200107030-00005
2. Palella FJ, Delaney KM, Moorman AC, Loveless MO, Fuhrer J, Satten GA, et al. Declining morbidity and mortality among patients with advanced human immunodeficiency virus infection. N Engl J Med (1998) 338:853–60. doi:10.1056/NEJM199803263381301
3. Rothenberger MK, Keele BF, Wietgrefe SW, Fletcher CV, Beilman GJ, Chipman JG, et al. Large number of rebounding/founder HIV variants emerge from multifocal infection in lymphatic tissues after treatment interruption. Proc Natl Acad Sci U S A (2015) 112:E1126–34. doi:10.1073/ pnas.1414926112
4. Fischer M, Hafner R, Schneider C, Trkola A, Joos B, Joller H, et al. HIV RNA in plasma rebounds within days during structured treatment interruptions.
AIDS (2003) 17:195–9. doi:10.1097/00002030-200301240-00009
5. Chun TW, Finzi D, Margolick J, Chadwick K, Schwartz D, Siliciano RF. In vivo fate of HIV-1-infected T cells: quantitative analysis of the transition to stable latency. Nat Med (1995) 1:1284–90. doi:10.1038/nm1295-1284
6. Chun TW, Carruth L, Finzi D, Shen X, DiGiuseppe JA, Taylor H, et al. Quantification of latent tissue reservoirs and total body viral load in HIV-1 infection. Nature (1997) 387:183–8. doi:10.1038/387183a0
7. Descours B, Petitjean G, López-Zaragoza J-L, Bruel T, Raffel R, Psomas C, et al. CD32a is a marker of a CD4 T-cell HIV reservoir harbouring replication- competent proviruses. Nature (2017) 543:564–7. doi:10.1038/nature21710 8. Grau-Expósito J, Serra-Peinado C, Miguel L, Navarro J, Curran A, Burgos J,
et al. A novel single-cell FISH-flow assay identifies effector memory CD4 +
T cells as a major niche for HIV-1 transcription in HIV-infected patients.
MBio (2017) 8:e00876–17. doi:10.1128/mBio.00876-17
9. Roederer M, Quaye L, Mangino M, Beddall MH, Mahnke Y, Chattopadhyay P, et al. The genetic architecture of the human immune system: a bioresource for autoimmunity and disease pathogenesis. Cell (2015) 161:387–403. doi:10.1016/ j.cell.2015.02.046
10. Martin GE, Pace M, Thornhill JP, Phetsouphanh C, Meyerowitz J, Gossez M, et al. CD32-expressing CD4 T cells are phenotypically diverse and can contain proviral HIV DNA. Front Immunol (2018) 9:928. doi:10.3389/fimmu.2018.00928 11. Wittner M, Dunay GA, Kummer S, Bockhorn M, Hüfner A, Schmiedel S,
et al. Cd32 expression of different memory T cell subpopulations in the blood and lymph nodal tissue of HIV patients and healthy controls correlates with immune activation. J Acquir Immune Defic Syndr (2017) 77(4):345–9. doi:10.1097/QAI.0000000000001622
12. Chomont N, El-Far M, Ancuta P, Trautmann L, Procopio FA, Yassine-Diab B, et al. HIV reservoir size and persistence are driven by T cell survival and homeostatic proliferation. Nat Med (2009) 15:893–900. doi:10.1038/ nm.1972
13. Corneau A, Cosma A, Even S, Katlama C, Le Grand R, Frachet V, et al. Comprehensive mass cytometry analysis of cell cycle, activation, and coinhibitory receptors expression in CD4 T cells from healthy and HIV-infected individuals. Cytometry B Clin Cytom (2017) 92:21–32. doi:10.1002/ cyto.b.21502
14. Akula S, Mohammadamin S, Hellman L. Fc receptors for immunoglobulins and their appearance during vertebrate evolution. PLoS One (2014) 9:e96903. doi:10.1371/journal.pone.0096903
15. Bruhns P, Jönsson F. Mouse and human FcR effector functions. Immunol Rev (2015) 268:25–51. doi:10.1111/imr.12350
16. Anfossi N, Doisne J-M, Peyrat M-A, Ugolini S, Bonnaud O, Bossy D, et al. Coordinated expression of Ig-like inhibitory MHC class I receptors and acquisition of cytotoxic function in human CD8+ T cells. J Immunol (2004) 173:7223–9. doi:10.4049/jimmunol.173.12.7223
17. Lombardelli L, Aguerre-Girr M, Logiodice F, Kullolli O, Casart Y, Polgar B, et al. HLA-G5 induces IL-4 secretion critical for successful pregnancy through differential expression of ILT2 receptor on decidual CD4+ T cells and macro-phages. J Immunol (2013) 191:3651–62. doi:10.4049/jimmunol.1300567 18. Lesport E, Baudhuin J, Sousa S, LeMaoult J, Zamborlini A, Rouas-Freiss N,
et al. Inhibition of human Vγ9Vδ2 T-cell antitumoral activity through HLA-G: implications for immunotherapy of cancer. Cell Mol Life Sci (2011) 68:3385–99. doi:10.1007/s00018-011-0632-7
19. Baudhuin J, Migraine J, Faivre V, Loumagne L, Lukaszewicz A-C, Payen D, et al. Exocytosis acts as a modulator of the ILT4-mediated inhibition of neutro-phil functions. Proc Natl Acad Sci U S A (2013) 110:17957–62. doi:10.1073/ pnas.1221535110
20. Colonna M, Samaridis J, Cella M, Angman L, Allen RL, O’Callaghan CA, et al. Human myelomonocytic cells express an inhibitory receptor for classical and nonclassical MHC class I molecules. J Immunol (1998) 160:3096–100. 21. Fanger NA, Cosman D, Peterson L, Braddy SC, Maliszewski CR, Borges L.
The MHC class I binding proteins LIR-1 and LIR-2 inhibit Fc receptor- mediated signaling in monocytes. Eur J Immunol (1998) 28:3423–34. doi:10.1002/ (SICI)1521-4141(199811)28:11<3423::AID-IMMU3423>3.0.CO;2-2 22. Favier B. Regulation of neutrophil functions through inhibitory receptors:
an emerging paradigm in health and disease. Immunol Rev (2016) 273:140–55. doi:10.1111/imr.12457
23. Bashirova AA, Martin-Gayo E, Jones DC, Qi Y, Apps R, Gao X, et al. LILRB2 interaction with HLA class I correlates with control of HIV-1 infection. PLoS
Genet (2014) 10:e1004196. doi:10.1371/journal.pgen.1004196
24. Huang J, Goedert JJ, Sundberg EJ, Cung TDH, Burke PS, Martin MP, et al. HLA-B*35-Px-mediated acceleration of HIV-1 infection by increased inhibi-tory immunoregulainhibi-tory impulses. J Exp Med (2009) 206:2959–66. doi:10.1084/ jem.20091386
25. Huang J, Burke PS, Cung TDH, Pereyra F, Toth I, Walker BD, et al. Leukocyte immunoglobulin-like receptors maintain unique antigen-presenting proper-ties of circulating myeloid dendritic cells in HIV-1-infected elite controllers.
26. Alaoui L, Palomino G, Zurawski S, Zurawski G, Coindre S, Dereuddre-Bosquet N, et al. Early SIV and HIV infection promotes the LILRB2/MHC-I inhibitory axis in cDCs. Cell Mol Life Sci (2017) 75:1871–87. doi:10.1007/ s00018-017-2712-9
27. Krastinova E, Lecuroux C, Leroy C, Seng R, Cabie A, Rami A, et al. High soluble CD14 levels at primary HIV-1 infection predict more rapid disease progression. J Infect Dis (2015) 212:909–13. doi:10.1093/infdis/jiv145 28. Qiu P, Simonds EF, Bendall SC, Gibbs KD, Bruggner RV, Linderman MD, et al.
Extracting a cellular hierarchy from high-dimensional cytometry data with SPADE. Nat Biotechnol (2011) 29:886–91. doi:10.1038/nbt.1991
29. Gautreau G, Pejoski D, Le Grand R, Cosma A, Beignon A-S, Tchitchek N. SPADEVizR: an R package for visualization, analysis and integration of SPADE results. Bioinformatics (2016) 33:779–81. doi:10.1093/bioinformatics/btw708 30. Avettand-Fènoël V, Hocqueloux L, Ghosn J, Cheret A, Frange P, Melard A, et al.
Total HIV-1 DNA, a marker of viral reservoir dynamics with clinical implica-tions. Clin Microbiol Rev (2016) 29:859–80. doi:10.1128/CMR.00015-16 31. Hirayasu K, Saito F, Suenaga T, Shida K, Arase N, Oikawa K, et al. Microbially
cleaved immunoglobulins are sensed by the innate immune receptor LILRA2.
Nat Microbiol (2016) 1:16054. doi:10.1038/nmicrobiol.2016.54
32. Zhou G, Ding Z-C, Fu J, Levitsky HI. Presentation of acquired peptide-MHC class II ligands by CD4+ regulatory T cells or helper cells differentially regu-lates antigen-specific CD4+ T cell response. J Immunol (2011) 186:2148–55. doi:10.4049/jimmunol.1002917
33. Joly E, Hudrisier D. What is trogocytosis and what is its purpose? Nat Immunol (2003) 4:815–815. doi:10.1038/ni0903-815
34. Neil SJD, Zang T, Bieniasz PD. Tetherin inhibits retrovirus release and is antag-onized by HIV-1 Vpu. Nature (2008) 451:425–30. doi:10.1038/nature06553 35. Zaguia F, Saikali P, Ludwin S, Newcombe J, Beauseigle D, McCrea E, et al.
Cytotoxic NKG2C+ CD4 T cells target oligodendrocytes in multiple sclerosis.
J Immunol (2013) 190:2510–8. doi:10.4049/jimmunol.1202725
36. Guma M, Angulo A, Vilches C, Gómez-Lozano N, Malats N, López-Botet M. Imprint of human cytomegalovirus infection on the NK cell receptor reper-toire. Blood (2004) 104:3664–71. doi:10.1182/blood-2004-05-2058
37. Sacre K, Hunt PW, Hsue PY, Maidji E, Martin JN, Deeks SG, et al. A role for cytomegalovirus-specific CD4+CX3CR1+ T cells and cytomegalovirus- induced T-cell immunopathology in HIV-associated atherosclerosis. AIDS (2012) 26:805–14. doi:10.1097/QAD.0b013e328351f780
38. Abdel-Mohsen M, Kuri-Cervantes L, Grau-Exposito J, Spivak AM, Nell RA, Tomescu C, et al. CD32 is expressed on cells with transcriptionally active HIV but does not enrich for HIV DNA in resting T cells. Sci Transl Med (2018) 10:eaar6759. doi:10.1126/scitranslmed.aar6759
39. Avettand-Fènoël V, Chaix M-L, Blanche S, Burgard M, Floch C, Toure K, et al. LTR real-time PCR for HIV-1 DNA quantitation in blood cells for early diag-nosis in infants born to seropositive mothers treated in HAART area (ANRS CO 01). J Med Virol (2009) 81:217–23. doi:10.1002/jmv.21390
40. Finck R, Simonds EF, Jager A, Krishnaswamy S, Sachs K, Fantl W, et al. Normalization of mass cytometry data with bead standards. Cytometry A (2013) 83:483–94. doi:10.1002/cyto.a.22271
41. Platon L, Pejoski D, Gautreau G, Targat B, Le Grand R, Beignon A-S, et al. A computational approach for phenotypic comparisons of cell populations in high-dimensional cytometry data. Methods (2018) 132:66–75. doi:10.1016/j. ymeth.2017.09.005
Conflict of Interest Statement: The authors declare that the research was con-ducted in the absence of any commercial or financial relationships that could be construed as a potential conflict of interest.
Copyright © 2018 Coindre, Tchitchek, Alaoui, Vaslin, Bourgeois, Goujard, Avettand-Fenoel, Lecuroux, Bruhns, Le Grand, Beignon, Lambotte, Favier and The ANRS CO6 PRIMO Cohort. This is an open-access article distributed under the terms of the Creative Commons Attribution License (CC BY). The use, distribution or reproduction in other forums is permitted, provided the original author(s) and the copyright owner are credited and that the original publication in this journal is cited, in accordance with accepted academic practice. No use, distribution or reproduction is permitted which does not comply with these terms.