HAL Id: halshs-02495652
https://halshs.archives-ouvertes.fr/halshs-02495652
Preprint submitted on 2 Mar 2020
HAL is a multi-disciplinary open access archive for the deposit and dissemination of sci-entific research documents, whether they are pub-lished or not. The documents may come from teaching and research institutions in France or abroad, or from public or private research centers.
L’archive ouverte pluridisciplinaire HAL, est destinée au dépôt et à la diffusion de documents scientifiques de niveau recherche, publiés ou non, émanant des établissements d’enseignement et de recherche français ou étrangers, des laboratoires publics ou privés.
Who benefits from tax incentives? The heterogeneous
wage incidence of a tax credit
Clément Carbonnier, Clément Malgouyres, Loriane Py, Camille Urvoy
To cite this version:
Clément Carbonnier, Clément Malgouyres, Loriane Py, Camille Urvoy. Who benefits from tax incen-tives? The heterogeneous wage incidence of a tax credit. 2020. �halshs-02495652�
WORKING PAPER N° 2020 – 08
Who benefits from tax incentives?
The heterogeneous wage incidence of a tax credit
Clément Carbonnier Clément Malgouyres
Loriane Py Camille Urvoy
JEL Codes: D22, H25, H32
Who benefits from tax incentives?
The heterogeneous wage incidence of a tax credit
∗
Cl´ement Carbonnier
†Cl´ement Malgouyres
‡Loriane Py
§Camille Urvoy
¶February 29, 2020
Abstract
Do workers gain from lower business taxes, and why? We estimate how a large French corporate income tax credit is passed on to wages and explore the firm- and employee-level underlying mechanisms. The amount of tax credit firms get depends on their payroll share of workers paid less than a wage threshold. Exposure to the policy thus varies both across workers depending on their wage and across firms depending on their wage structure. Using exhaustive employer-employee data, we find that half of the surplus generated by the reform falls onto workers. Wage gains load on incumbents in high-skill occupations. The wage earnings of low-skill workers – nearly all individually eligible – do not change. This heterogeneous wage incidence is unlikely to be driven by scale effects or skill complementarities. We find that the groups of workers benefiting from wage gains are also more likely to continue working for the same firm. Further, we show that firms do not change their wage-setting behavior in response to the individual el-igibility status of workers as there is no bunching in the distribution of entrants’ wages. Overall, our results suggest that the wage incidence of firm taxation oper-ates collectively through rent-sharing and benefits workers most costly to replace.
Keywords: business taxation; tax incentives; wage incidence; rent sharing
JEL codes:D22, H25, H32
Declaration of interests:None.
∗A previous version of this paper was circulated under the title: “Wage Incidence of a Large
Corpo-rate Tax Credit: Contrasting Employee- and Firm-Level Evidence”. We are gCorpo-rateful to Antoine Bozio, Thomas Breda, Michael Devereux, Marc Ferracci, Denis Foug`ere, Sergei Guriev, Camille Landais, Eti-enne Lehmann, Philippe Martin, Thierry Mayer, Benoit Ourliac, Bruno Palier, Thomas Piketty, Em-manuel Saez, Sebastian Siegloch, Etienne Wasmer and participants at AFSE, RES, EALE, LAGV, PET, IIPF, EEA conferences, IEB workshop on economics of taxation, PSE and Le Mans seminars for their comments. We also thank agents at CASD, Insee, DGFiP, ACOSS and Douanes for helping us with the data. This work is supported by public grants overseen by the French National Research Agency (ANR) as part of the “Investissements d’avenir” program within the frameworks of the Centre d’acc`es s´ecuris´e aux donn´ees - CASD (10-EQPX-17) and the LIEPP center of excellence (11-LABX-0091, ANR-11-IDEX-0005-02) and by France Strategie. Malgouyres acknowleges financial support from the ANR through project ANR-19-CE26-0004. The views expressed in this paper do not necessarily reflect those of the Banque de France or the Eurosystem.
†Universit´e de Cergy-Pontoise, THEMA; Sciences Po, LIEPP; Banque de France
‡Institut des politiques publiques
§Banque de France; Institut des politiques publiques
1
Introduction
In a context of growing fiscal competition between governments, many policymakers attempt to stimulate economic activity, create jobs and boost wages using business tax incentives. Over the past decades, many advanced economies have decreased firms’ tax burden by cutting tax rates,1 or through targeted tax incentives such as tax cred-its that link fiscal expenditures with specific firm outcomes.2 The 2017 Tax Cuts and Jobs Act is a recent illustration of this phenomenon that has brought attention on the distributional consequences of tax incentives, and in particular on whether it benefits workers.
Yet, while the literature has documented some wage gains for workers as a group, little is known about which workers benefit from these tax incentives (Slattery and Zidar, 2020). Auerbach(2018) stresses that the recent growth in earnings inequalities compels an investigation into the distribution of the business taxation burden across workers. Does tax policy incidence vary across groups of workers? And if so, is it influenced directly by the design of the policy – which might be targeting a subset of workers – or by other mechanisms?
In this paper, we contribute to answer this question by studying the wage impact of a large French corporate income tax credit and by investigating the underlying worker and firm-level mechanisms. This tax credit is proportional to the payroll share of em-ployees paid less than a wage threshold. The policy thus creates variation across work-ers – depending on which side of the wage threshold they fall – and across firms – depending on their wage structure which determines the size of the overall windfall. The design of the policy thus provides a unique opportunity to disentangle the role of individual eligibility from firm-level mechanisms in shaping the pass-through of business taxes into wages.
First, we estimate at the firm-level that around half of the tax credit falls onto work-ers through higher wages. Yet, the wage incidence is not uniform within the firm: high-skill workers benefit from higher wages, low-skill workers do not. We then show that the tax credit does not affect relative employment share by skill-level. The dis-tributive effect we uncover is thus unlikely to be driven by complementarity with
1Corporate income tax rates in most advanced economies have experienced downward trends. The
2017 Tax Cuts and Jobs Act reduced the US statutory corporate income tax rate from 35% to 21%, con-tinuing the decline in the effective tax rate over the past 25 years. Similar downward trends of corporate
income tax rates are under way in Europe (Auerbach,2018).
2Firm-specific and targeted tax incentives are numerous and have large budgetary impacts. Serrato
and Zidar(2018) document that tax base rules and credits explain more of the variation in state
corpo-rate tax revenues than tax corpo-rates do.Slattery and Zidar(2020) show that in 2014, tax incentives for firms
in the form of firm-specific subsidies and general tax credits amounted to nearly 40% of state corporate tax revenues in the United States. In France, corporate income tax credits – incentivizing a host of ac-tivities, from R&D to charities etc – accounted for about 43% of gross CIT income in 2015, including the policy we study in this paper.
low-skill workers, but rather points at firm-level surplus sharing. We then show that worker-level eligibility does not drive the distributive effect of the tax credit. We find no bunching in the distribution of new hires’ wages near the threshold: firms did not hire more eligible workers eligible. Overall, our results suggest that part of the policy surplus is collectively shifted onto groups of workers through rent-sharing, a process that benefits mainly groups of workers with more bargaining power. We find a signifi-cant raise in the workforce retention rate – the share of workers who remain employed in the same firm – for high-skill workers who alone benefit from wage increases. It suggests that cost of replacement might be an important driver of bargaining power.
The tax credit we study, labelled as CICE,3 provides a quasi-natural experiment
allowing to identify the distributive effects of tax incentives and to understand their underlying mechanisms. First, as mentioned above, the design of the policy is such that the amount of tax credit firms get is a fraction of the sum of gross wages of workers paid less than 2.5 times the minimum wage. It thus conveniently creates variation not only across otherwise similar workers on both sides of the eligibility cut-off, but also across firms with different wage structures around the threshold. Next, the policy and its distinct features were not anticipated. The tax credit was implemented starting in 2013 based on a law voted in December 2012 supported by a government elected in May 2012. It applied to all firms and jobs, whether pre-existing or newly created. Take-up by firms was quick and large as dedicated features were rapidly added to common accounting software packages. It resulted in a large fiscal expenditure. In 2015, it amounted to 18 billion euros, which is almost 30 percent of gross corporate income tax revenues.4
We combine several administrative data sets to investigate the wage and employ-ment effects of this policy. First, we use firm-level administrative data on the amount of tax credit each firm received under the CICE policy. Second, we use matched employer-employee data on the universe of French private sector employees, provid-ing rich information on the wages and hours worked. We finally use tax return data on the financial results of firms that obtained tax credits. We can thus conduct several em-pirical analyses, both at the firm- and at the worker-level, to study the distributional impact of this tax credit.
In the first step of our analysis, we study the wage incidence of the tax credit at the firm-level. We identify the causal link between firms’ mean hourly wage and the tax credit by exploiting the discontinuity in the schedule: firm-specific decreases in taxes are proportional to payroll share of employees paid less than 2.5 times the minimum
3CICE stands for Cr´edit d’Impˆot pour la Comp´etitivit´e et l’Emploi in French or Competitiveness and
Employment Tax Credit.
4Gross corporate income tax revenues refer to the corporate income tax revenues before tax credits,
with the CICE being the largest corporate income tax credit, which corresponded in 2015 to a fiscal expenditure of 271 euros per French individual.
wage.5 To isolate the firm-specific variation that directly stems from this worker-level
discontinuity, we compare, in an augmented difference-in-differences framework, the wage policy of firms that have similar pre-reform wage distributions, except immedi-ately around the eligibility cut-off. To provide support for our identification strategy, we document that, within groups of similar firms, variation in policy exposure re-mains large6 and is nearly as good as random as treatment intensity is uncorrelated with a series of pre-reform observable firms’ characteristics.
We find a significant firm-level incidence of the tax credit on wages that unfolds gradually over time. More particularly, a 1 percentage point increase in the tax credit rate translates into a 0.5% increase in the mean hourly wage at the firm level. It sug-gests that 50% of the tax credit goes to workers. The magnitude of our estimate is in line with a recent body of work measuring the incidence of corporate income taxes using other sources of variation (Arulampalam et al.,2012; Su´arez Serrato and Zidar,
2016;Fuest et al.,2018). This result is robust to alternative specifications.
Next, we show that while the policy caused wage gains on average, the firm-level wage incidence markedly differs across workers. The tax credit increases the wages of high-skill workers but has no impact on low-skill employees’. This distributional effect is particularly striking as it is at odds with the policy’s targeting. In other words, low-skill workers, who are virtually all eligible, benefit from no wage increase while high-skill employees, who are less likely to be eligible, benefit from higher wages. The policy thus increases within-firm wage earnings inequalities. We also find that only incumbent employees benefit from wage gains, not entrants. These results suggest that the surplus generated by the policy is shared within the firm differently across groups of workers.
Further, we find no discernible effect of the tax policy on firm-level employment, nor on sales; firms do not expand, suggesting wage gains are not driven by scale ef-fects. There are no employment effects in both skill groups: the heterogeneity in pol-icy’s pass-through effects is not driven by skill complementarity. As such, standard labor market mechanisms do not seem to provide an adequate framework for our findings.
The second part of our analysis considers worker-level incidence. We explore whether the individual eligibility status of workers impacts the policy pass-through. Canonical competitive labor market models predict that wages adjust through market mechanisms. Labor demand being more elastic than labor supply, the change in labor cost generated by the tax reform should be passed on to eligible workers’ wages. The
5Henceforth we refer to employees paid less than 2.5 times the minimum wage as eligible employees
for simplicity.
6In other words, due to the notch, among firms with similar wage distribution around the eligibility
threshold, local differences in the share of workers right below or above that threshold can translate into substantial differences in the degree of exposure to the policy.
notch in the reform schedule implies a sharp discontinuity in the labor cost of workers on both sides of the wage threshold. Labor demand for eligible workers should there-fore immediately adjust. To formally test for this mechanism, we build on the bunch-ing methodology developed by Kleven and Waseem (2013) and Chetty et al. (2011) and test for the presence of an excess mass of new hires paid just below the eligibility cut-off. We graphically document an absence of bunching both before and after the reform. This finding does not result from downward wage rigidity. Complementary estimations corroborate this result, thus invalidating the idea that firms reacted to the tax reform by increasing their demand for eligible employees.
Overall, our findings point to a substantial firm-level incidence of the tax reform on wages that spills over onto ineligible workers together with an absence of adjust-ment to the policy through employee-level mechanisms. A similar pattern has been documented in a different policy environment bySaez et al.(2019) who study Swedish payroll tax cut targeting young workers.7 These results can be rationalized as follow: first, the tax reform generates firm-specific surpluses that are shared across capital-owners and groups of employees through rent-sharing, which provides a rationale for treatment spilling over onto ineligible workers. Next, within groups of workers, in-cidence is collective, which explains the absence of employee-level response. Wage incidence however vastly differs across groups of workers. A potential explanation is that employers increase the wage of employees most costly to replace, here high-skill incumbents, in order to retain them (Kline et al.,2019). In line with this hypothesis, we document that the policy increased the workforce retention rate of high-skill workers but not that of low-skill workers.
Related literature. Our paper contributes to several bodies of research. First, we con-tribute to the literature studying the incidence of business taxes on wages by causally documenting a sizable impact of a tax reform on wages. We find that around 50% of the surplus generated by the tax credit is shifted onto workers. The magnitude of this effect is in line with a growing literature on corporate income taxes that finds that labor bears between 30% and 50% of the tax burden. Papers in this literature have exploited several types of variation in corporate income tax rates: variation across industries (Liu and Altshuler,2013), across US states (Su´arez Serrato and Zidar,2016), across Ger-man municipalities (Fuest et al.,2018), across European or OECD countries in Europe (Arulampalam et al., 2012; Az´emar and Hubbard, 2015). We leverage a nation-wide policy in France, ruling out within-country firm or labor mobility as important drivers
7They conclude to the absence of wage incidence at the employee level along the age eligibility
threshold, but find evidence of firm-level rent-sharing as firms benefiting more intensely from the re-form increase wages for both eligible (young) and ineligible (old) workers.
of our results. Moreover, we compare firms belonging to the same narrowly-defined industry.
By documenting the heterogeneous incidence of this reform across occupational groups of workers, we also address the shortcoming pointed out byAuerbach(2018), who stressed that most papers have so far implicitly considered wage earners as a “monolithic group”. We show that the tax credit essentially benefited skilled workers, suggesting heterogeneity in occupation is indeed a crucial element. Fuest et al.(2018) study changes in local business tax rates and investigate heterogeneity across groups of workers as well. They find that low-skill workers were the most penalized by tax increases. We discuss how our results relate to theirs in greater details in Section6.
Second, although the tax credit we study defines eligibility at the employee level, the surplus generated by the reform is mainly passed on to wages at the firm-level. This finding challenges canonical models of tax incidence that posit that tax incidence is driven by market level mechanisms impacting workers’ wages individually (see
Anderson and Meyer, 1997, section 2). We contribute to a burgeoning strand of the literature documenting that firm-level mechanisms, rather than individual eligibility, play a key role in shaping tax incidence on wages. For instance,Bosch and Micevska-Scharf(2017) andBozio et al. (2017a) conclude to the absence of payroll tax wage in-cidence at the employee-level.8 Our findings are most closely related to Saez et al.
(2019), who study a payroll tax cut targeted at young workers in Sweden. They un-cover an absence of individual-level incidence while evidencing a substantial wage incidence at the firm-level. Where the windfall generated by the reform was largest, nearly all workers benefited from wage increases. We rely on a corporate income tax credit whose amount depends on employees’ eligibility determined individually ac-cording to their wage. UnlikeSaez et al.(2019), we detect no employment effect due to the reform. We can therefore rule out that the increase in high-skill workers’ wages is driven by complementarities with low-income, low-skill workers. These results thus further strengthen the case for a bargaining mechanism. Overall, our work shows that a policy whose legal targeting is progressive ends up benefiting higher-wage workers through rent-sharing. This highlights the need to finely understand the role firms have in shaping primary inequalities in order to predict the redistributive effect of business tax reform.
Finally, our paper relates to the strand of literature in labor economics highlighting the role of firms in shaping labor market inequalities (Card et al.,2018). We contribute to this literature by estimating how a tax reform generating a profit windfall is
par-8In a recent article,Bozio et al.(2017b) find that the wage incidence of social security contributions
in France depends on tax-benefit linkages: there is no effect on net earnings of an increase in health and family contributions – with no contributory link between contributions and benefits – while the incidence of pension contributions – with a clear contributory link – largely falls on workers. The tax credit we analyze in this paper has no contributory link.
tially shifted onto workers’ wages. Most papers so far have used observational varia-tion in productivity (Guiso et al., 2005) or quasi-experimental research design relying on proxies likely to affect the rents earned by the firm, such as idiosyncratic demand shocks (Garin and Silv´erio, 2019) or patents (Kline et al., 2019). Most closely related to our paper is Howell and Brown (2019) who study how the R&D grants to small firms affects wages. They find that R&D grants lead to an increase in wages that is too large to be fully explained by firm growth, thus suggesting rent sharing is tak-ing place. Like them, we find positive wage effect associated with the tax credit but no effect on employment growth thus directly pointing at rent sharing. Although we consider a reform that affected most firms in the economy as opposed to the select subset of small innovative firms they look at, we find broadly similar patterns.9 We
find no discernible effect on employment but a strong wage incidence concentrated among high-skill incumbents whose retention rate increases significantly with no ef-fect on the wage of new entrants. Taken together these findings are broadly consistent with monopsony-type models in which firms set wages unilaterally and where rents are shared only because of information asymmetries (Card et al.,2018;Lamadon et al.,
2018) and where that mechanism is mostly at play with respect to incumbents work-ers’ outside options implying that the intensity of rent-sharing is particularly strong among these workers – in particular when they are costly to replace (Kline et al.,2019).
Outline of the paper. The rest of the paper is organized as follows. Section2presents the policy while section3details the data sources we use. The firm-level identification strategy and results are described in Section4. Section5investigates employee-level incidence. Section 6 discusses our main results and situates them in the literature. Section7concludes.
2
Institutional setting
In this section, we detail the main features of the French tax credit studied here as well as its broader institutional setting.
Schedule. The Competitiveness and Employment Tax Credit (CICE henceforth) is a
refundable corporate income tax credit. It was introduced on January 1st 2013. The
amount of tax credit firms can claim depends on their wage structure. More precisely, it is equal to a fraction of the wage bill accruing to workers paid below 2.5 times the minimum wage (noted 2.5 MW below). All employees paid up to 2.5 MW trigger a
9UnlikeHowell and Brown(2019), we can measure hourly wage – as opposed to total compensation
– which is a more direct measure of wage rate. A limitation of our study is that we cannot examine how
corporate income tax credit equal to 4% of their annual wage in 2013 and to 6% of their annual wage in 2014 and 2015, while all employees paid more than 2.5 MW trigger no tax credit.
Worker and firm exposure. This cut-off implies variation in exposure to the policy
at two levels: across employees and across firms. First, the sharp wage cut-off in-duce substantial variation in workers’ individual eligibility, especially among high-skill workers. Figure 1 depicts the distribution of hourly wages relative to the min-imum wage by occupation.10 The red vertical line represents the eligibility cut-off. While virtually all clerks and blue collars earn wages below the 2.5 MW cut-off, a substantial share of managers and professionals earn above this threshold.
Second, this cut-off implies variation at the firm level depending on firms’ share of eligible employees. Figure A1 plots the distribution of firms’ exposure to the policy by firm size. Exposure to the policy is defined as the amount of tax credit each firm claimed divided by its wage bill as of 2013. The spike at 4% is constituted of firms the most exposed to the policy: all their employees are paid less than 2.5 MW and are eligible to the policy. The amount of tax credit they receive is therefore equal to 4 percent of their wage bill. The policy exposure distribution also exhibits a long left tail with substantial variation in the amount of tax credit that firms could claim, implying firms were heterogeneously affected by the policy.
Timing of benefits. The CICE is a tax credit, which entails a delay between the time
wages are paid (and opens rights to the CICE) and the time when a firm benefits from the tax credit. Profitable firms get the tax credit at the end of the policy’s first year, when paying corporate income taxes. Firms that are not profitable and thus pay no corporate income tax benefit from the tax credit after three years as a payment from the government, or after one year if they qualify as SMEs. It implies that all firms, profitable or not, benefit from this tax credit, but at different time according to their profitability and size. For simplicity and because profitability and size could be en-dogenous to the policy, we only consider how much tax credit a firm is entitled to, rather than how much it actually benefited from, to measure their exposure to the policy.
10As inCaliendo et al.(2015), we split workers into groups according to their occupational category.
The first group includes senior staff, professionals, associate professionals, technicians, and employees at the supervisor level, corresponding to classes 3 and 4 of the French occupational classification system. The second category encompasses clerical employees and blue-collar workers, i.e. classes 5 and 6. We refer to these groups as, respectively, managers and professionals and clerks and blue-collars for brevity. Given that occupational categories also correspond to different skill levels, we interchangeably refer to these two groups as high-skills and low-skills respectively.
Figure 1: Distribution of wages by occupation 0 .05 .1 .15 fraction 1 2 2.5 3 4 5
hourly wage (w.r.t. minimum wage)
Low-skill workers High-skill workers
Notes: The figure plots the 2012 distribution of hourly gross wages of workers by occupation. The
sample is restricted to workers employed in firms present in our estimating sample (see section3.4for
details on the estimation sample). Each dot represents the fraction of workers in an interval of length 0.1 minimum wage.
Anticipations. Firms did not anticipate this policy as it was implemented short after
a new government was elected, it was not part of the winning candidate’s platform. Indeed, in 2012, a new French government came to power, in the context of an eco-nomic slowdown. This new government commissioned a working group to issue a re-port on how to tackle high unemployment and bolster French firms’ performances.11
It advocated for payroll tax cuts up to 3.5 MW in the manufacturing sector to boost firm competitiveness. This cut-off was chosen to target exporting firms, as they pay higher wages on average. Deemed too high by labor economists on the ground that the elasticity of labor demand is low for high-wage employees, the cut-off was even-tually brought down to 2.5 MW.12 Moreover, little time elapsed between the release
of the report – November 5th 2012 – and the implementation of the CICE beginning
January 1st 2013, making any anticipation effects quite unlikely.
Take up. The take-up was high. First, since most firms have at least one employee
paid below 2.5 MW, they are almost all eligible to the tax credit. Second, implemen-tation was made easy as accounting software packages rapidly included new features dedicated to the policy. Third, workers’ wages, the only criterion for eligibility, is di-rectly observed by firms. As a result, a very large share of French firms benefited from
11This report is often referred to as the Gallois Report in journalistic debates, after the name of Louis
Gallois a businessman who chaired the working group.
the tax credit. For this reason, we decide to study firms differently exposed to the policy given their ex ante wage structure rather than compare firms that claim the tax credit to those that do not.
Other policies. The CICE follows other policies aimed at creating fiscal incentives
for firms to increase hires, mainly payroll tax cuts. These policies however targeted workers paid significantly lower wages. Pre-existing payroll tax cuts targeted low wages, and amounted to about 26 percent of the gross wage at the minimum wage-level, gradually decreasing to reach zero at 1.6 MW. In contrast, the CICE’s tax credit rate is flat up to 2.5 MW, and sharply falls down to 0 above this threshold. The 2.5 MW eligibility cut-off is specific to this policy, and significantly different from past thresholds. Accordingly, exploiting this discontinuity to identify the reform’s impact should not pick up the effect of another policy. In 2016, new payroll tax cuts targeting workers with wages up to 3.5 MW were implemented. We therefore end our analysis in 2015 as these new tax incentives may affect our identification strategy.
Budgetary impact. The CICE had sizable budgetary consequences. The direct cost of
the policy was 18.1 billion euros in 2015, which is equivalent to .82 percent of GDP, 30 percent of corporate income tax gross revenue, and 272 euros per capita.13 This quan-titatively large policy was financed by several measures affecting households rather than firms, such as increases in VAT rates.14 Although labor market outcomes may be
affected by these contemporary measures through general equilibrium, the disconti-nuity in the tax schedule we leverage for identification is unrelated to these simulta-neous reforms. Moreover, we absorb aggregate shocks by using year or sector - year fixed-effects and focusing on firms and individuals directly affected by the disconti-nuity.
3
Data
We use information from three administrative sources. Matched employer-employee data come from social security declarations. Data on firms’ financial performances come from corporate income tax returns and data on the amount of tax credit each firm claimed come from the public finance administration. In this section, we describe the data sources and detail the matching procedure as well as the characteristics of the resulting estimating sample.
13The corporate income tax gross revenue is the corporate income tax before tax credits, whose major
share is actually constituted by the CICE.
14The CICE necessitated public finance reforms to be funded. There is no unique funding scheme
dedicated to CICE, the government actually funded it through the general budget, by decreasing a broad range of expenditure and by increasing some mandatory levies on households, mainly VAT.
3.1
Employer-employee data
The main source on employment and wage is the DADS (D´eclarations Annuelles des Donn´ees Sociales) data set. It is a matched employer-employee data set based on social security records which covers the universe of French firms and private sector jobs. Data are provided at the contract-level and contain information on gross and net wage earnings, hours worked, occupation, type of contract (short term or long term), as well as some employee characteristics (age, gender). Each firm is identified with a unique administrative number called SIREN that remains the same across years. It allows matching each employee to an employer and tracking firms’ employment and wage policy over time. Each individual in the data set is assigned a unique identifier each year, which allows tracking individuals across employers within a year. While this identifier changes over time and therefore does not allow to track individuals across years, the characteristics of the employee’s past year’s contract are provided (past year’s employer, wage, hours worked, etc.), which allows to know whether the individual changed firm or job and to compute year-on-year changes in wage earnings or hours worked. We use data for the years 2009 to 2015.15
Based on gross wage earnings and hours worked, we compute the gross hourly wage of each employee. This allows us to determine precisely whether each employee is eligible to the tax credit based on whether her gross hourly wage is lower than 2.5 times the minimum wage.16 Aggregating across individual within a firm, we can compute the payroll share of employees paid less than the eligibility threshold. We thus precisely know both employees’ and firms’ exposure to the tax policy.
We also use this data set to build our main outcomes of interest. At the employee-level, we compute employees’ hourly gross wage earnings. We also compute wage growth for incumbent employees, which we defined as workers working in the same firm two years in a row under a permanent contract.17 At the firm-level, we compute
the mean hourly gross wage earnings for all employees as well as for two broad sets of occupations.18
15The methodology and perimeter of the dataset underwent a major change in 2009.
16Gross wage earnings are defined as “all remunerations received by the employee under her
con-tract of employment, before deducting compulsory contributions”. It does not allow breaking down compensation by type (fixed salary, bonuses, etc.). The minimum wage in France is set in terms of gross hourly wage.
17In France, by law, employees with fixed-term contracts must receive a bonus at the end of their
employment period equal to 10% of the amount received during the contract period. It is likely to impact the measured year-on-year hourly wage growth of employees with fixed-term contracts. We therefore decide to set aside fixed-term contract workers in the employee-level analysis of wage growth.
18Similarly, firm-level mean hourly wage excludes hours worked and compensations of workers with
3.2
Tax credit data
The amount of CICE tax credit claimed by each firm is documented in an ad-hoc file provided by the Public Finance Administration (DGFiP). This file is called the CICE MVC (Mouvements de Cr´eances) dataset. The first vintage is 2013 as it corresponds to the first year the policy was implemented. The distribution of tax credit amounts is very skewed. Micro firms (less than 10 employees), receive on average 2,756 euros each year, SMEs (10 to 250 employees) get 24,492 euros. The 288 largest firms in the data set get a tax credit amount approximately equal to that of the 496,750 micro firms.
3.3
Balance sheet data
We use income statement and balance-sheet data coming from the FARE database. This dataset is built using the tax returns of firms and their social security declarations. This dataset covers the universe of firms, except those in the financial and agricultural sectors. It provides detailed information on firms’ revenues and expenses. We use this database to build firm-level control variables: labor productivity (value added divided by average workforce) and assets (tangible and intangible).19
3.4
Matching and final datasets
From the three data sets mentioned above, we build two estimation samples: one at the firm level to study collective incidence (section4), and one at the contract-level to study individual incidence (section 5). The two estimation samples include the same firms, only the unit of observation differs. Firms are matched using their administra-tive identifier (SIREN), and need to meet the following criteria:
1. Firms need to be in the three data sets. It implies that all firms in the estima-tion sample claimed the tax credit. Therefore, in our estimaestima-tion sample, the take up rate is 100%, by construction. We compare firms differently exposed the tax reform, conditionally on claiming the tax credit.
2. Firms need to exist over the whole 2009-2015 time period. We obtain a balanced sample of firms.
3. Firms need to be continuing employers. We keep only firms with employment equal to at least one full time equivalent each year. The firm-level mean hourly wage cannot be zero.
19This data set also includes data on measures of profits. However we do not use variables such as
reported profits due to accounting issues. Indeed, firms were allowed to account for the tax credit either as a decrease of wage bill or as a decrease of corporate taxes. Firms should find the second option more attractive, as the first option inflates the corporate income tax base. Therefore, an increase in reported profits could either reflect an increased profitability, or an accounting procedure choice.
4. Firms do not exhibit extreme values for the following measures: ratio of tax credit to wage bill, profit margin, assets per worker and mean hourly wage growth. We exclude firms that are in the top percentile in at least one year, as it is likely to reflect measurement errors.
The resulting dataset contains 325,329 firms that account for 64.6% of the total CICE credit in 2013.20
We study two outcomes of interest at the employee-level: the gross hourly wage of new hires and the year-on-year variation in gross hourly wage of continuing work-ers. Both are expressed in logs. The outcome of interest at the firm-level is the firm weighted average hourly wage of workers with a permanent contract, working sub-stantial hours (at least 60% of a full time) and who were already working for the firm the preceding year. Firm-level mean hourly wage is weighted by hours worked.21
4
Firm-level Incidence
In this section, we test whether workers benefit from tax incentive policies through higher wages, and if so whether all workers are impacted. We address this question by using firm-level variation in exposure to the tax policy generated by firms’ pre-reform wage structure. We present in details our identification strategy in Section4.1. We then present our main results showing workers on average substantially benefit from the tax policy through higher wages in Section 4.2. In Section4.3, we show our results are robust to alternative specifications and tests. We then demonstrate, in Sec-tion 4.4, that the wage incidence sharply differs across groups of workers: although the policy is targeted at workers paid lower wages, only high-skill workers benefit from wage gains, low-skill workers do not. We finally document that the tax credit did not increase firms employment in Section4.5.
4.1
Identification strategy
Treatment intensity. Our empirical strategy exploits the between-firm variation in
exposure to the policy. Yet, a firm’s exposure can be driven by its behavioral response to the policy itself. For example, if the tax credit causes a firm to hire more low-wage (eligible) workers, then its exposure to the policy will endogenously increase. For this reason, we firms’ pre-reform wage structure to measure their exposure to the policy (as inAuten and Carroll,1999;Saez et al.,2019).22 We define our treatment intensity
vari-20They account for almost identical shares for the following years: 64.3% in 2014 and 63.8% in 2015.
21More detailed definitions of all variables used in the analysis are included in SectionOA4of the
Online Appendix.
22Auten and Carroll(1999) use this method to estimate of the elasticity of taxable income. They apply
able as the pre-reform payroll share of workers paid less than 2.5 MW, scaled by the tax credit rate. It corresponds to the predicted effective tax credit rate. More formally, it writes: Zi = τ ·P j∈iwj,t0hj,t0 ·1(wj,t0 < 2.5M Wt0) P j∈iwj,t0hj,t0 (1) where wj,t0 and hj,t0 denote the gross hourly wage and hours worked of employee j
in firm i during the last pre-reform year denoted t0. τ is time-invariant and is set to
reflect the average rate of subsidy over the period (the mean of 4% in 2013, 6% in 2014 and 6% in 2015 is 5.33%).
Our choice of treatment intensity relies on the persistence of firms’ wage structure across time. Figure 2 depicts the relationship between the payroll share of eligible workers following the policy implementation (2013-2015) and the payroll share of el-igible workers in 2012, which we use to define our treatment intensity. The payroll share of eligible workers in 2013-2015 is measured as the payroll share of workers triggering a tax credit as backed out using the amount of CICE firms obtained and di-vided by the applicable rate (4% in 2013 and 6% in 2014 and 2015). It is then expressed as a share of the firm’s payroll. The relationship is strongly positive and dots all lie close to the 45 degree line. A one percentage point increase in the 2012 payroll share of eligible workers is associated with a .76 percentage point increase in the 2013-2015 payroll share of workers opening rights to the tax credit. It implies there is substantial persistence in firms’ wage structures across years.23
Exploiting the discontinuity to compare similar firms. As mentioned above,
vari-ation in treatment intensity across firms is driven by differences in wage structures. A potential challenge is that these differences are associated with unobservable firms’ characteristics that impact firms’ dynamics. To take an extreme example, firms em-ploying only minimum wage workers are likely to differ from firms emem-ploying only high wage workers in fundamental ways, observable and non-observable, which are likely to result in biased estimates. The notch created by the policy at the 2.5 minimum wage-level is useful for identification. Ideally, we would like to compare the wage dy-namics of firms whose employees are all paid just a little less than 2.5 MW in 2012 to firms whose employees are all paid just a little more than 2.5 MW as in a regression discontinuity type approach. This strategy is not feasible as no firms strictly match the required criteria. Instead, we approximate this approach by comparing firms with
23We focus on reduced-form estimates as they can be identified while remaining agnostic about the
lag structure of the effect of the endogenous variable. On the contrary, the structural coefficients cannot
be identified without making further restrictive assumptions. See sectionOA3in the Online appendix
Figure 2: Payroll share of eligible workers: pre- vs. post-reform 0 .2 .4 .6 .8 1 Pa yro ll sh a re o f e lig ib le w o rke rs (re a lize d ) 0 .2 .4 .6 .8 1
Payroll share of eligible workers (predicted with 2012 data)
Notes: This binned scatterplot depicts the relationship between firms’ payroll share of eligible workers
as measured by the ratio of CICE amount over payroll divided by the applicable tax credit rate on the y-axis and the instrument on the x-axis. The instrument corresponds to payroll share of eligible workers predicted using 2012 wage structure. The right-hand side variable is grouped into 30 bins.
similar wage distribution, except just around the eligibility threshold, thus ensuring that variation in treatment is driven by local differences in wage distribution.
To this end, we group firms based on their wage structure as of 2012. For each firm, we compute the 2012 payroll share of workers paid less than 2.2 MW and the payroll share of workers paid less than 2.8 MW.24We then discretize these shares, and interact
them. Our preferred step to discretize payroll shares is 3.33 percentage points (30 categories),25 which yields 30 × 30 groups of firms that have a similar payroll share
of workers paid less than 2.2 MW and a similar payroll share of workers paid less than 2.8 MW. We call these groups “bins”. Within a bin, firms have a similar wage structure, except immediately around the eligibility threshold, they are thus similar but differently exposed to the tax policy.
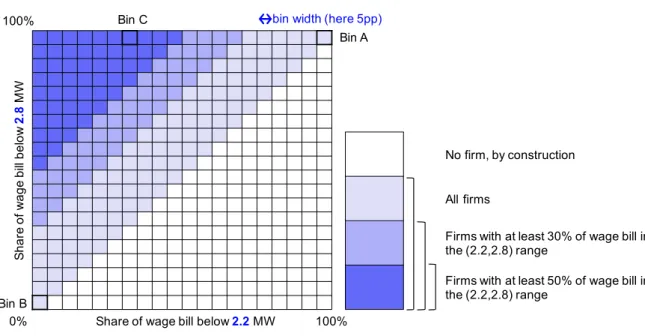
Figure3provides a graphical illustration of our methodology. Firms in bin A have between 95% and 100% of their payroll going to workers paid less than 2.2 MW, they are intensely exposed to the CICE. To the opposite, firms in bin B have between 0% and 5% of payroll going to workers paid less than 2.8 MW. They are (almost) not exposed to the CICE. Firms in these two groups are very differently exposed to the policy, but also likely too different to be comparable. Instead, our methodology compares firms with a similar wage distribution, except immediately around the eligibility threshold.
24As a sensitivity test, we also set the bounds to 2.3 MW and 2.7 MW.
Figure 3: Illustration of the bin method Sh a re o f wa g e bi ll bel ow 2. 8 MW
Share of wage bill below2.2MW
100%
100% 0%
bin width (here 5pp)
Bin A
Bin B
Bin C
No firm, by construction All firms
Firms with at least 30% of wage bill in the (2.2,2.8) range
Firms with at least 50% of wage bill in the (2.2,2.8) range
Notes: Firms in bin A have between 95% and 100% of their wage bill accruing to workers paid less than
2.2 MW. Firms in bin B have between 0% and 5% of their wage bill paid to workers earning less than 2.2 MW. Firms in bin C have between 30% and 35% of their wage bill paid to workers earning less than 2.2 MW and between 95% and 100% of their wage bill paid to workers earning less than 2.8 MW. More than 50% of their wage bill accrues to workers paid between 2.2 and 2.8 MW. The bottom right hand corner contains no firm, by construction.
To ensure that within a bin, firms do vary in their policy exposure, we define two sub-samples of firms according to their payroll share of workers paid between 2.2 and 2.8 MW. The first sub-sample includes only firms for which this payroll share is at least 30%, the second sub-sample includes firms whose payroll share is at least 50%.26
We therefore exploit large across firms variations in policy exposure that derive from small variations in wage structure.
Figure A2, left panel, plots the cumulative density function of wages of all firms with at least 30% of their payroll share going to workers earning between 2.2 and 2.8 MW (in black). The blue (respectively grey) line corresponds to the same density function for firms with an above (below) median payroll share of eligible employees. Firms most exposed to the policy (blue) have a higher payroll share of low-wage work-ers than least exposed firms (grey). Figure A2, right panel, plots similar cumulative density function, except that above and below median treatment intensity groups are defined within each bin. It shows that firms in the two groups differ in their wage distribution only immediately around the eligibility cut-off. Their wage distributions are otherwise similar.
26These subsets are not representative of the full sample. They tend to include smaller, more
Table 1: Between/within bin variation in treatment
Statistic Sample # firms Std deviation Between Cells Within Cells ˆ V(Zi) all 325,329 0.0094 92.0% 8.0% ˆ V(Zi) % WB > 0.3 30,089 0.0107 50.2% 49.8% ˆ V(Zi) % WB > 0.5 8,130 0.0120 27.6% 72.4%
Notes: A bin is defined as a unique value of the proportion of wage bill accruing to workers
making less than 2.2 and less than 2.8 MW (both variables are discretized through truncation into 31 values). A cell is defined a specific bin × sector × size category combination. “% WB > x” refers to a sample restriction to firms whose share of the wage bill constituted of wages between 2.2 and 2.8MW is above x.
TableA2shows the pre-reform correlations between the instrument and firms’ ob-servables (firm’s assets, labor productivity, share of low-wage employees) in Column (4). Column (5) plots the correlations between the residuals of the instrument and firms’ observables after absorbing industry and size category fixed effects. Column (6) plots the equivalent correlations after absorbing sector × size × bins fixed effects. Controlling for industry and size fixed-effects only slightly reduces the correlation be-tween firms’ observables and the instrument. To the opposite, in the last column, the correlation between firms’ observables and the instrument is significantly reduced. It suggests that within bin the variation in ex ante policy exposure is nearly as good as random.
Is within bin variation in exposure to the policy sufficient for identification? Table
1shows how much variation in policy exposure remains after absorbing sector × size × bins fixed effects. In the full sample, only 8% of the variation in policy exposure is between firms of the same bin. Yet, for subsamples of firms that have a larger share of workers paid wages close to the wage cut-off, within bin variation in policy exposure is substantial. Within bin variance accounts for 50% of total variance (72%) among firms with 30% (respectively 50%) of their payroll share going to workers paid between 2.2 and 2.8 MW. Additionally, the total variance in these subsamples is larger than that in the full sample of firms.
Difference in Differences. Our main difference in differences specification writes as
follows:
ln(Yi,t) = αi+ αc,t+ β · Zi·1{t ≥ 2013} + Xi,t−10 γ + εi,t (2)
where Yitis the mean weighted hourly gross wage earnings of employees in firm i at
time t. The term αi refers to a firm fixed-effect, αc,t corresponds to cell × year fixed
effects. We defined cells as the interaction of bin categories with industry and size categories. The inclusion of cell × year fixed effects implies that we are comparing ex ante similar firms in terms of wage distribution at 2.2 and 2.8 MW, industry and
size category. The common trend assumption needs only to hold within-cell. Zi is
the instrument, it corresponds to the predicted policy exposure of the firm given its pre-reform wage structure, as defined in equation (1). 1{t ≥ 2013} is an indicator vari-able equal to one if t ≥ 2013. The coefficient β can be interpreted as a semi-elasticity of the variable Yi,t relative to the tax credit rate. We show in AppendixOA2 that this
semi-elasticity can be interpreted as a close approximation of the share of the tax credit incidence borne by labor. The vector Xi,t−1includes lagged observable controls (share
of employees paid less than 1.5 MW,27 assets (in log), and labor productivity (in log).
Since our source of variation in treatment intensity is quasi-random, control variables should not affect point estimates, but might help improve the precision of our esti-mates. Standard errors are clustered at the firm level to account for serial correlation.
Event Study. To test for diverging pre-trends and assess how the effect unfolds
over-time, we also implement an event study specification. It writes as follows:
ln(Yi,t) = αi+ αc,t+ 2015 X d=2009 d6=2012 βd· Zi ·1{d = t} + Xi,t−10 γ + εi,t (3)
This specification is similar to 2, except the instrument is interacted with a full set of year dummy variables. 2012 is the reference year. Standard errors are clustered at the firm-level.
4.2
Main results
Graphical evidence. Figure4plots the evolution of the weighted gross hourly wage
(base 1 in 2012) in two groups of firms, according to whether their policy exposure is above or below the within bin median. The two groups of firms have parallel trends prior to the reform and the group the most exposed to the policy experiences faster growth in mean hourly wages. In 2015 relative to 2012, wages in most-treated firms have grown by 4.20% and by 3.02% in least treated firms.
Difference in differences estimates. Table2presents the formal difference in
differ-ences estimation results corresponding to Equation2. The outcome variable is the log of the weighted average of gross hourly wages of workers in a given firm. The first three columns of the table correspond to the full sample, the next three columns to the subset of firms with at least 30% of their wage bill accruing to workers paid between 2.2 and 2.8 MW and the last three columns to the subset of firms with at least 50% of their wage bill in this window. In Columns (1), (4) and (7), regressions include year
T able 2: Ef fects on Mean Hourly W ages: Dif fer ence in Dif fer ences Estimates (1) (2) (3) (4) (5) (6) (7) (8) (9) Mean gr oss hourly wage, weighted by hours worked (log) Zi × 1 { t ≥ 2013 } 0.347*** 0.362*** 0.330*** 0.438*** 0.438*** 0.414*** 0.526*** 0.515*** 0.489*** (0.0643) (0.0609) (0.0555) (0.0791) (0.0750) (0.0680) (0.116) (0.110) (0.0993) Observations 855295 733110 715088 165942 142236 137862 44681 38298 36812 R 2 0.931 0.939 0.944 0.857 0.871 0.882 0.765 0.781 0.803 W indow defining cells (2.2 ,2.8) (2.2 ,2.8) (2.2 ,2.8) (2.2 ,2.8) (2.2 ,2.8) (2.2 ,2.8) (2.2 ,2.8) (2.2 ,2.8) (2.2 ,2.8) % WB in window 0 0 0 0.3 0.3 0.3 0.5 0.5 0.5 W idth Cells .033 .033 .033 .033 .033 .033 .033 .033 .033 Lagged Contr ols √ √ √ # firms 122185 122185 121173 23706 23706 23479 6383 6383 6303 Notes : This table reports the estimated impact of the CICE tax cr edit on wages. The unit of observation is the firm. The dependent variable is the mean gr oss hourly wage of workers weighted by hours worked. The independent variable is the 2 012 payr oll shar e of workers earning less than 2.5 MW multiplied by the tax cr edit rate and interacted with an indicator variable equal to one after 2013. Estimated coef ficients corr espond to Equation 2 . Regr essions include cell × year FE, as defined in Section 4 . W e use the payr oll shar e of workers paid less than 2.2 and 2.8 MW to build the bins. W e use a 3.33 per centage points discr etization step. Lagged contr ols ar e the log of value added per worker , assets value and the 2012 payr oll shar e of workers earning less than 1.5 MW interacted with a full set of year dummies. Robust standar d err ors clusters at the firm level in par entheses. *** p < 0 .01 , ** p < 0 .05 , *p < 0 .1
Figure 4: Firm-level impact on gross hourly wages .9 .95 1 1.05 W a g e s re la ti ve t o 2 0 1 2 2009 2010 2011 2012 2013 2014 2015
Below median treatment intensity Above median treatment intensity
Notes: This figure plots the mean gross hourly wage of firms (relative to 2012) across a balanced sample
of firms with at least 50% of their payroll paid to workers earning between 2.2 and 2.8 MW. We consider two groups of firms according to whether their 2012 payroll share of workers paid less than 2.5 MW is
above or below within-bin median. Bins are defined as detailed in Section4. On average, the predicted
effective rate of CICE of firms with an above median payroll share of eligible workers is 4.84%. It is equal to 2.41% for firms in the other group.
2009 to 2015, other columns include year 2010 to 2015. Columns (3), (6) and (9) include lagged time-varying controls at the firm-level, other columns do not. Our preferred specification is that in Column (9) as the sample definition is the strictest and controls are included. We estimate a positive, sizable and statistically significant impact of the CICE on wages at the firm-level. An increase in the effective tax credit rate by 1 per-centage point translates into a 0.49% increase in firms’ average wage. More than half of the tax credit was passed on to workers through wage gains.28 The magnitude of the
effect is close to that of other estimates in the literature on the wage incidence of the corporate income tax (Liu and Altshuler, 2013; Arulampalam et al., 2012; Fuest et al.,
2018), which is around 50%. For the US,Su´arez Serrato and Zidar(2016) find that the corporate income tax wage incidence is around 30%. Point estimates are stable across specifications and samples. They are all strongly significant.
Event study regressions. Figure 5 plots the estimation results of Equation 3 where
dots correspond to point estimates and vertical bars to 95-percent confidence intervals. The specification chose corresponds to that of column (9) in Table2. The outcome vari-able is the log of the weighted average of gross hourly wages of full-time workers at
28see AppendixOA2for a simple derivation on the link between the estimated semi-elasticities and
the firm-level. First, coefficients before 2012 are all close to zero and not statistically significant, confirming the absence of pre-trend. To the contrary, from 2013, we ob-serve a large increase in mean hourly wages that unfolds gradually.
Figure 5: Effects on Mean Hourly Wages: Event Study Estimates
-. 5 0 .5 1 2009 2010 2011 2012 2013 2014 2015
Notes: This figure plots the point estimates and 95-percent confidence intervals from the event study
regression defined in Equation3. The unit of observation is the firm. The dependent variable is the
mean gross hourly wage of workers, weighted by hours worked, in logs. The independent variable is the 2012 payroll share of workers earning less than 2.5 MW multiplied by the tax credit rate and interacted with year dummies. 2012 is the reference year. The sample includes firms with at least 50%
of their payroll paid to workers earning between 2.2 and 2.8 MW. Bins are defined as in Table2. Robust
standard errors are clustered at the firm level.
4.3
Robustness
Alternative definitions of bins. We first show that our results are robust to the size
of bin we choose. FigureA3a plots event study estimates of Equation 3as in Figure
5, except that bin fixed effects are defined using alternative bin widths. The baseline bin width is 3.33 percentage points. Blue estimates correspond to a bin width of 2 percentage points. Black estimates correspond to a bin width of 5 percentage points. Corresponding difference in differences estimates are reported in Tables A3and A4. Our results do not change. Coefficients remain non-significant pre-reform and become positive and significant after 2013 in all specifications. The magnitude of the effect is also very similar.
Next, we show that our results are robust to the wage thresholds we use to define bins. We have defined bins using the payroll share of workers paid less than 2.2 and 2.8 MW. We now compare our results with that obtained when using payroll share of
workers paid less than 2.3 and 2.7 MW to define our bins. FigureA3bpresents event study estimates using this alternative definition of bins. TablesA5, A6andA7report the corresponding difference in differences estimates. Results are similar. Pre-reform coefficients are not significantly different from zero while post reform ones gradually increase over time.
Alternative base year of the instrument. We use the pre-reform wage structure of
firms to predict their exposure to the policy. We have use the year 2012, the year be-fore the policy was implemented, to compute this instrument. Figure A4plots event study estimates using other reference years to define our instrument. Again, our re-sults are unchanged. Pre-reform coefficients are all close to zero and statistically non significant. Post reform coefficients gradually increase from 2013. The magnitude of the estimated coefficients is very close to that of the baseline in Figure 5. Tables A8
and A9 report corresponding difference in differences estimates and present coeffi-cients very close to those presented in Table2. Robustness to the year used to define the instruments and bins suggest that serial correlation is not a concern here. Indeed, some papers have documented that instruments `a la Auten and Carroll (1999) could be affected by mean reversion (seeWeber,2014, for an application to the elasticity of taxable income literature).
Placebo. To further test the robustness of our empirical design, we implement a
placebo test using a fictional policy schedule. Namely, we conduct our empirical anal-ysis as if the tax credit amounted to a share of the payroll of workers paid less than 3.1 MW, instead of 2.5 MW in reality. We use 2.9 and 3.3 MW as wage thresholds to define bins. We set the new cut-off to 3.1 MW such that it is low enough to have suf-ficient local variation in the distribution of wages around it, but not too low so the widow used to define the bins does not overlap with our previous bounds. FigureA5
presents event study estimation results. Both pre- and post-reform coefficients are not statistically significant.
4.4
Heterogeneity across workers
Results so far show that, on average, workers benefited from the policy through sub-stantial wage gains. In this section, we explore whether different groups of workers were affected to varying extents by the policy.
By skill level. A recent body of work has stressed the importance of occupations
(Caliendo et al., 2015) to understand within-firm wage dynamics. Kline et al. (2019) posit that the wage premia of employees depend on the training and recruiting costs
associated with their occupations. Employees least substitutable with new hires are paid higher wages. We split workers into two occupational groups based on the level of skills required. The first group includes senior staff, professionals, associate profes-sionals, technicians, and employees at the supervisor level, corresponding to classes 3 and 4 of the French occupational classification system.29 The second category en-compasses clerical employees and blue-collar workers, i.e. classes 5 and 6. We refer to these groups as high-skill workers and low-skill workers respectively.
Figure 1plots the distribution of gross hourly wage for these two groups in 2012. Low-skill workers are almost all paid less than 2.5 MW, implying they all open rights to the tax credit. High-skill workers are paid higher wages and 44% of them are paid more than 2.5 MW. Figures 6 plots the evolution of the weighted gross hourly wage (base 1 in 2012) in two groups of firms, separately for the high and low-skill workers. The two groups of firms – according to whether their policy exposure is above or below the within-cell median – have parallel trends prior to the reform and the group the most exposed to the policy experiences faster growth in mean hourly wages for high-skill workers but not for low-skill workers.
Figure 6: Firm-level impact on gross hourly wages, by skill group
.95 1 1.05 1.1 W a g e s re la ti ve t o 2 0 1 2 2009 2010 2011 2012 2013 2014 2015
Below median treatment intensity Above median treatment intensity
(a) High-skill workers
.9 .95 1 1.05 W a g e s re la ti ve t o 2 0 1 2 2009 2010 2011 2012 2013 2014 2015
Below median treatment intensity Above median treatment intensity
(b) Low-skill workers
Notes: This figure plots the mean gross hourly wage of firms (relative to 2012) across years for high-skill
and low-skill workers, depending on firms’ treatment intensity. Other notes as in Figure ??
Table 3reports difference in differences regression estimates by skill groups. The outcome variable is the skill-specific mean gross hourly wages. The positive wage effects of the policy only benefit high-skill workers. A one percentage point increase in the tax credit rate increases the wages of high-skill workers by 0.6%. By contrast, we find no effect of the policy on low-skill workers. Coefficients are all close to zero and precisely estimated.
29We group these two classes although they have been shown to be different (Caliendo et al.,2015) to
Table 3: Heterogeneity across Skill Groups: Difference in Differences Estimates Mean gross hourly wage, weighted by hours worked (log)
Low-skill workers High-skill workers Zi×1{t ≥ 2013} -0.047 -0.048 -0.087 0.437*** 0.420*** 0.605*** (0.078) (0.103) (0.163) (0.102) (0.118) (0.157) Observations 616,093 99,010 23,379 528,764 91,246 23,245 R2 0.888 0.870 0.869 0.866 0.826 0.765 Window (2.2,2.8) (2.2,2.8) (2.2,2.8) (2.2,2.8) (2.2,2.8) (2.2,2.8) Bin width 3.33pp 3.33pp 3.33pp 3.33pp 3.33pp 3.33pp Sample >0% >30% >50% >0% >30% >50%
Lagged controls Yes Yes Yes Yes Yes Yes
Notes: This table reports the estimated impact of the CICE tax credit on wages of workers by skill
groups. The unit of observation is the firm. The dependent variable is the mean gross hourly wage of continuing workers of a given skill level, weighted by hours worked. The independent variable is the 2012 payroll share of workers earning less than 2.5 MW multiplied by the tax credit rate and interacted
with an indicator variable equal to one after 2013. Other notes as in Table2.
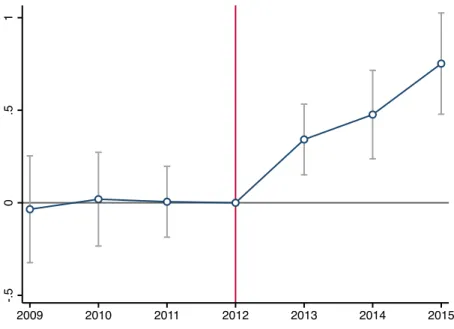
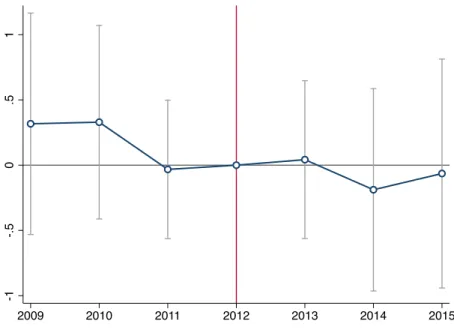
Figure 7 plots the corresponding event study regression results. For both skill groups, pre-reform coefficients are close to zero, lending support to the common trend assumption. For high-skill workers, the effects of the policy on wages gradually un-folds. By contrast, the policy has no effect on wages for low-skill workers.
Our results have two implications. First, while the policy has a sizable effect on wages, this effect varies dramatically across groups of workers. It suggests that within-firm mechanisms are crucial to understand how taxes impact labor income inequali-ties. Further, although tax incentives target mid- and low-wage workers, the surplus generated by the policy does not “trickle down” to low-wage workers. Compared to tax cuts, tax credits allow policymakers to create a link between tax benefits and desired outcomes. Yet, as demonstrated in this setting, this link can be muted as statu-tory incidence does not necessarily coincide with economic incidence: the tax credit incidence does not benefit low-wage workers but instead spills over to workers less likely to be eligible.
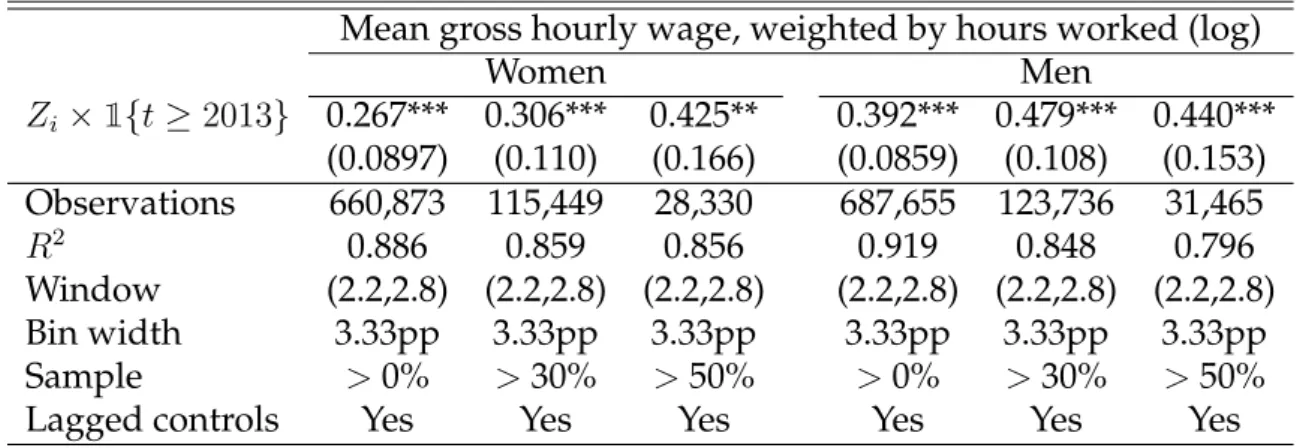
By gender. We then look at the heterogeneity in wage gains by gender. Table4
re-ports difference in differences estimates of the impact of the tax credit on gross hourly wages of men and women. Overall, we find that women benefit from slightly smaller wage gains than men. Incidence estimates are far less contrasted than for skill groups, and women might have jobs requiring less skills.
By incumbency status. Kline et al.(2019) study how profit windfalls generated by
patents translate into worker compensation. They show that incumbent employees benefit from higher wages, while entrants do not. They rationalize their findings as
Figure 7: Heterogeneity across Skill Groups: Event Study Estimates
(a) High-skill workers
-. 5 0 .5 1 2009 2010 2011 2012 2013 2014 2015
Notes:This figure reports the estimated impact of the CICE tax credit on wages of high-skill workers.
Other notes as in Figure5.
(b) Low-skill workers -. 5 0 .5 1 2009 2010 2011 2012 2013 2014 2015
Notes: This figure reports the estimated impact of the CICE tax credit on wages of low-skill workers.
Table 4: Heterogeneity across Genders: Difference in Differences Estimates Mean gross hourly wage, weighted by hours worked (log)
Women Men Zi×1{t ≥ 2013} 0.267*** 0.306*** 0.425** 0.392*** 0.479*** 0.440*** (0.0897) (0.110) (0.166) (0.0859) (0.108) (0.153) Observations 660,873 115,449 28,330 687,655 123,736 31,465 R2 0.886 0.859 0.856 0.919 0.848 0.796 Window (2.2,2.8) (2.2,2.8) (2.2,2.8) (2.2,2.8) (2.2,2.8) (2.2,2.8) Bin width 3.33pp 3.33pp 3.33pp 3.33pp 3.33pp 3.33pp Sample >0% >30% >50% >0% >30% >50%
Lagged controls Yes Yes Yes Yes Yes Yes
Notes: This table reports the estimated impact of the CICE tax credit on wages of workers by gender.
Other notes as in Table3.
follows: the less incumbent workers are substitutable with new entrants, the more they extract rents from the firm in the form of wage premia. To test whether this hypothesis could apply in our setting, we divide workers into two groups, one of “incumbents” and one of “entrants”. We define “incumbents” as workers with a permanent contract who were working in the same firm the previous year. Other workers are labelled “entrants”.
Table5reports difference in differences estimates of the impact of the tax credit on gross hourly wages of incumbents and entrants. The positive effects of the policy load on incumbent employees. An increase in the predicted effective tax credit rate by 1 percentage point translates into a 0.65% increase in gross hourly wage of incumbent workers. Coefficients reported in Table A10show that among incumbents, high-skill Table 5: Heterogeneity between Entrants and Incumbents: Difference in Differences Estimates
Mean gross hourly wage, weighted by hours worked (log)
Entrants Incumbents Zi×1{t ≥ 2013} -0.0736 0.0691 -0.0752 0.431*** 0.486*** 0.647*** (0.155) (0.196) (0.300) (0.0687) (0.0854) (0.124) Observations 665,922 99,010 23,379 679,082 129,296 34,456 R2 0.525 0.643 0.634 0.925 0.845 0.760 Window (2.2,2.8) (2.2,2.8) (2.2,2.8) (2.2,2.8) (2.2,2.8) (2.2,2.8) Bin width 3.33pp 3.33pp 3.33pp 3.33pp 3.33pp 3.33pp Sample >0% >30% >50% >0% >30% >50%
Lagged controls Yes Yes Yes Yes Yes Yes
Notes: This table reports the estimated impact of the CICE tax credit on wages of incumbents and
workers only benefit from wage gains. Finally, results in TableA11show that among incumbent employees, men benefit from higer wage gains than women. Overall, the profit windfalls generated by the CICE have distributive effects similar to that of profit windfalls studied in Kline et al. (2019)30 and Howell and Brown (2019). This set of
results suggests that the mechanisms underlying the wage pass-through might not be specific to the population of firms studied, or the type of policy generating the surplus.
4.5
Mechanisms
Our results so far show that the policy had sizable effects on workers wages, but only on those of high-skill workers. To understand the underlying mechanisms driving this contrasted wage incidence, we now explore other firm-level effects of the tax credit.
We test for several mechanisms that may be at play. First, because the policy de-creases the marginal cost of production, firms might increase the scale of their pro-duction and, to do so, hire more. Firms whose propro-duction function requires many low-skill workers will benefit more from the policy, and might in turn want to hire more of these workers. It would thus result in more employment in general, and for low-skill workers in particular. Next, when the policy was introduced, the net-of-tax credit gross wage of eligible workers decreased. In standard competitive labor market models where labor demand is more elastic than labor supply, the demand for eligible workers rapidly increases, which bids up their wages, until the labor costs of eligible and non-eligible workers are equalized. If the labor supply of low-skill workers is more elastic, the demand shock might translate into higher employment, rather than higher wages. Additionally, if employment effects are different across skill groups, the marginal productivity of workers in the two groups will also adjust. Assuming complementary between the two skill groups, an increase in the number of low-skill workers will raise the productivity of high-skill workers. As a result, the wage of non-eligible workers will be impacted by the tax reform.
Table 6 reports the results of the estimation of Equation 2 using employment as dependent variable. We measure employment as the number of contracts in each firm. Figure8shows the result of the estimation of equation3with employment as the de-pendent variable. We find no employment effect. Table A12 and FigureA6 present similar estimates with sales as dependent variables. Coefficients are all close to zero and non significant. Although the policy lowers production costs, firms did not ex-pand.
Table 7 reports the results of the estimation of Equation 2 using employment by skill group as separate dependent variables. Estimated coefficients are all close to zero and not statistically significant for both groups. The skill composition of workers has