HAL Id: cea-01302826
https://hal-cea.archives-ouvertes.fr/cea-01302826
Submitted on 15 Apr 2016
HAL is a multi-disciplinary open access
archive for the deposit and dissemination of
sci-entific research documents, whether they are
pub-lished or not. The documents may come from
teaching and research institutions in France or
abroad, or from public or private research centers.
L’archive ouverte pluridisciplinaire HAL, est
destinée au dépôt et à la diffusion de documents
scientifiques de niveau recherche, publiés ou non,
émanant des établissements d’enseignement et de
recherche français ou étrangers, des laboratoires
publics ou privés.
Timed-model-based Method for Security Analysis and
Testing of Smart Grid Systems
Gabriel Pedroza, Pascale Le Gall, Christophe Gaston, Fabrice Bersey
To cite this version:
Gabriel Pedroza, Pascale Le Gall, Christophe Gaston, Fabrice Bersey. Timed-model-based Method for
Security Analysis and Testing of Smart Grid Systems. 19th International Symposium on Real-Time
Distributed Computing (ISORC) 2016, May 2016, York, United Kingdom. �10.1109/isorc.2016.15�.
�cea-01302826�
Timed-model-based Method for Security Analysis
and Testing of Smart Grid Systems
Gabriel Pedroza
∗, Pascale Le Gall
†, Christophe Gaston
∗and Fabrice Bersey
‡∗
CEA, LIST, LISE Laboratory
Point Courrier 174,
91191, Gif-sur-Yvette, France
{gabriel.pedroza, christophe.gaston}@cea.fr
†
CentraleSup´elec, MICS Laboratory
Grande Voie des Vignes,
92295, Chˆatenay-Malabry, France
[email protected]
‡SCLE-SFE
25 Chemin de Paleficat,
31200, Toulouse, France
[email protected]
Abstract—The progressive integration of software-based com-ponents into the electricity grid has given raise to what is known as Smart Grids. As long as Smart Grids gain on connectivity and automation, new concerns on their safety and security have arisen. It is agreed that non-negligible risks and enlarged impact due to misbehaviors and intrusions exist [1]. Following a model driven paradigm, a method is proposed to reinforce the security of these complex widely distributed systems. The method guides system re-engineering and is based upon timed models. It encompasses reverse engineering, symbolic, and testing techniques to model, analyze, and deploy attack testing. In early stages of the method, a reference timed model to support security analyses is designed via reverse engineering and symbolic execution. During latter stages, the nominal models are enriched so as to specify attack scenarios which are symbolically executed to prove the ability of the system to detect attacker intrusions. In final stages, the attack scenarios are used to specify test cases which are later deployed to test the system. The method and main outcomes are presented relying upon a Smart Grid subsystem analyzed in the scope of a joint academy-industry project1.
I. INTRODUCTION
The Smart Grids are the technology committed to sup-porting an efficient use of electricity resources. A promoted strategy consists in integrating automated components into the grid to drive renewable source technology (wind, solar, hydraulic). The architecture of electric, electronic, and pro-grammable components is quite complex and is distributed along wide areas. In particular, the architecture is not only deployed along the supplier’ sites but also at the customers premises. Thus, non-negligible risks emerge as a consequence of their physical accessibility by third parties. For instance, dishonest clients may have interest in accessing the system and tampering with data to obtain economical gain. The electricity-suppliers may access and disturb the competitors network in order to damage confidence and attract clients. Unauthorized commercial parties may access, disclose, and exploit confi-dential or private data transferred in the network. Last but not least, since Smart Grids control safety-critical infrastructure, they may be privileged targets of motivated attackers. Along with physical vulnerabilities, other relevant weaknesses can
1This research has been partially funded by the projects SESAM Grids and
S3P categorized as “investments for the future”.
also be highlighted. On one hand, most industrial systems and applications were originally designed to satisfy functional and performance criteria, to operate locally, and with no security in mind, e.g., MODBUS [2]. Those poorly protected applications can render the overall system “vulnerable by construction”. On the other hand, cyber-security culture is emerging and needs to be better understood and disseminated in concerned sectors. As observed in previous years, the improvement process is smooth and further evolutions on the Smart Grids to reinforce their security are foreseen. The systems’ size, their complexity, and the associated costs for security improvement can be mentioned as identified drawbacks.
Several methods have been proposed for intrusion detection in cyber-physical systems. However, most of them propose a pervasive monitoring against known attacks, e.g., classification of bulk traffic [3]. Contrarily, our approach primarily focuses on the detectability of intrusions in specific points of the archi-tecture. Since it is assumed that the architecture already exists, re-design constraints may apply. Thus, the proposed security reinforcement is achieved by re-engineering. Our proposal is a high-level method that proves the system detection capabilities in order to reveal weaknesses. The method crucially depends on a well-designed model of the system which is obtained by reverse engineering system execution observations. A high-level easy-to-use language and executable framework are used for designing. Since the model is timed and executable, a conformity relation model-system can be settled and vali-dated by incrementally considering further system behavior observations. During the security analysis, the well-designed model is enriched to specify attack scenarios and the means for detection. Again, the timed and executable features of the model allow to prove the detection capabilities. Finally, intrusion tests are guided by temporized routines derived from the attack model via a deployed interface.
The rest of the paper is structured as follows. In section II, an overview of Smart Grids is provided including a description of the target Smart Grid system. The proposed method is ap-plied to the target system and explained in two stages. Section III contains the functional phase of the method whereas section IV explains the security phase. The method is summarized and
positioned in section V and its main results listed. Finally, some conclusions of our work come in section VI.
II. TARGETMICRO-GRIDSYSTEM
A. Smart Grids Overview
Smart Grids comprise a variety of transmission, distribution, and storage assets. The Information Technology (IT) have progressively improved the ability to monitor and control the overall infrastructure. In particular, the so named Supervisory Control and Data Acquisition System (SCADA) has increased network connectivity and automation [4]. The SCADA is composed of programmable electronic devices that are inter-connected via a variety of links and buses. The goals of this widely distributed architecture are to be safe, economically viable, and environmentally adequate. To achieve these goals, the SCADA is dedicated to monitor the grid so as to assess and control its status. To do so, several parameters are periodically sampled by sensors at field level in order to obtain electricity consumption, power generation, operation events, etc. The sampling architecture is also referred as Advanced Metering Infrastructure (AMI) and is mostly composed of meters. As shown in Figure 1, the data sampled by the AMI are later gathered by a global network center to be processed relying upon forecast and optimization algorithms.
Fig. 1. Scheme showing a global overview of a generic Smart Grid
The optimizations are finally used to drive the overall grid operation via AMI actuators. Most of the exchanged data are not time critical and thus network bottlenecks are not an issue. Nevertheless, certain safety-critical messages should respect stringent time thresholds, like the commands to protect substations from overload peaks (3ms) [5]. The IT components integrate proprietary and open source technology. Along with proprietary middleware, the distributed applications depend upon a variety of protocols like DNP3, MODBUS, IEC61850, and TCP/IP [5]. The complexity of this widely-distributed highly-networked system imposes the challenge of ensuring safety goals. First, many of the SCADA and AMI sub-systems deployed at field level were originally designed to operate locally. Consequently, they may be poorly protected and become vulnerable to certain threats [6]. Secondly, grid misbehaviors due to flawed applications or intrusions can be propagated and possibly impact human safety. Finally, since
the collected data can be linked to identities, the privacy of customers can also be at stake [6].
B. Micro-Grid Reference Architecture
As agreed by several European standardization committees like CEN-CENELEC [7], the Micro-Grid is a heterogeneous architecture deployed over multiple domains from customer to electricity-supplier premises. The Micro-Grid consists of assets like the AMI, including part of the SCADA, Distributed Energy Resources (DER) e.g., load management units -, and auxiliary automation systems. The Micro-Grid border encloses indeed our reference architecture. It includes the electronic components - HW and SW -, the communication channels, as well as the applications upon which safety and security analyses will be conducted. Our reference Micro-Grid is already deployed in a demonstration site at Toulouse, France, named Smart ZAE [8].
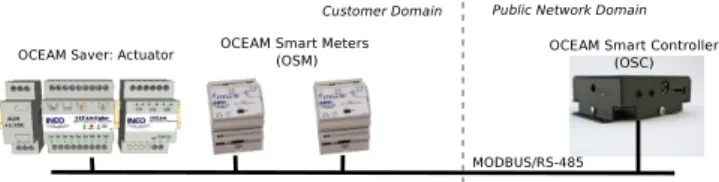
C. Target Micro-Grid System
In this subsection, we provide a more detailed description of the Micro-Grid architecture defined in previous subsection II-B. The Micro-Grid subsystem is mostly located at field level within the customers domain. It is a subset of the AMI architecture mainly composed of two kind of components - see Figure 2. Located at customers premises, the so named Smart Meters are committed to permanently measure electricity consumption. The so called Smart Controller monitors the operation of Smart Meters and is also dedicated to collect their measures.
Fig. 2. Refined view of the target subsystem in the Smart ZAE site
Since the Controller operates as a gateway which links customers and supplier domains, it is capable of enforcing a consumption policy by regulating the operation of the grid. For instance, an electric device at customer premises can be switched off via an Actuator. The components of the Micro-Grid subsystem are networked via a MODBUS channel [2]. The MODBUS is a serial master-slave protocol typically used in industry by its simplicity and reliability. The Micro-Grid subsystem is critical with regard to the safety and security of the overall Smart Grid since it is beyond the company surveillance range.
D. System Observation Rationale
The Smart ZAE site is already operational and consequently its availability for experimental purposes is limited. In addi-tion, the target system is composed of confidential technology which should not be disclosed. Crucially, no useful model of the system behavior is available. To overcome these shortcom-ings, a strategy is deployed based upon a passive observation
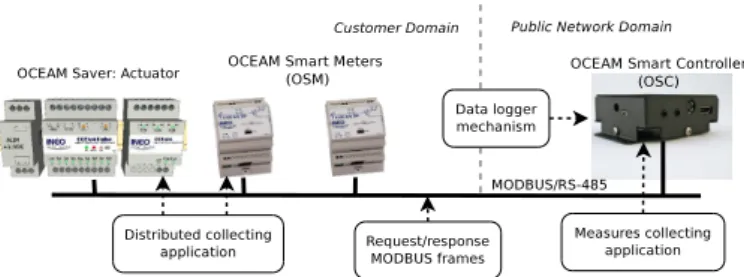
of the system. The strategy relies upon several modules and components that are crucial for the system operation. First, we focus on the application that requests and collect the measures sampled at consumption points. The application is distributed over the Controller, Meters, and Actuators. The Figure 3 shows the locations of the distributed application.
Fig. 3. System observation rationale
A physically accessible point where application exchanges occur is the MODBUS channel. Because of this, the MODBUS channel can also be used to observe or inject frames. An alternative to passively observing the system execution is the data logger mechanism. Indeed, since the Controller plays the role of master, the system actions and events are permanently stored in a log file. The observation strategy relies on the fact that the log file contains enough information about the application execution and in particular actions/events time.
III. MODELING BYREVERSEENGINEERING ANDMODEL
CONFORMITY
A. Data Logger Files Analysis
The source log file is first parsed to identify: (1) the involved Micro-Grid components; (2) SW modules; and (3) their exchanges. Once identified, they are associated to the architecture assets composing the target Micro-Grid described in section II. To accomplish this stage, the syntax of log registers is first elicited:
LogRegister:=[Date][hour][SW Module][-][Action/event]
The initial outcomes of parsing, reviewing, and understanding the registers meaning are the following:
• Timed sequence: The log file is a sequence of registers stamped according to the system clock. The time-stamps accuracy is 1 millisecond.
• Involved modules: Several SW modules are virtually
identified in the file, namely oceamGateway, libOceam, libModbus, and lidOceamDB.
• Kind of actions/events: The descriptions about either
outgoing or to incoming data, information, or commands are considered as actions. The descriptions about alerts, actions completion, etc. are considered as events. To accomplish this stage, a python script was written. Among others, the script decomposes the registers into their words and is able to classify them. The script is also able to validate that the registers match with the syntax presented above. According to the initial results and by considering the
reference Micro-Grid architecture, it is confirmed that the log file truly corresponds to the Controller stack.
B. Observation Hypotheses and Validation
The log file is supposed to include the relevant actions and events of the system execution. Even so, it remains a partial view of the whole behavior. That is why, finding an adequate correlation between the log trace and the target system be-havior is worth having. A reverse engineering process is thus initiated and guided by an interpretation of the log file. The referred interpretation is based upon several hypotheses that need to be validated. The following hypotheses were adopted: h.1 Main application: There exists a top SW module in the component that controls overall execution and includes an application launching a main thread.
h.2 Modules interactions: An interaction between modules occurs when two consecutive registers refer to different modules and when their actions description are logically linked by a cause-then-effect relation. Otherwise, actions and events are assumed as internal to the module. h.3 Synchronous calls: The calls between SW modules are
synchronous, i.e., they block whenever a call is made and until the respective call back is received.
h.4 Modules hierarchy: A dependency between SW modules is assumed: the operation of lower-layer modules is subordinated to higher-layer ones.
The validation of these hypotheses is based upon a deeper analysis of the log file and involves a first mapping from identified modules into specific components of the target system. It is recalled that these hypotheses are mainly settled to overcome the lack of a global specification of the target system.
The next excerpt of registers shows that a data gathering application is executed.
oceam-gateway 15024 _______________________________ oceam-gateway 15024 T´el´echargement des derni`eres donn´ees oceam-gateway 15024 D´efinition du num´ero d’esclave 0A
The application will target an external slave component which will be called via its address ID (0A). Since these lines are periodically found all along the file and for all the slave com-ponents in the network, it is concluded that the oceamGateway executes a main thread thus confirming hypothesis 1. Yet critical, hypothesis 2 is not validated at this stage and for now it is taken for granted. Even so, its congruity will be ultimately confirmed by the architect of the Micro-Grid system. The validation of hypothesis 3 depends upon the consistency of hypothesis 2. To perform the validation, the log file is first separated in lots of consecutive registers involving the same module - see Figure 4. The idea is to consider the internal behavior of each module to identify potential asynchronism.
It is finally verified that whenever a module is called by a different one, neither incoming nor outgoing calls occur before the request is fully completed. During the processing interval, the caller always waits for the callee until a response is obtained. To justify the pertinence of hypothesis 4, an initial hierarchy is assigned to SW components. The initial hierarchy
Fig. 4. Excerpt of the log file showing 3 lots: synchronous exchanges between libOceamand libModbus modules
is proposed according to the order in which modules first appear within the log file. It is verified that the initial hierarchy and the roles of the caller and callee are preserved all along the log file thus justifying hypothesis 4. The modules hierarchy is settled as follows: 1st. oceamGateway; 2nd. libOceam and libOceamDB; 3rd.libModbus; 4th. external Meters.
The validation of previous hypotheses was mostly automated by an extension of the python script.
C. Log Registers Abstraction
This step is conducted to analyze actions and events in the log file in order to filter them and exclude redundant/non-relevant information. In addition, the actions and events are abstracted to keep interactions at a high level, adequate to design a model of the target system. The resulting registers should be translated into a syntax suitable to conduct further analyses. The abstraction of log traces is performed according to the following criteria:
1) Avoidance of redundancy: Log registers containing information related to the same system event or action are grouped. A single register is selected to mark and identify the group.
2) Actions/events dependency: To validate that a behav-ior has been accomplished, we look for registers that ultimately confirm such occurrence. In a sequence of registers logically linked by a cause-then-effect relation, the register that confirms the effect suffices as a proof of the occurrence of the whole sequence.
3) Actions/events relevance: Registers within the log file associated to lower-level executions, calls, or auxiliary functions can be left out.
Once abstracted, the log registers are expressed in a sym-bolic syntax. Indeed, the registers are expressed as a timed sequence in which each register is represented as a couple of Input/Output actions. Let us first introduce the following syntax. Notice that the incoming and outgoing values are not explicitly given but abstracted and represented symbolically.
1 ∆T1
2 Component 1!x1, x2, . . . , xn
3 ∆T2
4 Component 2?x1, x2, . . . , xn
The terms Component 1 and Component 2 are the names of the sending and receiving components, respectively. The terms x1, x2, . . . , xn in the second line are the outgoing symbolic
variables emitted by the component. x1, x2, . . . , xn in the
fourth line represent the symbolic values upon reception. The
terms ∆T1 and ∆T2 are respectively the initial and
interme-diate delays elapsed before sending, and between sending and reception events. The terms {xi}, {∆Tj} are an abstraction of
the so called frozen values: xi, ∆Tjare symbols that represent
the set of values of its type domain which remain unchanged in the model. The resulting timed sequence is also referred as a symbolic Input/Output trace (I/O trace). Let us apply the abstraction mechanism to the second lot of log registers in Figure 4. The outcomes of the abstraction are depicted in Figure 5.
Fig. 5. A lot of log registers related to libModbus after abstraction
The remaining registers respectively correspond to the send-ing and reception of two messages over MODBUS. Notice that these actions are performed by the libModbus module and, consequently, they correspond to exchanges towards and from and external slave i.e., a Meter. Finally, the abstracted registers are represented in the symbolic syntax as follows:
∆T0
1 libM odbus Source!“M odbusLV f rame00, id, crc ∆T1
2 smartM eter T arget?“M odbusLV f rame00, id, crc ∆T2
3 smartM eter Source!“RespM odbusLV f rame00, id, nb, crc ∆T3
4 libM odbus T arget?“RespM odbusLV f rame00, id, nb, crc Lines 1 and 2 respectively correspond to the sending of the MODBUS request and its reception by the Meter. Recipro-cally, the lines 3 and 4 stand for the emission and reception of the response coming from the Meter. Notice that message values are abstracted and represented by the symbols id, nb, and crc. The unknown delays between actions -e.g., due to bus latency- are specified by the terms ∆Tk.
D. Sequence Diagram Design
In this subsection, a timed model of the target system is designed from the interpretation of log registers. The model is based upon the UML standard [9] and its profile specialization MARTE [10]. A basic knowledge on UML matters is thus assumed. UML and MARTE have been successfully used to model and analyze real-time systems [11]. In particular, MARTE was specified for modeling and analyzing functional and non-functional properties of embedded systems. Our mod-eling approach encompasses Class, Composite and Sequence Diagrams. First, the static parts of the target system and its features - e.g., components, modules - are represented using Class Diagrams. The Composite Diagrams capture the topology of the architecture including the communication links and ports. Finally, the dynamic elements, i.e., inferred behaviors, are modeled as Sequence Diagrams. To exemplify the modeling process, we reuse the log registers introduced in previous subsections. As it is depicted in Figure 5, a lot of log registers was abstracted as a single couple. To specify the exchanges between involved modules or components, the introduced symbolic syntax is recalled. Let us denote
the module libM odbus and the component smartM eter by ci, cj, respectively. The modeling steps are as follows.
a) New classes Ci and Cj are designed in the Class
Diagram.
b) New parts ci and cj are added to the Composite
Dia-gram. A new connector {ci, cj} is then created.
c) New lifelines namely (ci: Ci) and (cj : Cj) are added
to the Sequence Diagram.
d) A message from ci to cj is designed what models the
first register in Figure 5 (sending).
e) A message from cjto ciis designed to model the second
register in Figure 5 (response).
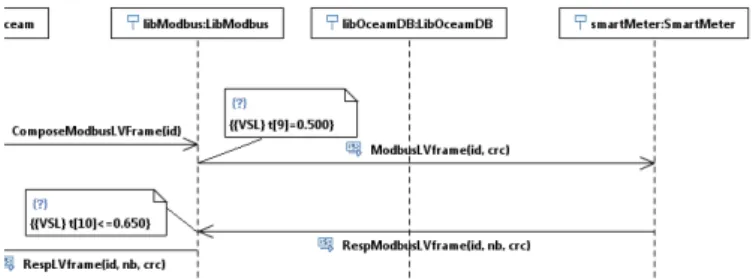
The messages are stereotyped by signals pre-defined with the typed variables to be conveyed. These variables are finally interpreted as symbolic values. An excerpt of the overall Sequence Diagram is presented in Figure 6. The two messages M odbusLV f rame and RespM odbusLV f rame between the libM odbus and smartM eter lifelines respectively corre-spond to the log registers in Figure 5.
Fig. 6. Excerpt of the UML model of the target Micro-Grid system
Time modeling: The timed I/O trace associated to the log registers in Figure 5, includes the intervals ∆T0, . . . , ∆T3.
Whereas the value of ∆T0 is known (500ms), we can
only settle the following equivalence for the other intervals: ∆T1+ ∆T2+ ∆T3 = 641ms. In fact, the times at which
message reception and transmission occur on the remote Meter are ignored. To capture the timed features of the I/O trace, we rely upon the UML-MARTE constraints. Indeed, the messages are annotated with VSL constraints on the time emission/reception actions occur. Concretely, the emission of M odbusLV f rame can be explicitly constrained by ∆T0. The
expression ∆T1+ ∆T2+ ∆T3= 641ms is modeled as a
time-out constraint on the reception of RespM odbusLV f rame. E. Validation of Timed Model Conformity
The validation of the UML scenario is conducted by building an executable model of the system and by verify-ing its conformity w.r.t. additional Input/Output traces ob-tained/abstracted from the target system. The validation relies upon a conformity relation which is situated within the context of the tioco conformance relation [12], [13], [14]. More precisely, the validation of a Sequence Diagram w.r.t. an I/O trace consists in the following steps: (1) transformation of the Sequence Diagram into a symbolic timed I/O automata; (2) abstraction of an I/O symbolic sequence with delays (I/O trace)
obtained from the target system; (3) computation of the verdict based on a traversal of the symbolic I/O automata guided by the execution trace. The first and last steps are performed off-line with Timed Input Output Symbolic Transition Systems (TIOSTS) for models. TIOSTS are extensions of I/O Symbolic Transition Systems (IOSTS) [15] and of Timed Automata [16], in which both data and time properties are expressed symboli-cally. For reasons of space, the symbolic framework, the model transformation, and conformity relation are not detailed here. Interested readers can review [15] for further descriptions. The verdicts emitted during the validation phase (PASS or FAIL) may lead to modifications in the model design in order to ensure its conformity w.r.t. the system behavior.
IV. SECURITYANALYSIS ANDTESTING
A. Attack Scenario Design
The security analysis begins by specifying and designing a threat or attack scenario. The attack scenario involves the target system and it can be selected among the outcomes of a risk analysis. For instance, a refined view of the threat may be necessary to assess or confirm attack severity and calculate the impact. In our approach, the nominal UML scenario is taken as a basis to build the attack scenario. To do so, an attacker is first introduced to the scenario. Thus, new class, part, and lifeline are designed to model the attacker features. The attacker is channel-based and is modeled as follows:
• The knowledge base of the attacker is declared relying
upon typed Class attributes.
• The attacker can intervene and exploit exchanges
con-veyed by accessible connectors which are typed and designed in the Composite Diagram.
• The attacker behavior is defined in a new Sequence Dia-gram. The behavioral model of the attacker is inspired by the Dolev-Yao paradigm [17] which allows the attacker to intercept, inject, alter, delay and forge messages. Previously in [18], we have defined a framework to model attack scenarios relying on predefined UML patterns. The attack scenario can be designed following that approach. According to the outcomes of the modeling phase (section III), the attacker can intervene during the following phases of the system execution:
1) Data size request: the oceamGateway requests the smartMeterfor the number of bytes to transfer. The data contains the consumption measures sampled and stored by the smartMeter which informs the requested value. 2) Data transfer: If necessary, the data are split into several
frames which are indexed and sent by the smartMeter upon request of the oceamGateway.
3) Acknowledgment: Once the data transfer cycle is ac-complished, the oceamGateway acknowledges reception. Afterward, the smartMeter can free its memory from the transferred measures.
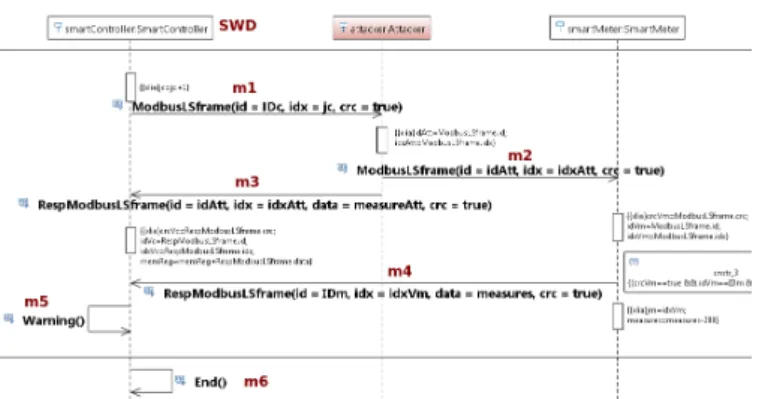
The data transfer phase is security sensitive since third parties have interest in tamper with measures to obtain some gain. An overview of the Sequence Diagram of the attack
scenario is shown in Figure 7. First, the attacker identifies the frame request sent by the oceamGateway to the smartMeter (messages 1 and 2). Instead of modifying the request, -which is finally received by the smartMeter- the attacker replays on behalf of and faster than the smartMeter (messages 3 and 4). This MITM attack exploits the vulnerabilities associated to the MODBUS protocol [19].
Fig. 7. Excerpt of the attack scenario: 2nd. phase of the nominal behavior
B. Observability Functions Design
A crucial aspect of our approach is the observability of actions and events. In particular, the ones conducted to under-mine system operation. It is assumed that system components can be designed to deploy a monitoring strategy thus playing the role of Security Watchdogs (SWD). The designation of SWD’s is among the design choices. To reason on the effec-tiveness of the means for detection, the existing and foreseen mechanisms and functions are first modeled. The design of means for observation considers the following aspects:
• Choice of SWD:certain component(s) of the system play the role of SWD. This choice depends upon the role and location of the component within the network topology and its capacity to execute security mechanisms.
• Detection mechanisms: The functions that deploy the
monitoring and detection strategy are modeled at a high level. The detection mechanisms must be able to emit alerts via secured channels thus ensuring human inter-vention, whenever necessary.
• Behavior completion:The evaluation of detection mecha-nisms is performed w.r.t. the achievement of: (1) attacker objectives; (2) alerts emission; and (3) system objectives. Thus, the model should include means to signal the completion of application runs.
As depicted in Figure 7, in our attack scenario, the oceam-Gatewayplays the role of SWD. By design, the component is able to emit an alert upon reception of an unexpected message (warning message 5). Finally in the last phase, the message End()signals the completion of the application run (message 6). The assessment of the attack impact should consider the possible combinations between alerts emission, attacker gains, and system completion status.
C. Evaluation of Detectability
The evaluation of detectability is conducted on the symbolic framework referred to in subsection III-E. It is mainly based upon the notion of k-robustness introduced in [18]. This notion allows to infer minimum bounds for the attacker actions to be detected and signaled by alerts. It is assumed that along with the attack scenario enriched-with-detectability-means, a security expert should settle a suitable minimum bound k. This evaluation phase comprises the following steps:
1) Model transformation: The attack scenario is translated into the TIOSTS automata syntax [15]. The transfor-mation generates an executable model useful to analyze functional and non-functional properties of the system. 2) Symbolic execution and robustness assessment: The
TIOSTS automata are executed to compute a symbolic tree [15] which defines the possible execution paths and supported I/O traces. The tree computation is guided by an algorithm that searches among the symbolic tree paths to verify whether the k − robustness is preserved. In case of non-fulfillment, a verdict FAIL is emitted and the algorithm terminates. If all the tree leaves are reached without violation, a verdict PASS is emitted. Since paths can be infinite, stop criteria on the tree structure can be settled, e.g., depth, width, no. of states. To illustrate the k − robustness analysis, let us consider the symbolic tree in Figure 8. The tree is composed of states ECi capturing the progression of symbolic time and values.
The states are linked by directed transitions labeled with the I/O actions that should occur for the transition to be traversed. Roughly, the symbolic tree fulfills the k − robustness criteria iff for any possible path, there exist a transition -at least- where the SW D emits an alert at almost k actions of the attacker.
Fig. 8. Instance of a symbolic tree
It is clear that for the lower and middle paths, the transitions labeled with SW D!W arning() come after one action of the attacker: Att!M sg(x#0). However, for the upper path the alert SW D!W arning() comes right after the attacker actions Att!M sg(x#0) and Att!M sg(x#1). It is concluded that the tree does not satisfy 1-robust criteria but it does 2-robust instead - at least.
The detectability analysis was performed on the attack sce-nario and it was confirmed that it is indeed 2-robust. This result confirms that the SWD truly emits an alert in the presence of unexpected duplicated messages whatsoever. D. Detectability Testing
The final phase of the security analysis consists in perform-ing tests guided by modeled scenarios. The objective of this phase is to upgrade the target system so as to include the
design choices and detectability capacities already validated, e.g.,detection w.r.t. the attack scenario.
To test the detection capabilities of the target Micro-Grid system, we proceed as follows:
1) Stimuli generation: Test cases are generated from mod-eled scenarios. It is recalled that by applying reverse engineering techniques, a mapping from system be-havior onto a high level UML model was settled. By inverting the mapping, timed sequences of I/O actions -containing symbolic or concrete values- can be almost automatically generated. It is recalled that I/O traces specify a system behavior via the I/O actions executed by modules or components.
2) Test routine coding: A TTCN like language [20] is specified to code test routines. The language supports declaration of typed variables, control flow expressions like for, if, goto, and platform oriented functions like for waiting, capturing/injecting MODBUS frames, and computing frame’s CRC. In addition, the language ac-cepts the timed I/O sequences which are interpreted as a testing routine. We rely on this language to specify the attack scenario designed in subsection IV-A.
3) HMI for testing: To automate test routines execution, an interface with the target Micro-Grid system was developed. The HMI is able to interpret routines written in our ad-hoc language and to execute them. Since a channel-based attacker should be deployed, the HMI interfaces the test routine with the MODBUS channel. An overview of the HMI is shown in Figure 9.
Fig. 9. Overview of the testing HMI front-end
4) Outcomes analysis: The testing HMI is able to record the execution of test routines. The outcomes are stored within a file in the form of a stimuli-response sequence, i.e., a timed I/O trace. The file format is adequate to conduct an -almost- automatic evaluation. Indeed, to simplify attack assessment, the testing routines are enriched to interpret system responses in real time and determine whether the attack is already accomplished. The designer should finally iterate on previous phases to ensure that the system is endowed with the desired detectability features.
V. METHODSUMMARY, POSITIONING,ANDRESULTS
A. Method Summary
In previous sections III and IV, a method for system re-engineering and security testing by modeling was applied
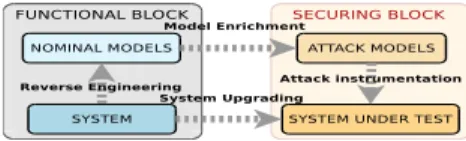
to the target Micro-Grid system in section II. The method phases were grouped in two blocks. The first block in Figure 10 mainly covers the functional aspects of the process. The objective is to obtain a model of the target system adequate to support the detectability analysis. To achieve it, reverse engi-neering techniques were applied to infer a UML model from a log file of the target system. The UML scenario captures timed features of the system and components interactions.
Fig. 10. The stages of the detectability and testing method
To ensure a well-designed model, several hypotheses and abstraction rules were settled and validated. To do so, the UML scenario was translated to a TIOSTS executable automata [15] and the tioco conformity relation [12], [13], [14] was incrementally verified relying on further I/O traces from the system. This step ensures the conformity of the UML model with the system behavior. The securing block in Figure 10 starts by enriching the UML model so as to build an attack scenario. The attacker model is inspired from the Dolev-Yao paradigm [17]. The attack scenario is completed by introduc-ing the means for detection. The detectability analysis is based upon the symbolic execution of the TIOSTS automata and the definition of k − robustness [18] introduced to evaluate the detection of attacker interventions. In the last phase, an ad-hoc language and HMI are respectively specified and developed to conduct security tests. A test routine is indeed an interpretation of the attack scenario. The testing language supports the specification of timed I/O traces, attacker actions, and platform-oriented functions. Finally, the security tests are conducted and the outcomes help to confirm or improve the detection capabilities of the system. The consistency between the models and behavior is validated during the testing phase. B. Approach Positioning
Our approach is similar to [21] since reverse engineering is used for modeling. However, to our knowledge, reverse engineering is usually applied to deduce code, e.g., [22]. So far, our method additionally allows to settle and prove a correspondence between the model and system. Several approaches propose model-based testing, e.g., [23]. In most cases, code testing is covered taking for granted the conformity between the model and test interfaces. Complementary, our approach helps to elicit and prove such conformity prior to the test phase. As stated in [24], security oriented testing is a challenging topic. Our method provides means to deploy a security-test bench driven by models. Last but not least, the introduction of time during all phases of the method is crucial: (1) time-stamped log registers help to annotate models with time constraints; (2) annotated-with-time models are necessary to validate model-system correspondence; (3) timed models allow to produce timed test sequences; (4)
specified-with-time routines fully declare the interactions with the system during tests execution. The method applicability indeed depends on previous aspects. Finally, threats unveiling and attack elicitation are challenging research topics which are however not covered by this work.
C. Results Summary
A summary of the main outcomes of the method application is provided in Table I. Notice that, even if the Micro-Grid size is limited (15 Meters), the method can be directly applied to a full-size MODBUS network (max. 255 nodes). In addition, no restriction is identified for the method to be applied to other networks based upon master-slave, bi-directional, and serial protocols, even those supporting asynchronous, group or unsolicited-answertransfer policies, like IEC60870 or DNP3.
TABLE I
SUMMARY OF RESULTS FROM THE DETECTABILITY AND TESTING METHOD
Parameter Outcome(s) No. of log registers 11,828 Identified words 110,476 Registers Date(s) 20140916 Trace duration 13 min 44.177 s
SW modules oceam-gateway, liboceam, libmodbus, li-boceamdb
Smart ZAE component OCEAM Smart Controller No. of external Smart Meters 15
No. of MODBUS messages 230 Identified MODBUS frames “lv” and “ls” Minimum response delay 0.018 s Maximum response delay 0.234 s No. of main app. cycles 103
UML nominal scenario 1.- Request no. of bytes to transfer 2.- Transfer and acknowledge data 3.- Convert and store data
UML attack scenario 1.- Wait for data frame request 2.- Tamper with a frame 3.- Reply faster than the Meter Detection functions Alert in case of unexpected message, e.g.,
duplicated frame
K − robustness analysis Verdict: the scenario is 2-robust. An alert is always emitted after 2 attacker actions. Attack testing The attack is achieved. The system is able
to detect the intrusion
VI. CONCLUSIONS
In this paper, a method is proposed to analyze and test the detectability features of Smart Grid systems. The method leads to a system re-engineering process to reinforce system security. The process is guided by modeling and to obtain a well-designed model of the system, reverse engineering and symbolic techniques were applied. The system model was enriched to design attack scenarios which were completed by introducing detection means. The analysis of detectability was conducted in a symbolic framework to prove system robustness. A tool chain was also deployed to perform security testing of the system guided by the attack scenarios. The method was applied to a Micro-Grid and its main outcomes presented. The approach feasibility mostly depend on the observation points, the timed features of observations and their consistency. Our proof of concept shows that the detectability
of intrusions on particular points of the architecture is viable. Finally, no restrictions were identified for the method to be incrementally applied to other networks within the Smart Grid.
REFERENCES
[1] L. Zhou and S. Chen, “A survey of research on smart grid security,” in Network Computing and Information Security, ser. Communications in Computer and Information Science. Springer Berlin Heidelberg, 2012, vol. 345, pp. 395–405.
[2] The Modbus Organization, Inc., “The Modbus Protocol Specification V1.1b3,” In http://www.modbus.org/docs/.
[3] Yichi Zhang and Lingfeng Wang and Weiqing Sun and Green, R.C. and Alam, M., “Distributed Intrusion Detection System in a Multi-Layer Network Architecture of Smart Grids,” Smart Grid, IEEE Transactions on, vol. 2, no. 4, pp. 796–808, Dec 2011.
[4] Al Hamadi, Hussam M.N. and Yeun, ChanYeob and Zemerly, Mohamed-Jamal, “A Novel Security Scheme for the Smart Grid and SCADA Networks,” Wireless Personal Communications, pp. 1–13, 2013. [5] Wenye Wang and Zhuo Lu, “Cyber security in the Smart Grid: Survey
and challenges.” Computer Networks, vol. 57, no. 5, pp. 1344–1371, 2013.
[6] Gao, J. and Xiao, Y. and Liu, J. and Liang, W. and Chen, C.L., “A sur-vey of communication/networking in Smart Grids,” Future Generation Computer Systems, 2012.
[7] The European Committee for Standardization and the European Com-mittee for Electrotechnical Standardization, “The CEN-CENELEC Web-site,” In http://www.cencenelec.eu/.
[8] SCLE-SFE, “The experimentation Micro-Grid site Smart ZAE,” In http://www.cofelyineo-gdfsuez.com/smart-zae.
[9] Object Management Group, “The UML standard specification,” In http://www.omg.org/spec/UML/2.4.1/.
[10] ——, “A UML Profile for MARTE: Modeling and Analysis of Real-Time Embedded systems, CCSL,” http://www.omg.org/spec/MARTE/. [11] Bannour, B. and Gaston, C. and Lapitre, A. and Escobedo, J.,
“In-cremental symbolic conformance testing from UML MARTE sequence diagrams: railway use case,” in Proc. of Intl. Symposium HASE. IEEE, 2012.
[12] J. Schmaltz and J. Tretmans, “On Conformance Testing for Timed Systems,” in Proc. of Int. Conf. Formal Modeling and Analysis of Timed Systems (FORMATS). Springer, 2008.
[13] H. Bohnenkamp and A. Belinfante, “Timed Testing with TorX,” in Proc. of Int. Conf. Formal Methods Europe (FM). Springer, 2005. [14] M. Krichen and S. Tripakis, “Black-box time systems,” in Proc. of Int.
SPIN Workshop Model Checking of Software. Springer, 2004. [15] C. Gaston, P. L. Gall, N. Rapin, and A. Touil, “Symbolic Execution
Techniques for Test Purpose Definition,” in Proc. of Int. Conf. Testing of Software and Communicating Systems. Springer, 2006, pp. 1–18. [16] Alur, R. and Dill, D.L., “The Theory of Timed Automata,” in Proc. of
REX Workshop the Real-Time: Theory in Practice. Springer, 1992. [17] D. Dolev and A. C. Yao, “On the security of public key protocols,”
Information Theory, IEEE Transactions on, vol. 29, no. 2, 1983. [18] Bannour, B. and Escobedo, J. and Gaston, C. and Le Gall, P. and
Pedroza, G., “Security Weaknesses Detection by Symbolic Analysis of Scenarios,” in Software Engineering Conference (APSEC), 2014 21st Asia-Pacific, vol. 1, Dec 2014, pp. 367–374.
[19] P. Huitsing, R. Chandia, M. Papa, and S. Shenoi, “Attack taxonomies for the modbus protocols,” International Journal of Critical Infrastructure Protection, 2008.
[20] TTCN-3 organization, “Testing and Test Control Notation Ver.3 Stan-dards,” http://www.ttcn-3.org/index.php/downloads/standards.
[21] Rugaber, S. and Stirewalt, K., “Model-driven reverse engineering,” Software, IEEE, vol. 21, no. 4, pp. 45–53, July 2004.
[22] Jain, A. and Soner, S. and Gadwal, A., “Reverse engineering: Journey from code to design,” in Electronics Computer Technology (ICECT), 2011 3rd International Conference on, vol. 5, April 2011, pp. 102–106. [23] Torens, C. and Ebrecht, L. and Lemmer, K., “Starting Model-Based Testing Based on Existing Test Cases Used for Model Creation,” in Computer and Information Technology (CIT), 2011 IEEE 11th Interna-tional Conference on, Aug 2011, pp. 320–327.
[24] Hudic, A. and Zechner, L. and Islam, S. and Krieg, C. and Weippl, E.R. and Winkler, S. and Hable, R., “Towards a Unified Penetration Testing Taxonomy,” in Privacy, Security, Risk and Trust (PASSAT), 2012 International Conference on, Sept 2012, pp. 811–812.