arXiv:1107.2092v3 [hep-ex] 6 Dec 2011
(will be inserted by the editor)
CERN-PH-EP-2011-098 Submitted to Eur. Phys. J. C
Measurement of multi-jet cross sections in proton-proton
collisions at a 7 TeV center-of-mass energy
The ATLAS Collaboration
Address(es) of author(s) should be given
September 15, 2011
Abstract. Inclusive multi-jet production is studied in proton-proton collisions at a center-of-mass energy of 7 TeV, using the ATLAS detector. The data sample corresponds to an integrated luminosity of 2.4 pb−1.
Results on multi-jet cross sections are presented and compared to both leading-order plus parton-shower Monte Carlo predictions and to next-to-leading-order QCD calculations.
PACS. XX.XX.XX No PACS code given
1 Introduction
At hadron colliders, events containing multiple jets in the final state are plentiful and provide a fertile testing ground for the theory of the strong interaction, quantum chromo-dynamics (QCD). At high transverse momentum (pT), the
production of jets is modelled by QCD as the hard scat-tering of partons and the subsequent parton showering, followed by a hadronization process. Within this frame-work, the jet energy is related to the energy of partons produced in hadron collisions. Consequently, the study of energy distributions for multi-jet events provides a funda-mental and direct test of QCD at hadron colliders.
In addition to their role in testing QCD, multi-jet events are often an important background in searches for new particles and new interactions at high energies. In par-ticular, systematic uncertainties that contribute to multi-jet cross section measurements can carry over into search analyses. Even though the impact of multi-jets on such analyses will vary according to the specific data selection criteria, a study of multi-jet events serves as an impor-tant cross check of models used to estimate backgrounds originating from jets.
Measurements of multi-jet cross sections at the Teva-tron have been performed by the CDF [1, 2] and D0 [3, 4] collaborations in proton-antiproton collisions at 1.8 TeV center-of-mass energy. The CMS collaboration has recently released measurements of the three-jet to two-jet cross sec-tions at a 7 TeV center-of-mass energy [5]. In this paper, a first study is performed of multi-jet events from proton-proton collisions at 7 TeV center-of-mass energy using the ATLAS detector at the Large Hadron Collider (LHC) at CERN. The data sample used for the analysis was col-lected from April until August 2010 and represents a total
integrated luminosity of 2.4 pb−1. Approximately half a
million events with at least two jets in the final state are selected using this data sample.
Two primary motivations for the multi-jet study in this paper are to evaluate how robust leading-order perturba-tive QCD (LO pQCD) calculations are in representing the high jet multiplicity events, and to test next-to-leading-order perturbative QCD (NLO pQCD) calculations. For the leading-order comparisons, events with up to six jets in the final state are studied, and for the next-to-leading-order perturbative QCD study, the focus is on three-jet events and their comparison to two-jet events. At present, there is no four-jet NLO pQCD calculation available.
The paper is organized as follows. Section 2 presents a description of the ATLAS detector. Section 3 discusses the cross sections and kinematics. In Section 4, theoretical calculations, to which the measurements are compared, are described. Sections 5 and 6 discuss the event selection and data corrections. The main uncertainty coming from the jet energy scale is discussed in Section 7, followed by the results and conclusions.
2 The ATLAS Detector
The ATLAS experiment consists of an approximately 45-metre long, 25-45-metre diameter cylindrically shaped detec-tor centered on the proton-proton interaction point. A de-tailed description of the ATLAS experiment can be found elsewhere [6]. High-energy particles produced in collisions initially pass through an inner tracking system embedded in a 2 T solenoidal magnetic field. The field is located in a region of diameter 2.3 metres and 7 metres long also cen-tered at the interaction point. The design of this tracking
system allows the measurement of charged particle kine-matics within the pseudorapidity1range of |η| < 2.5. Pre-cision tracking using the pixel detector with a space point resolution as small as 10 microns by 70 microns (in the beam direction) begins at a radial distance of 5 cm from the interaction point [7]. The identification of the vertex from which the jet originates, performed with the inner tracker, is of interest in the study of multi-jet events.
Just outside the inner tracker system are liquid ar-gon and scintillating tile calorimeters used for the mea-surement of particle energies. A liquid-argon/lead electro-magnetic calorimeter covers the pseudorapidity range of |η| < 3.2. This calorimeter is complemented by hadronic calorimeters, built using scintillating tiles and iron for |η| < 1.7 and liquid argon and copper in the end-cap (1.5 < |η| < 3.2). Forward calorimeters extend the cov-erage to |η| = 4.9. The calorimeters are the primary de-tectors used to reconstruct the jet energy in this analysis and allow the reconstruction of the jet pTwith a fractional
resolution of better than 0.10 for jets of pT= 60 GeV and
0.05 for jets of pT= 1 TeV.
Outside the calorimeters is a toroidal magnetic field that extends to the edge of the detector. Additional track-ing detectors designed for measurtrack-ing muon kinematics are placed within this magnetic field. The impact of muons in the analysis presented in this paper is negligible.
The ATLAS trigger system employs three trigger lev-els, of which only the hardware-based first level trigger is used in this analysis. Events are selected using the calorime-ter based jet trigger. The first level jet trigger [8] uses coarse detector information to identify areas in the calorime-ter where energy deposits above a certain threshold occur. A simplified jet finding algorithm based on a sliding win-dow of size ∆φ × ∆η = 0.8 × 0.8 is used to identify these areas. This algorithm uses coarse calorimeter towers with a granularity of ∆φ × ∆η = 0.2 × 0.2 as inputs.
3 Cross Section Definitions and Kinematics
In this analysis, the anti-ktalgorithm [9,10], with jetcon-stituents combined according to their four-momenta, is used to identify jets. For high multiplicity studies, which includes events with up to six jets, the resolution parame-ter in the jet reconstruction is fixed to R = 0.4 to contend with the limited phase space and to reduce the impact of the underlying event in the jet energy determination. For
1 ATLAS uses a right-handed coordinate system with its
origin at the nominal interaction point (IP) in the centre of the detector and the z-axis along the beam pipe. The x-axis points from the IP to the centre of the LHC ring, and the y axis points upward. Cylindrical coordinates (r, φ) are used in the transverse plane, φ being the azimuthal angle around the beam pipe. The pseudorapidity is defined in terms of the po-lar angle θ as η = − ln tan(θ/2). The rapidity is defined as y = 0.5 × ln[(E + pz)/(E − pz)], where E denotes the energy
and pzis the component of the momentum along the beam
di-rection. For massless objects, the rapidity and pseudorapidity are equivalent.
testing NLO pQCD calculations, where the study focuses on three-jet events, a resolution parameter of R = 0.6 is preferred, since a larger value of R is found to be less sensitive to theoretical scale uncertainties. The anti-kt
al-gorithm was chosen for a variety of reasons. It can be implemented in the NLO pQCD calculation, is infra-red and collinear safe to all orders, and reconstructs jets with a simple geometrical shape.
Jet measurements are corrected for all experimental ef-fects such that they can be compared to particle-level pre-dictions. At the particle level, jets are built using all final-state particles with a proper lifetime longer than 10 ps. These corrections are described in Section 6. The NLO pQCD calculation is not interfaced to a Monte Carlo sim-ulation with hadronization and other non-perturbative ef-fects. The correction for non-perturbative effects applied to the NLO pQCD calculation is described in Section 4.
Cross sections are calculated in bins of inclusive jet multiplicity, meaning that an event is counted in a jet multiplicity bin if it contains a number of jets that is equal to or greater than that multiplicity. For example, an event with three reconstructed jets will be counted both in the two-jet and three-jet multiplicity bins. Inclu-sive multiplicity bins are used because they are stable in the pQCD fixed-order calculation, unlike exclusive bins. Only jets with pT > 60 GeV and |y| < 2.8 are counted
in the analysis. These cuts are chosen to ensure that the jets are reconstructed with high efficiency. The leading jet is further required to have pT >80 GeV to stabilize the
NLO pQCD calculations in the dijet case [11].
4 Theoretical Predictions
Measurements are compared to pQCD calculations at lead-ing order and next-to-leadlead-ing order.
Many different effects are included in leading-order Monte Carlo simulations of jets at the LHC. These include the modeling of the underlying event and hadronization, which can affect the cross section calculation through their impact on the jet kinematics [12]. Effects arising from dif-ferences between the matrix-element plus parton-shower (ME+PS) calculation (with up to 2 → n matrix-element scattering diagrams) and the parton-shower calculation alone (with only 2 → 2 matrix-element scattering dia-grams) also need to be understood. These topics are not easily separable, since tuning of some of the effects (such as the underlying event) to data is needed, and the tuning process fixes other inputs in the Monte Carlo simulation, such as the proton parton distribution functions (PDF), the parton-shower model, and the hadronization model. The inability to separate out some effects makes it difficult to obtain a full estimate of the theoretical uncertainty as-sociated with the leading-order Monte Carlo predictions. Furthermore, leading-order Monte Carlo predictions are affected by large normalization uncertainties.
In this study, the goal is to test the performance of the different leading-order Monte Carlo simulations, so that they can be used to estimate multi-jet backgrounds for new particle searches, not to discern whether deviations
with respect to QCD are present in the data. The latter goal is best achieved by comparing with NLO pQCD cal-culations (discussed later in this section). For these rea-sons, the leading-order Monte Carlo predictions are all normalized to the measured inclusive two-jet cross section and then used for shape comparisons. No attempt is made to assign a theoretical uncertainty to these leading-order predictions. Instead, numerous different Monte Carlo sim-ulations and currently available tunes have been studied in order to investigate the impact of each of these effects on the measurements. Only a representative subset is shown in the results, even though conclusions are drawn on the basis of all simulations studied.
For the leading-order analysis, ALPGEN [13] is used to generate events with up to six partons in the final state using the leading-order set of proton PDFs CTEQ6L1 [14]. A factorization and renormalization scale, Q, that varies from event to event is used in the event generation, where Q2 = P p2
T. The sum runs over all final state partons.
ALPGEN is interfaced to PYTHIA 6.421 [15, 16] and, alternatively, to HERWIG/JIMMY [17–20] to sum lead-ing logarithms to all orders in the parton-shower approx-imation and to include non-perturbative effects such as hadronization and the underlying event. The ATLAS gen-erator tunes from 2009 (MC09′2 [21]) and from 2010
(AUET1 [22]) are used. Additional tunes have been inves-tigated to assess the impact of the underlying-event and parton-shower tuning. With comparable underlying-event tunes and ALPGEN parameters, the comparison between ALPGEN+PYTHIA and ALPGEN+HERWIG/ JIMMY uncovers differences that may arise from different parton-shower implementations and hadronization models.
SHERPA [23] with its default parameters and renor-malization scale scheme from version 1.2.3 is also used to generate events with up to six partons in the final state. This provides an independent matrix-element calculation with a different matching scheme between the matrix ele-ment and the parton shower. Detailed studies of individual tunes using SHERPA, however, are not performed in this paper.
The PYTHIA event generator is also compared to the data to study the limitations of leading-order 2 → 2 matrix-element calculations. This generator implements a leading-order matrix-element calculation for 2 → 2 processes, pT
-ordered parton showers, an underlying-event model for multiple-parton interactions and the Lund string model for hadronization. The MRST2007 modified leading or-der [24, 25] PDFs interfaced with the AMBT1 [21] gener-ator tune are used in the sample generation.
For the purpose of understanding detector effects, the particles generated in the leading-order Monte Carlo gen-erators are passed through a full simulation of the ATLAS detector and trigger [26] based on GEANT4 [27]. Addi-tional proton-proton collisions are added to the hard scat-ter in the simulation process to reproduce realistic LHC
2 The ATLAS MC09′ tune only differs from MC09 tune in
the value of one parameter regulating multiple interactions, PARP(82), which is the same used in the MC08 tune [21].
running conditions. Events and jets are selected using the same criteria in data and Monte Carlo simulations.
For the next-to-leading-order pQCD study, the calcu-lation implemented in NLOJet++ 4.1.2 [28] is used. The renormalization and factorization scales are varied inde-pendently by a factor of two in order to estimate the im-pact of higher order terms not included in the calculation. An additional requirement that the ratio of the renormal-ization and factorrenormal-ization scales did not differ by more than a factor of two was imposed. Two next-to-leading-order PDF sets, CTEQ 6.6 [29] and MSTW 2008 NLO [25], are used for calculating the central values. Only results ob-tained with the MSTW 2008 NLO PDF set are shown in the paper since the results obtained with the CTEQ 6.6 PDF set are compatible. The 90% confidence-limit error sets are used in the evaluation of the PDF uncertainties. The uncertainty in the calculations due to the uncertainty in the value of αS is determined by varying the value of
αS by ±0.002 for each PDF set.
The NLOJet++ program implements a matrix-element calculation, and therefore it lacks a parton-shower inter-face and does not account for non-perturbative effects. To compare to particle-level measurements, a correction factor is required. PYTHIA and HERWIG++ [30] are used to generate samples without underlying event. Jets in these samples are reconstructed from partons after the parton shower, and observables are compared to those ob-tained at the particle level in the standard HERWIG++ and PYTHIA samples. A multiplicative correction is cal-culated
Cnon−pert=o
particle UE
opartonno UE , (1)
where o is the observable of interest calculated at the particle or parton level in the samples with and without underlying event. The correction factor takes the next-to-leading-order pQCD calculations to the particle level. This correction is calculated in three different samples. The correction obtained using the PYTHIA AMBT1 sam-ple is taken as the default value for the analysis, and the systematic uncertainty is estimated from the maximum spread compared to the results from the other models (marked with an asterisk in Table 1). The size of this correction is less than 5% in all observables studied in the next-to-leading-order pQCD analysis. The total un-certainty quoted on the next-to-leading-order pQCD cal-culations comes from the quadrature sum of the uncertain-ties from the renormalization and factorization scales, the proton PDFs, αS and the non-perturbative corrections.
Table 1 presents a summary of the different Monte Carlo generators and tunes that the data are compared to in this paper.
5 Event Selection and Reconstruction
5.1 Trigger SelectionA set of ATLAS first level (level-1) multi-jet triggers is used to select events for the analysis. Multi-jet triggers
Generator PDF tune
ALPGEN+HERWIG/JIMMY CTEQ6L1 [14] AUET1 [22]
ALPGEN+PYTHIA CTEQ6L1 [14] MC09′ [21]
PYTHIA MRST2007 LOmod [24, 25] AMBT1 [21] PYTHIA∗ MRST2007 LOmod [24, 25] MC09 [21]
SHERPA CTEQ66 [29] Default (v1.2.3)
HERWIG++∗ MRSTMC al [24, 25] Default (v2.5)
Table 1. Different Monte Carlo generators and tunes used for the leading-order analysis in this paper. The asterisk indicates the samples used to determine the uncertainties on the non-perturbative correction to the next-to-leading-order pQCD calculations.
require several jets reconstructed with a level-1 sliding window algorithm. All multi-jet triggers are symmetric, meaning that each trigger had one particular transverse energy threshold and that this threshold was the same for all jets in an event. Only two-jet and three-jet triggers were needed for the analysis.
The single-jet triggers with a 10 GeV level-1 thresh-old have been shown to be fully efficient for events with at least one anti-kt jet with R = 0.4 and calibrated pT>
60 GeV [31] using events triggered with the minimum bias triggers. The efficiency for triggering on the leading jet is calculated using the minimum bias triggers. Then, the ef-ficiency of the trigger to fire on the second leading jet is calculated by requiring that the leading jet passes the single-jet trigger. Similarly, the efficiency of the third lead-ing jet is studied by requirlead-ing that the second leadlead-ing jet is matched to a jet trigger object, and the event passes a two-jet trigger. For pT> 60 GeV, events are selected on
the trigger plateau.
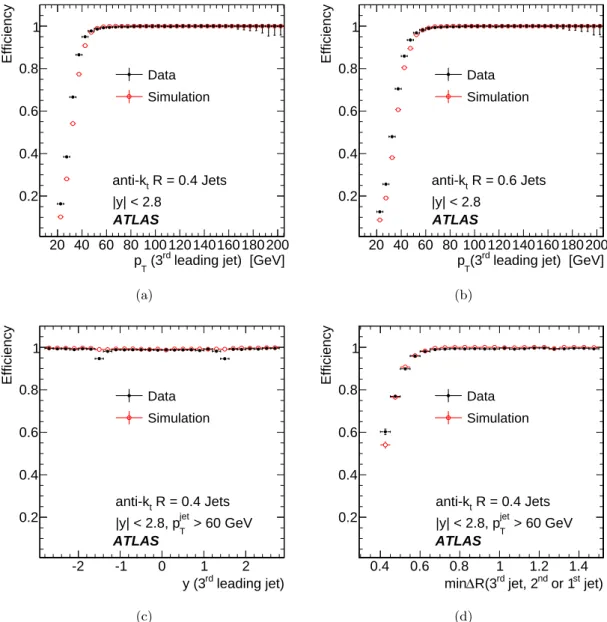
Figure 1 shows the efficiency for the third leading jet to fire the three-jet trigger as a function of the reconstructed jet pT for jets of R = 0.4 (a) and R = 0.6 (b). The
effi-ciencies calculated in data are compared to those from the Monte Carlo detector simulation. The efficiency as a func-tion of jet rapidity is also shown for R = 0.4 jets (c) for pT>60 GeV. A small inefficiency is present in the data
at y = ±1.5. In this transition region between the barrel and end-cap calorimeters the level-1 trigger energy sums did not span between the calorimeters for the early data used here, resulting in this small efficiency drop, which is not modelled by the Monte Carlo simulation. The simula-tion is not corrected for this effect, since its impact in the measurements is negligible, and included as part of the systematic uncertainties in the data correction described in Section 6.
The event-level efficiency as a function of the clos-est distance between two selected R = 0.4 offline jets for events selected using the three-jet trigger is shown in Fig-ure 1 (d). The study probes possible topological depen-dences in the trigger. A dependence at low ∆R is observed, where ∆R =p∆φ2+ ∆η2represents the minimum
sepa-ration between selected jets in the event. The dependence on ∆R is well described by the Monte Carlo simulation. For the calculation of the efficiency in the data, the two leading jets are associated with level-1 jet objects and an assumption is made that any topological inefficiency will only affect one of the level-1 jet objects. Figure 1 (d)
in-dicates that events in which two jets are separated by ∆R <0.6 have an efficiency of less than 100%. This inef-ficiency appears to depend weakly on the jet pTand is well
described in the detector simulation for events where the closest distance between selected jets is greater than 0.45. The inefficiency is accounted for in the Monte Carlo-based data correction described in Section 6. Such an inefficiency is not observed in the analysis of jets reconstructed using the anti-ktalgorithm with resolution parameter R = 0.6.
The three-jet trigger operated without pre-scaling for the entire data collection period used in this paper. All events falling in the three-jet inclusive multiplicity bin are, therefore, selected using the three-jet trigger with a jet threshold of 10 GeV on the level-1 jet objects. On the other hand, a large pre-scaling was applied to certain two-jet triggers. In order to select events in the two-two-jet inclu-sive multiplicity bin, several two-jet triggers were used. Three two-jet triggers with symmetric transverse energy thresholds of 10, 15 and 30 GeV were combined indepen-dently, weighted by the integrated luminosity associated with each trigger. The three triggers were combined in such a way that only one of them was responsible for counting events for which the pTof the second leading jet
was in a particular range. Specifically, the three triggers with thresholds of 10, 15 and 30 GeV covered the ranges of second leading jet pT of 60-80 GeV, 80-110 GeV and
greater than 110 GeV, respectively. The two-jet triggers have an efficiency higher than 99% to select such events.
5.2 Vertex Reconstruction
The primary vertex or vertices are found using tracks that originate near the beam collision spot [32], satisfy quality criteria [33] and have transverse momentum above 150 MeV. A vertex is seeded by searching for the global maximum in the distribution of z coordinates of recon-structed tracks. The vertex is fitted using the position of this seed along with neighboring tracks. Tracks incompat-ible with the reconstructed vertex are used to seed new vertices until no tracks are left. This analysis only uses events in which at least one primary vertex with at least five associated tracks has been reconstructed. No cut on the primary vertex position is applied. The event vertex is defined as the vertex in the event for which the sum of the pTof the tracks associated to that vertex is largest.
leading jet) [GeV] rd (3 T p 20 40 60 80 100 120 140160 180 200 Efficiency 0.2 0.4 0.6 0.8 1 Data Simulation R = 0.4 Jets t anti-k |y| < 2.8 ATLAS (a)
leading jet) [GeV]
rd (3 T p 20 40 60 80 100 120 140160 180 200 Efficiency 0.2 0.4 0.6 0.8 1 Data Simulation R = 0.6 Jets t anti-k |y| < 2.8 ATLAS (b) leading jet) rd y (3 -2 -1 0 1 2 Efficiency 0.2 0.4 0.6 0.8 1 Data Simulation R = 0.4 Jets t anti-k > 60 GeV jet T |y| < 2.8, p ATLAS (c) jet) st or 1 nd jet, 2 rd R(3 ∆ min 0.4 0.6 0.8 1 1.2 1.4 Efficiency 0.2 0.4 0.6 0.8 1 Data Simulation R = 0.4 Jets t anti-k > 60 GeV jet T |y| < 2.8, p ATLAS (d)
Fig. 1. Jet trigger efficiency for the third leading jet as a function of pT for anti-kt jets with R = 0.4 (a), and R = 0.6 (b).
Jet trigger efficiency as a function of y of the third leading jet with pT > 60 GeV and R = 0.4 (c). Jet trigger efficiency as a
function of the minimum separation ∆R between the two closest jets (d). The efficiency is shown both as calculated in data, as described in the text, and in Monte Carlo simulations for the three-jet trigger with a level-1 cut on the jet transverse energy of 10 GeV.
5.3 Jet Reconstruction
Topological clusters of calorimeter energy evaluated at the electromagnetic scale [31] are used as inputs to the jet finding algorithm. These clusters use the baseline calibra-tion derived from test beams and from Z → ee data [34], which reconstructs the energy of particles interacting elec-tromagnetically. The anti-ktalgorithm [9] with resolution
parameters R = 0.4 and R = 0.6 and full four-momentum recombination is used to reconstruct jets from clusters. The jet four-momentum is calculated assuming that the jet origin is at the position of the event vertex. The jet reconstruction is fully efficient in the Monte Carlo simu-lation for jets with transverse momentum above 30 GeV.
The reconstruction efficiency in the simulation compares well with the one measured with data [31].
5.4 Jet Energy Scale Calibration
Jets reconstructed at the electromagnetic scale are mea-sured to have an energy which is lower than the true en-ergy of interacting particles within the jet. The difference between a hadron-level jet and an electromagnetic-scale jet is due to the different calorimeter response to elec-tromagnetic objects compared to strongly interacting ob-jects, detector induced showering and energy deposition in regions of the detector that are not instrumented. A
Monte Carlo-based calibration that corrects for these ef-fects as a function of pTand y is used to obtain jets with
the correct energy scale [35].
5.5 Jet Selection Criteria
Jets considered in the analysis are selected using the fol-lowing kinematic and data quality selection criteria:
1. The event must contain at least one jet with |y| < 2.8 and a pTgreater than 80 GeV.
2. Jets are required to have |y| < 2.8 and pT >60 GeV
in order to be counted.
3. A series of jet cleaning cuts were applied to eliminate various detector effects and suppress beam and other non-collision backgrounds. Overall, these cuts reduce the total number of jets by less than 0.1%. These cuts have been shown to be efficient in eliminating noise, while rejecting a negligible number of true jets. 4. In order the reduce the effects from pileup events, jets
are only accepted if at least 70% of their charged parti-cle pTcomes from the event vertex. The charged
par-ticle pT is calculated as the scalar sum of the pT of
reconstructed tracks within a ∆R equal to the resolu-tion parameter used in the jet reconstrucresolu-tion. Overall, this cut lowers the number of selected two-jet events by 0.4%, and its effect increases with jet multiplicity. The cut reduces the number of selected six-jet events by 3.4%. All observables show a negligible dependence on the number of reconstructed primary vertices once this cut is applied [36]. Jets with no charged particle content are accepted, but only constitute a few percent of events at low pT.
5. Only events with at least two selected jets are used in the analysis.
For illustrative purposes, Figure 2 presents an event display of a six-jet event passing all selection cuts. The transverse energy deposition in the calorimeter is shown as a function of η and φ. For this event, the six selected jets are well separated spatially.
Table 2 presents the total number of multi-jet events versus inclusive jet multiplicity. No correction for trigger pre-scales in the two-jet bin has been applied to the num-bers in the table.
Inclusive multiplicity Number of events
≥ 2 500,148
≥ 3 112,740
≥ 4 10,999
≥ 5 1,100
≥ 6 115
Table 2. Number of selected events using the criteria de-scribed in this paper as a function of inclusive jet multiplicity for jets reconstructed with the anti-kt algorithm with
resolu-tion parameter R = 0.4 before correcting for trigger pre-scales.
6 Data Correction for Efficiencies and
Resolution
A correction is needed to compare the measurements to theoretical predictions. The correction, which accounts for trigger inefficiencies, detector resolutions and other detec-tor effects that affect the jet counting, is performed in a single step using a bin-by-bin multiplicative factor calcu-lated from Monte Carlo simulations. For each measured distribution, the corresponding Monte Carlo simulation cross section using truth jets as defined in Section 3 is eval-uated in the relevant bins, along with the equivalent dis-tributions obtained after the application of detector simu-lation and analysis cuts. The ratio of the true to the sim-ulated distributions provides the multiplicative correction factor to be applied to the measured distributions. The bins are chosen so that bin migrations due to resolution effects are small. Typically, above 70% of events in a bin built using reconstructed quantities come from the same bin using particle-level quantities in the simulation. A sim-ilar fraction of events in a given truth bin fall in the same bin using reconstructed quantities. These fractions, which characterize bin migrations, become smaller with increas-ing jet multiplicity, but never become less than 0.6.
To perform the correction, the ALPGEN+HERWIG/ JIMMY AUET1 Monte Carlo simulation is used. The sam-ple includes, on average, two additional soft proton-proton collision events overlapping with the hard scatter simu-lated by ALPGEN. The data have fewer overlapping col-lisions, as revealed by the distribution of the number of selected vertices, and the Monte Carlo simulation is subse-quently weighted to match the distribution from the data. The truth distribution is independent of the additional collisions, since jets are built using particles simulated by the ALPGEN+HERWIG/JIMMY Monte Carlo sim-ulation only. Distributions in the Monte Carlo simsim-ulation are not further reweighted to match the data. The impact of differences in shapes between data and Monte Carlo simulation on the calculation of the correction factors is instead considered part of the systematic uncertainties in these factors.
The uncertainty in the correction factors is estimated taking into account several effects. One arises from the spread in correction factors coming from different genera-tors (ALPGEN+ HERWIG/JIMMY AUET1 and PYTHIA AMBT1). A second detailed study is performed in which the simulated jet pT, y and φ resolution is varied according
to their measured uncertainties [37, 38]. Third, the shape of the simulated distributions is varied within limits set by the present measurements in order to account for possible biases caused by the input distributions. Samples with a trigger inefficiency in the crack region, with different pile-up rejection cuts and different primary vertex multi-plicity distributions are also used to estimate the uncer-tainty arising from trigger effects and from the impact of overlapping proton-proton collisions. All these effects im-pact the systematic uncertainties in the correction factors, and their uncertainties are ultimately added in quadra-ture to provide the final systematic uncertainty in the bin-by-bin correction. Although only important for particular
Fig. 2. Event display of a six-jet event satisfying the analysis requirements. The towers in the bottom right figure represent transverse energy deposited in the calorimeter projected on a grid of η and φ. Jets with transverse momenta ranging from 84 to 203 GeV are measured in this event.
(a) (b)
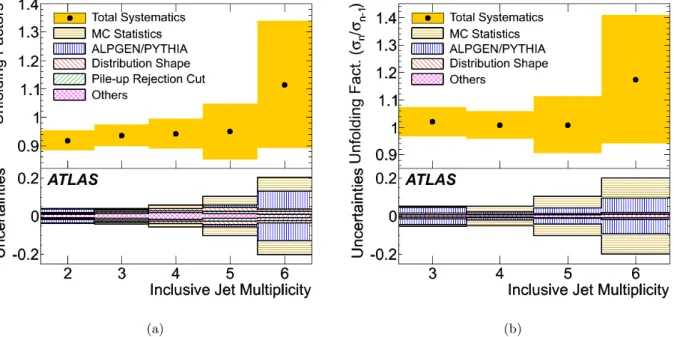
Fig. 3.Bin-by-bin correction factors for the cross sections (a) and for the n to n − 1 cross-section ratios (b) as a function of the inclusive jet multiplicity. The correction factors calculated using the ALPGEN+HERWIG/JIMMY AUET1 sample are shown with the systematic uncertainty as a yellow band around the points. See the text for an explanation of the legend labels.
bins, statistical uncertainties on the correction factors are added to the total uncertainty. Results for the bin-by-bin correction factors are presented in Figure 3. The corre-sponding uncertainties are calculated for the cross section (a) and for the n to n − 1 cross-section ratios (b) as a function of the inclusive jet multiplicity. The combined systematic uncertainty is shown as a yellow band around the correction factors. The main components contributing to the systematic uncertainty are shown at the bottom of each figure. The uncertainty in the correction factors for detector efficiencies and resolutions is smaller for most bins and observables than the uncertainty coming from the jet energy scale calibration, discussed in the next section. The systematic uncertainties in the luminosity calcu-lation affect all cross section measurements, but cancel out in all measurements where cross-section ratios are in-volved. The integrated luminosity of the dataset used in this paper is measured to be 2.43±0.08 pb−1 [39] and the
associated uncertainty is not shown in the figures.
7 Uncertainty on the Jet Energy Scale
The jet energy scale uncertainty is the dominant uncer-tainty for most results presented in this paper. The fact that cross sections fall steeply as a function of jet pT
im-plies that even a relatively small uncertainty in the deter-mination of the jet pTtranslates into a substantial change
in the cross sections as events migrate along the steeply falling curve.
The jet energy scale and its uncertainty [35] have been determined for jets from a dijet sample without nearby activity in the calorimeter. For a multi-jet analysis, ad-ditional systematic uncertainties need to be considered. These uncertainties arise from the difference in the calori-meter response to jets of different flavors as well as the im-pact of the presence of nearby activity in the calorimeter on the jet energy measurement.
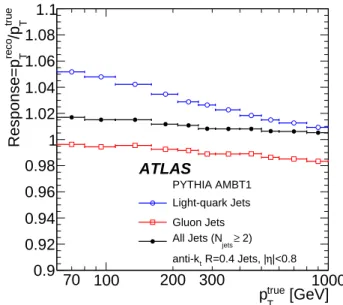
Figure 4 shows the calorimeter pT response for
light-quark and gluon jets in the region |η| < 0.8 as a function of the true jet pTcalculated using the PYTHIA AMBT1
Monte Carlo simulation sample. The response for jets in the two-jet inclusive multiplicity bin is also shown. Light-quark and gluon jets were tagged using the highest-energy parton found in the Monte Carlo simulation particle record within a cone of radius equal to the resolution parameter of the jet algorithm. Only jets that had no additional re-constructed jet of pT > 7 GeV evaluated at the
electro-magnetic scale within ∆R = 1.0 from the jet axis were used in order to decouple effects in the response caused by jet flavor from effects related to the presence of nearby calorimeter activity.
The Monte Carlo simulation shows a slightly higher fraction of jets matched to gluons for high-multiplicity fi-nal states, particularly in the ALPGEN samples. To the extent that the Monte Carlo simulation reflects the data, the difference in response as a function of multiplicity is accounted for in the bin-by-bin correction for efficiencies and resolution. [GeV] true T p 70 100 200 300 1000 true T /p reco T Response=p 0.9 0.92 0.94 0.96 0.98 1 1.02 1.04 1.06 1.08 1.1 ATLAS PYTHIA AMBT1 Light-quark Jets Gluon Jets 2) ≥ jets All Jets (N |<0.8 η R=0.4 Jets, | t anti-k
Fig. 4.Jet response (mean reconstructed jet pTover true jet
pT) as a function of the true pTfor jets tagged as originating
from a light quark or a gluon. The jet response in a sample with at least two jets of pT> 60 GeV (and with those two jets
within |y| < 2.8) is also shown for those jets with |η| < 0.8. The anti-kt algorithm with R = 0.4 is used.
An additional jet energy scale uncertainty, however, could arise, since the standard jet energy scale was de-rived for a particular admixture of light-quark and gluon jets. For a different admixture, the jet energy scale uncer-tainty could be different. In what follows, this unceruncer-tainty is referred to as the ‘flavor response’ uncertainty. This un-certainty is estimated using Monte Carlo simulations [35] by studying the difference between the gluon and light-quark jet response under various assumptions. However, the relative change of the light-quark jet response with respect to the gluon jet response is found to be negligible in all simulations studied [40], so the effect can be safely ignored.
In addition, the fraction of light-quark and gluon jets in multi-jet samples in the data could differ from the frac-tion predicted by the Monte Carlo simulafrac-tions, thus lead-ing to a systematic shift in the jet energy scale. The pre-cision with which the flavor composition of the sample is known thus also affects the precision of the jet energy measurement. The flavor composition depends on many theoretical aspects in the event production (parton dis-tribution functions, limitations of leading-order calcula-tions, initial and final state radiation tuning) and the un-certainty in the predictions is not easy to estimate using Monte Carlo simulations. The uncertainty is determined using a data-driven method that provides a measurement of the flavor composition up to the four-jet inclusive multi-plicity bin and for jets of pT<210 GeV [40]. The method
uses template fits to the distribution of jet widths and to the number of tracks associated with jets in bins of η, pT,
jet isolation and jet multiplicity. The templates are ob-tained using Monte Carlo simulations modified to match
the distributions found in the two-jet bin. Using these tem-plate fits, the measurement of the flavor composition is determined to an accuracy of ≈ 10%. Overall, ALPGEN predicts the correct flavor composition to within 30% in bins where the number of collected events is enough to perform the fits. At high pT and high multiplicities the
flavor composition is assumed to be unknown when calcu-lating the jet energy scale uncertainty.
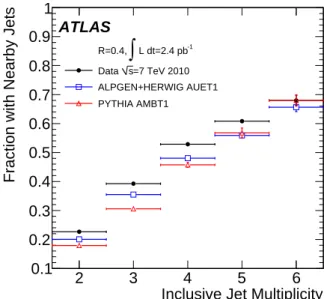
Jets with nearby activity have different properties than the jets used to estimate the jet energy scale uncertainty. In addition, the fraction of jets with nearby activity in-creases with jet multiplicity. Figure 5 gives the probabil-ity of a selected jet occurring within ∆R = 1.0 of a re-constructed jet with pT >7 GeV at the electromagnetic
scale as a function of inclusive jet multiplicity. The overlap
Inclusive Jet Multiplicity
2 3 4 5 6
Fraction with Nearby Jets
0.1 0.2 0.3 0.4 0.5 0.6 0.7 0.8 0.9 1 ATLAS -1 L dt=2.4 pb
∫
R=0.4, =7 TeV 2010 s Data ALPGEN+HERWIG AUET1 PYTHIA AMBT1Fig. 5. Fraction of selected jets in each inclusive multiplicity bin with neighboring jets within ∆R = 1.0. Data (solid circles) are compared to the ALPGEN+HERWIG/JIMMY AUET1 (open squares) and PYTHIA AMBT1 (open triangles) Monte Carlo simulations.
probability increases with jet multiplicity, a trend which is reproduced by the simulations.
Jets with nearby activity have a different jet energy scale, as has been demonstrated in Monte Carlo simu-lations [41]. The systematic uncertainty on their energy scale has been evaluated by studying the correlation be-tween the pTof the tracks associated to the jet and the pT
measured in the calorimeter, and contributes to the final uncertainty in the jet energy scale used in this analysis.
Approximately 40% of the selected events have more than one vertex in the interaction, indicating the pres-ence of additional proton-proton interactions. The vertex multiplicity is low enough that, with a luminous region of several mm and a vertex reconstruction resolution of a few hundred µm, the impact of merged vertices on the analysis is negligible. For the instantaneous luminosities considered in this paper, the probability that two hard
events would occur at the same time is negligible. How-ever, a soft interaction occurring in parallel with the hard interaction can produce a contamination of energy from a nearby soft jet. The average effect of these overlapping interactions on the jet energy scale is accounted for by an offset correction, and the systematic uncertainty on that correction has been evaluated [42]. The impact of this uncertainty on the overall jet energy scale uncertainty used in this analysis is negligible for the vast majority of events. The overlapping interactions can also impact the jet counting since the resolution of the jet energy recon-struction depends on the instantaneous luminosity. The effect becomes small after performing a cut on the frac-tion of charged particle pT that originates from the event
vertex and that is associated to the jet, as described in Section 5. The Monte Carlo simulation has been shown to describe tracks within jets [43] and general features of events with pile-up interactions [42]. An uncertainty due to the efficiency of the cut has been estimated in Section 6. In summary, the jet energy scale uncertainty is primar-ily made of three components: the uncertainty calculated for isolated jets, the uncertainty caused by the presence of nearby calorimeter deposits, and the flavor composition uncertainty. The uncertainty on the energy scale of iso-lated jets is the largest contributor to the total uncertainty in most bins, except for jets in the five and six-jet bins and of pT<200 GeV, for which the flavor composition
uncer-tainty is comparable. The positive systematic unceruncer-tainty on the jet energy scale of isolated jets falling in the barrel and in high-multiplicity bins varies from 5% at 60 GeV to 2.5% at 1 TeV. In the three-jet and four-jet bins, where the flavor composition is better constrained, the system-atic uncertainty is at most 3.5%. The negative systemsystem-atic uncertainty is smaller and ≈ 3% across all pTin the
bar-rel. The impact of nearby calorimeter deposits is small, increasing the overall uncertainty by at most 1%. The un-certainty is propagated to the measured distributions us-ing the ALPGEN+HERWIG/JIMMY Monte Carlo sim-ulation and varying the pT of all jets in the event up or
down according to the estimated uncertainties. The use of the same procedure in the data yields comparable results, but the results obtained in the Monte Carlo simulation are favored to eliminate the impact of statistical uncertainties in the data in bins with few events.
8 Results
In this section, measurements3 corrected to the particle
level are compared to theoretical predictions. For compar-isons to leading-order Monte Carlo simulations, the anti-kt algorithm with resolution parameter R = 0.4 is used
to define a jet. In Figures 6-10 and 12(b), the darker (or-ange) shaded error band bracketing the measured cross section corresponds to the total systematic uncertainty,
3 All measurements in this section have been compiled in
ta-bles that can be found in HEPDATA. The NLO pQCD calcu-lation results are also presented in the tables when applicable.
evaluated by adding the individual systematic uncertain-ties in quadrature but excluding the uncertainty coming from the luminosity measurement. The ratio of the predic-tions from the Monte Carlo simulapredic-tions to the measure-ments is shown at the bottom of each figure. For Figures 6, 8 and 9, the lighter (grey) error band that appears in the ratio of the predictions from the Monte Carlo simulations to the measurements represents the total systematic un-certainty on the shape of the measured distributions.
Only a few representative Monte Carlo simulations that were studied are shown in the figures and tables. All Monte Carlo simulations are normalized to the measured inclusive two jet cross section. The normalization factors applied to the Monte Carlo simulations studied are given in Table 3, and distinctive features of some of the Monte Carlo simulations not shown are discussed when relevant. Most ALPGEN Monte Carlo simulations predict an
inclu-Leading-order Monte Carlo Normalization factor
ALPGEN+HERWIG AUET1 1.11
ALPGEN+PYTHIA MC09′ 1.22
PYTHIA AMBT1 0.65
SHERPA 1.06
Table 3. Normalization factors applied to each of the Monte Carlo simulations in order to match the measured inclusive two-jet cross section.
sive multi-jet cross section similar to the measured cross section, while the PYTHIA Monte Carlo simulation re-quires scaling factors which differ the most from unity. The differences in the normalization factors between ALP-GEN+PYTHIA MC09′and ALPGEN+HERWIG/JIMMY
AUET1 illustrate differences between PYTHIA and HER-WIG/JIMMY and their interplay with the matrix-element and parton-shower matching implemented in ALPGEN. The normalization factor for SHERPA is found to be the closest to unity.
Figure 6 shows the results for the cross section as a function of the inclusive jet multiplicity. The measurement systematics are dominated by the jet energy scale uncer-tainty and range from 10-20% at low multiplicities to al-most 30-40% at high multiplicities. The Monte Carlo sim-ulation predictions agree with the measured results across the full inclusive multiplicity spectrum, even when com-paring just to the shape of the distributions.
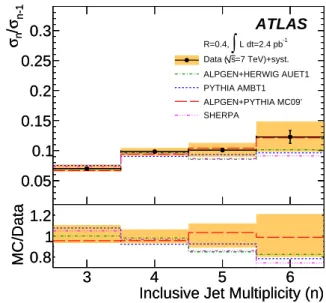
A study that reduces significantly the impact of sys-tematic uncertainties is the ratio of the n-jet to (n − 1)-jet cross section as a function of multiplicity. In this ratio, the impact of the jet energy scale uncertainty is significantly reduced and the uncertainty due to the luminosity cancels out. Figure 7 presents the results for such a study. Both the uncertainties in the data correction for efficiencies and resolutions and the jet energy scale contribute comparably to the total systematic uncertainty, whereas the statistical uncertainties are smaller than the systematic uncertain-ties, and negligible in most bins. All Monte Carlo simula-tions are consistent with the measurements at the present precision, yet there is a noticeable spread in the
predic-2 3 4 5 6 [pb] σ 10 2 10 3 10 4 10 5 10 6 10 2 3 4 5 6 [pb] σ 10 2 10 3 10 4 10 5 10 6 10 ATLAS -1 L dt=2.4 pb
∫
R=0.4, =7 TeV)+syst. s Data ( 1.11 × ALPGEN+HERWIG AUET1 0.65 × PYTHIA AMBT1 1.22 × ALPGEN+PYTHIA MC09’ 1.06 × SHERPAInclusive Jet Multiplicity
2 3 4 5 6
MC/Data 0.5 1 1.5
Inclusive Jet Multiplicity
2 3 4 5 6
MC/Data 0.5 1 1.5
Fig. 6. Total inclusive jet cross section as a function of multiplicity. The data are compared to leading-order Monte Carlo simulations (ALPGEN+HERWIG AUET1, ALP-GEN+PYTHIA MC09′, PYTHIA AMBT1 and SHERPA)
nor-malized to the measured inclusive two-jet cross section. The darker (orange) shaded error bands correspond to the system-atic uncertainties on the measurement, excluding the luminos-ity uncertainty. The lighter (grey) shaded error band corre-sponds to the systematic uncertainty on the shape of the mea-sured distribution. A plot of the ratio of the different Monte Carlo simulations to the data is presented at the bottom of the figure. 3 4 5 6 n-1 σ /n σ 0.05 0.1 0.15 0.2 0.25 0.3 3 4 5 6 n-1 σ /n σ 0.05 0.1 0.15 0.2 0.25 0.3 ATLAS -1 L dt=2.4 pb
∫
R=0.4, =7 TeV)+syst. s Data ( ALPGEN+HERWIG AUET1 PYTHIA AMBT1 ALPGEN+PYTHIA MC09’ SHERPAInclusive Jet Multiplicity (n)
3 4 5 6
MC/Data 0.8 1 1.2
Inclusive Jet Multiplicity (n)
3 4 5 6
MC/Data 0.8 1 1.2
Fig. 7.Ratio of the n-jet cross section to the (n − 1)-jet cross section for values of n varying from three to six. Systematic uncertainties on the cross section ratios are shown as an error band. Other details are as in the caption to Figure 6.
tions. Differences at the level of 15% are observed between PYTHIA AMBT1 and ALPGEN+PYTHIA MC09′in the
first bin. These differences most likely arise from the dif-ference between the pure parton-shower (with 2 → 2 ma-trix elements) implemented in PYTHIA and the parton-shower-matched matrix-element calculation (with up to 2 → 6 matrix elements) implemented in ALPGEN. All ALPGEN+PYTHIA tunes studied are comparable in this measurement.
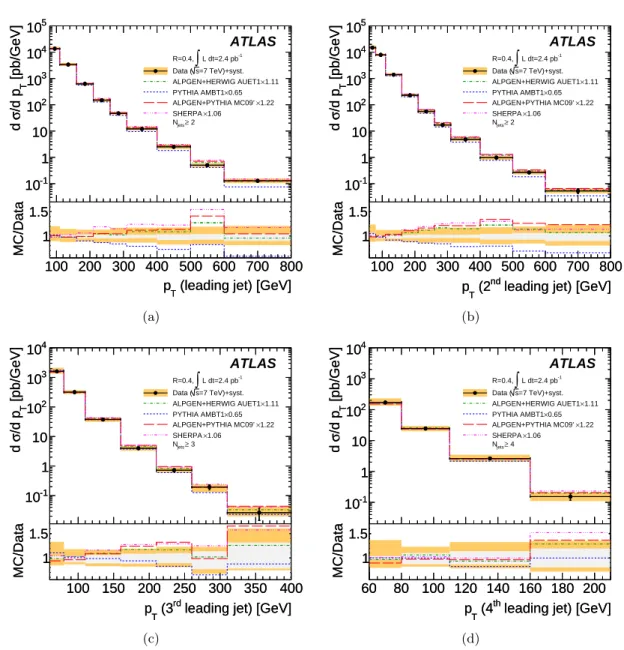
The differential cross section for multi-jet events as a function of the jet pT is useful for characterizing
kine-matic features. The comparison reveals significant differ-ences between the leading order calculations and the mea-surements. Figure 8 presents the pT-dependent differential
cross sections for the leading, second leading, third leading and fourth leading jet in multi-jet events. The systematic uncertainty in the measurement is 10-20% across pTand
increasing up to 30% for the fourth leading jet differential cross section. The jet energy scale systematic uncertainty remains the dominant uncertainty in the measurement. However, the uncertainty is less than 10% (grey shaded error band) for the leading and second leading jet pT
dis-tributions.
All Monte Carlo simulations agree reasonably well with the data (orange darker shaded error band). However, the PYTHIA AMBT1 Monte Carlo simulation predicts a somewhat steeper slope compared to the data as a func-tion of the leading jet pT and the second leading jet pT,
100 200 300 400 500 600 700 800 [pb/GeV] T /d p σ d -1 10 1 10 2 10 3 10 4 10 5 10 100 200 300 400 500 600 700 800 [pb/GeV] T /d p σ d -1 10 1 10 2 10 3 10 4 10 5 10 ATLAS -1 L dt=2.4 pb
∫
R=0.4, =7 TeV)+syst. s Data ( 1.11 × ALPGEN+HERWIG AUET1 0.65 × PYTHIA AMBT1 1.22 × ALPGEN+PYTHIA MC09’ 1.06 × SHERPA 2 ≥ jets N(leading jet) [GeV]
T p 100 200 300 400 500 600 700 800 MC/Data 1 1.5
(leading jet) [GeV]
T p 100 200 300 400 500 600 700 800 MC/Data 1 1.5 (a) 100 200 300 400 500 600 700 800 [pb/GeV] T /d p σ d -1 10 1 10 2 10 3 10 4 10 5 10 100 200 300 400 500 600 700 800 [pb/GeV] T /d p σ d -1 10 1 10 2 10 3 10 4 10 5 10 ATLAS -1 L dt=2.4 pb
∫
R=0.4, =7 TeV)+syst. s Data ( 1.11 × ALPGEN+HERWIG AUET1 0.65 × PYTHIA AMBT1 1.22 × ALPGEN+PYTHIA MC09’ 1.06 × SHERPA 2 ≥ jets Nleading jet) [GeV]
nd (2 T p 100 200 300 400 500 600 700 800 MC/Data 1 1.5
leading jet) [GeV]
nd (2 T p 100 200 300 400 500 600 700 800 MC/Data 1 1.5 (b) 100 150 200 250 300 350 400 [pb/GeV] T /d p σ d -1 10 1 10 2 10 3 10 4 10 100 150 200 250 300 350 400 [pb/GeV] T /d p σ d -1 10 1 10 2 10 3 10 4 10 ATLAS -1 L dt=2.4 pb
∫
R=0.4, =7 TeV)+syst. s Data ( 1.11 × ALPGEN+HERWIG AUET1 0.65 × PYTHIA AMBT1 1.22 × ALPGEN+PYTHIA MC09’ 1.06 × SHERPA 3 ≥ jets Nleading jet) [GeV]
rd (3 T p 100 150 200 250 300 350 400 MC/Data 1 1.5
leading jet) [GeV]
rd (3 T p 100 150 200 250 300 350 400 MC/Data 1 1.5 (c) 60 80 100 120 140 160 180 200 [pb/GeV] T /d p σ d -1 10 1 10 2 10 3 10 4 10 60 80 100 120 140 160 180 200 [pb/GeV] T /d p σ d -1 10 1 10 2 10 3 10 4 10 ATLAS -1 L dt=2.4 pb
∫
R=0.4, =7 TeV)+syst. s Data ( 1.11 × ALPGEN+HERWIG AUET1 0.65 × PYTHIA AMBT1 1.22 × ALPGEN+PYTHIA MC09’ 1.06 × SHERPA 4 ≥ jets Nleading jet) [GeV]
th (4 T p 60 80 100 120 140 160 180 200 MC/Data 1 1.5
leading jet) [GeV]
th (4 T p 60 80 100 120 140 160 180 200 MC/Data 1 1.5 (d)
Fig. 8. Differential cross section as a function of leading jet pTfor events with Njets≥ 2 (a), 2ndleading jet pTfor events with
Njets≥ 2 (b), 3rd leading jet pTfor events with Njets≥ 3 (c) and 4th leading jet pTfor events with Njets≥ 4 (d). The results are
compared to different leading-order Monte Carlo simulations normalized to the measured inclusive two-jet cross section. Other details are as in the caption to Figure 6.
whereas the SHERPA and ALPGEN Monte Carlo simu-lations predict a less steeply falling slope compared to the data. When using additional tunes and different PDFs, Monte Carlo simulations using 2 → 2 matrix element cal-culations, in general, make predictions that fall steeper than what is found in the data, whereas those using 2 → n matrix element calculations predict less steeply falling spectra.
The differential cross section for multi-jet production as a function of HT(the scalar sum of the pTof selected
jets in the event) shows similar properties to the differen-tial cross section as a function of pT. The HTdistributions
are typically used for top-quark studies. Figure 9 gives the results for the HT-dependent differential cross sections for
three different multiplicities compared to the ALPGEN, PYTHIA and SHERPA Monte Carlo simulations. Similar conclusions as those reached in the previous figure can be drawn.
A measurement with particular sensitivity to limita-tions in the leading-order Monte Carlo simulalimita-tions and NLO pQCD calculations is the ratio of the inclusive three-to-two-jet differential cross section as a function of some characteristic scale in the event. In this measurement, the uncertainty in the luminosity determination cancels out, uncertainties in the jet energy scale are reduced, and statistical uncertainties are limited only by the inclusive three-jet sample.
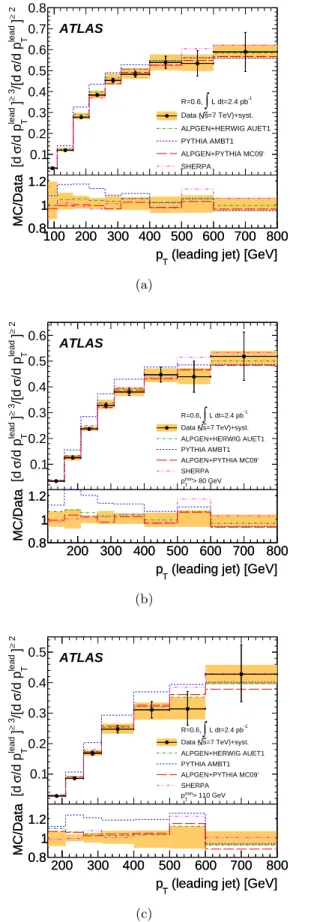
The three-to-two-jet ratio as a function of the leading jet pT can be used to tune Monte Carlo simulations for
effects due to final state radiation. Figure 10 presents the results on the measurement of the three-to-two-jet cross section ratio as a function of leading jet pT for jets built
with the anti-kt algorithm using the resolution
parame-ter R = 0.6 and with different minimum pT cuts for all
non-leading jets4. The cut on the p
T of the leading jet
in the event selection is also increased with the minimum pT cut (pleadT > 110 GeV is used in Figure 10 (b) and
plead
T > 160 GeV in Figure 10 (c)). The systematic
un-certainties on the measurement are small (∼5%), except in the lowest pTbin, where uncertainties in the data
cor-rection for efficiencies and resolutions and the jet energy scale dominate. ALPGEN+HERWIG AUET1 and ALP-GEN+PYTHIA MC09′ describe the data well, and the
agreements are largely independent of the tunes chosen. SHERPA also describes the data well. PYTHIA AMBT1 predicts a higher ratio than that measured over the pT
range from 200 GeV to 600 GeV. The disagreement is sim-ilar when other 2 → 2 Monte Carlo simulations with dif-ferent tunes and PDFs are used. The systematic uncer-tainty in the lowest pT bin decreases significantly as the
minimum pTcut is raised to 80 GeV for all jets.
Figure 11 presents the same measurement results as Figure 10, except the data are now compared to the NLO pQCD calculations corrected for non-perturbative effects. The MSTW 2008 NLO PDF set has been used, but com-parable results are obtained with the CTEQ 6.6 PDF set. The systematic uncertainties on the theoretical
predic-4 Results (not shown) were also obtained using R = 0.4 and
are compiled in tables in HEPDATA.
200 400 600 800 1000 1200 1400 1600 [pb/GeV] T /d H σ d -1 10 1 10 2 10 3 10 4 10 5 10 200 400 600 800 1000 1200 1400 1600 [pb/GeV] T /d H σ d -1 10 1 10 2 10 3 10 4 10 5 10 ATLAS -1 L dt=2.4 pb ∫ R=0.4, =7 TeV)+syst. s Data ( 1.11 × ALPGEN+HERWIG AUET1 0.65 × PYTHIA AMBT1 1.22 × ALPGEN+PYTHIA MC09’ 1.06 × SHERPA 2 ≥ jets N [GeV] T H 200 400 600 800 1000 1200 1400 1600 MC/Data 0.5 1 1.5 [GeV] T H 200 400 600 800 1000 1200 1400 1600 MC/Data 0.5 1 1.5 (a) 200 400 600 800 1000 1200 1400 1600 [pb/GeV] T /d H σ d -1 10 1 10 2 10 3 10 200 400 600 800 1000 1200 1400 1600 [pb/GeV] T /d H σ d -1 10 1 10 2 10 3 10 ATLAS-1 L dt=2.4 pb ∫ R=0.4, =7 TeV)+syst. s Data ( 1.11 × ALPGEN+HERWIG AUET1 0.65 × PYTHIA AMBT1 1.22 × ALPGEN+PYTHIA MC09’ 1.06 × SHERPA 3 ≥ jets N [GeV] T H 200 400 600 800 1000 1200 1400 1600 MC/Data 0.5 1 1.5 [GeV] T H 200 400 600 800 1000 1200 1400 1600 MC/Data 0.5 1 1.5 (b) 400 600 800 1000 1200 1400 1600 [pb/GeV]T /d H σ d -1 10 1 10 2 10 3 10 400 600 800 1000 1200 1400 1600 [pb/GeV]T /d H σ d -1 10 1 10 2 10 3 10 ATLAS -1 L dt=2.4 pb ∫ R=0.4, =7 TeV)+syst. s Data ( 1.11 × ALPGEN+HERWIG AUET1 0.65 × PYTHIA AMBT1 1.22 × ALPGEN+PYTHIA MC09’ 1.06 × SHERPA 4 ≥ jets N [GeV] T H 400 600 800 1000 1200 1400 1600 MC/Data 0.5 1 1.5 [GeV] T H 400 600 800 1000 1200 1400 1600 MC/Data 0.5 1 1.5 (c)
Fig. 9.Differential cross section as a function of HTfor events
with at least two selected jets (a), three selected jets (b) and four selected jets (c). The results are compared to different leading-order Monte Carlo simulations normalized to the mea-sured inclusive two-jet cross section. Other details are as in the caption to Figure 6.
100 200 300 400 500 600 700 800 2 ≥ ] T lead /d p σ /[d 3 ≥ ] T lead /d p σ [d 0.1 0.2 0.3 0.4 0.5 0.6 0.7 0.8 ATLAS -1 L dt=2.4 pb
∫
R=0.6, =7 TeV)+syst. s Data ( ALPGEN+HERWIG AUET1 PYTHIA AMBT1 ALPGEN+PYTHIA MC09’ SHERPA(leading jet) [GeV]
T p 100 200 300 400 500 600 700 800 MC/Data 0.8 1 1.2
(leading jet) [GeV]
T p 100 200 300 400 500 600 700 800 MC/Data 0.8 1 1.2 (a) 200 300 400 500 600 700 800 2 ≥ ] T lead /d p σ /[d 3 ≥ ] T lead /d p σ [d 0.1 0.2 0.3 0.4 0.5 0.6 ATLAS -1 L dt=2.4 pb
∫
R=0.6, =7 TeV)+syst. s Data ( ALPGEN+HERWIG AUET1 PYTHIA AMBT1 ALPGEN+PYTHIA MC09’ SHERPA > 80 GeV min T p(leading jet) [GeV]
T p 200 300 400 500 600 700 800 MC/Data 0.8 1 1.2
(leading jet) [GeV]
T p 200 300 400 500 600 700 800 MC/Data 0.8 1 1.2 (b) 200 300 400 500 600 700 800 2 ≥ ] T lead /d p σ /[d 3 ≥ ] T lead /d p σ [d 0.1 0.2 0.3 0.4 0.5 ATLAS -1 L dt=2.4 pb
∫
R=0.6, =7 TeV)+syst. s Data ( ALPGEN+HERWIG AUET1 PYTHIA AMBT1 ALPGEN+PYTHIA MC09’ SHERPA > 110 GeV min T p(leading jet) [GeV]
T p 200 300 400 500 600 700 800 MC/Data 0.8 1 1.2
(leading jet) [GeV]
T p 200 300 400 500 600 700 800 MC/Data 0.8 1 1.2 (c)
Fig. 10. Three-to-two-jet differential cross-section ratio as a function of the leading jet pT. In the figures, a resolution
pa-rameter R = 0.6 is used. The three figures contain a minimum pT cut for all non-leading jets of (a) 60 GeV, (b) 80 GeV and
(c) 110 GeV. The results are compared to leading-order Monte Carlo simulations. Other details are as in the caption to Fig-ure 6. 100 200 300 400 500 600 700 800 2 ≥ ] T lead /d p σ /[d 3 ≥ ] T lead /d p σ [d 0.1 0.2 0.3 0.4 0.5 0.6 0.7 0.8 ATLAS -1 L dt=2.4 pb
∫
R=0.6, =7 TeV)+syst. s Data ( NLO+non.pert.+syst(leading jet) [GeV]
T p 100 200 300 400 500 600 700 800 Theory/Data 0.5 1 1.5 100 200 300 400 500 600 700 800 0.5 1 1.5 (a) 200 300 400 500 600 700 800 2 ≥ ] T lead /d p σ /[d 3 ≥ ] T lead /d p σ [d 0.1 0.2 0.3 0.4 0.5 0.6 ATLAS -1 L dt=2.4 pb
∫
R=0.6, =7 TeV)+syst. s Data ( NLO+non.pert.+syst > 80 GeV min T p(leading jet) [GeV]
T p 200 300 400 500 600 700 800 Theory/Data 0.5 1 1.5 200 300 400 500 600 700 800 0.5 1 1.5 (b) 200 300 400 500 600 700 800 2 ≥ ] T lead /d p σ /[d 3 ≥ ] T lead /d p σ [d 0.1 0.2 0.3 0.4 0.5 ATLAS -1 L dt=2.4 pb
∫
R=0.6, =7 TeV)+syst. s Data ( NLO+non.pert.+syst > 110 GeV min T p(leading jet) [GeV]
T p 200 300 400 500 600 700 800 Theory/Data 0.5 1 1.5 200 300 400 500 600 700 800 0.5 1 1.5 (c)
Fig. 11. Three-to-two-jet differential cross-section ratio as a function of the leading jet pT. In the figures a resolution
pa-rameter R = 0.6 is used. The three figures contain a minimum pT cut for all non-leading jets of (a) 60 GeV, (b) 80 GeV and
(c) 110 GeV. The results are compared to a NLO pQCD cal-culation with the MSTW 2008 NLO PDF set. The data error bands are identical to the results shown in Figure 10. The sys-tematic uncertainties on the theoretical prediction are shown as dotted red lines above and below the theoretical prediction.
200 400 600 800 1000 1200 2 ≥ ] T (2) /d H σ /[d 3 ≥ ] T (2) /d H σ [d 0.1 0.2 0.3 0.4 0.5 ATLAS -1 L dt=2.4 pb
∫
R=0.6, =7 TeV)+syst. s Data ( NLO+non.pert.+syst [GeV] T (2) H 200 400 600 800 1000 1200 Theory/Data 0.5 1 200 400 600 800 1000 1200 0.5 1 (a) 200 400 600 800 1000 1200 2 ≥ ] T (2) /d H σ /[d 3 ≥ ] T (2) /d H σ [d 0.1 0.2 0.3 0.4 0.5 ATLAS -1 L dt=2.4 pb∫
R=0.6, =7 TeV)+syst. s Data ( ALPGEN+HERWIG AUET1 PYTHIA AMBT1 ALPGEN+PYTHIA MC09’ SHERPA [GeV] T (2) H 200 400 600 800 1000 1200 MC/Data 0.8 1 1.2 [GeV] T (2) H 200 400 600 800 1000 1200 MC/Data 0.8 1 1.2 (b)Fig. 12. Three-to-two-jet differential cross-section ratio as a function of the sum of the pTof the two leading jets (HT(2))
us-ing R = 0.6. The two figures present the same measurements and error bands. The data are compared to (a) a NLO pQCD calculation and (b) several leading-order Monte Carlo simula-tions. The systematic uncertainties on the theoretical predic-tion for the NLO pQCD calculapredic-tions are shown as dotted red lines above and below the theoretical prediction.
tions are shown as dotted red lines above and below the theoretical prediction. The NLO pQCD calculations de-scribe the data well, except in the lowest pT bin, where
there is a large discrepancy. The discrepancy diminishes significantly once the minimum pT for all jets is raised
to 110 GeV and the pT of the leading jet is required to
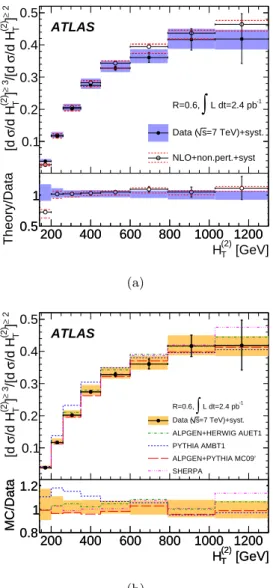
be greater than 160 GeV. Additional NLO pQCD calcula-tions of the three-to-two-jet cross section ratio were per-formed as a function of different kinematic variables, such as HT, the sum of the pT of the two leading jets (HT(2))
and the sum of the pTof the three leading jets. The NLO
pQCD calculation for the ratio as a function of HT(2) was
found to give the smallest theoretical scale uncertainty
and is, therefore, most sensitive to input parameters such as αS. Figure 12 shows a comparison of the measurement
to both (a) NLO pQCD and (b) leading order calculations for R = 0.6. Scale uncertainties of the NLO pQCD calcu-lations are larger for jets with R = 0.4 than with R = 0.6. The theoretical uncertainty of the NLO pQCD calcula-tions shown in Figure 12 is comparable to the measure-ment uncertainties, but is significantly reduced compared to the theoretical uncertainties presented in Figure 11 . With the reduced theoretical uncertainty, the disagree-ment between data and the NLO pQCD calculations in the lowest HT(2) bin is now enhanced. Due to the
kine-matic cuts applied in the analysis, the NLO pQCD calcu-lations only account for the lowest-order contribution to the two-jet cross section in the region where the sum of the first and second leading jet pT is less than 160 GeV.
Consequentially, this effective leading-order estimation is subject to large theoretical uncertainties, which might be responsible for the observed discrepancy.
A comparison of the same measurement to leading-order Monte Carlo simulations is given in Figure 12 (b). The general agreement between leading-order Monte Carlo simulations with the measurements follows the same gen-eral trends as the comparison of the three-to-two-jet ratio versus leading jet pT shown in Figure 10.
9 Summary and Conclusion
A first dedicated study of multi-jet events has been per-formed in proton-proton collisions at a center-of-mass en-ergy of 7 TeV using the ATLAS detector with an inte-grated luminosity of 2.4 pb−1. Leading-order Monte Carlo
simulations have been compared to multi-jet inclusive and differential cross sections. The present study extends up to a multiplicity of six jets, up to jet pT of 800 GeV and
up to event HTof 1.6 TeV.
For events containing two or more jets with pT >
60 GeV, of which at least one has pT>80 GeV, a
reason-able agreement is found between data and leading-order Monte Carlo simulations with parton-shower tunes that describe adequately the ATLAS√s= 7 TeV underlying-event data. The agreement is found after the predictions of the Monte Carlo simulations are normalized to the mea-sured inclusive two-jet cross section.
All models reproduce the main features of the mul-tijet data. The 2 → 2 calculations show some departure from the data for the three-to-two jet cross-section ra-tios, predicting a higher ratio than observed. The 2 → n calculations describe the measured ratios, independent of the tune or parton shower implementation. The shape of the differential cross sections as a function of pTand HT,
studied in the inclusive two-jet and three-jet bins, falls off less (more) steeply in the 2 → n (2 → 2) calculations.
A measurement of the three-to-two-jet cross section ratio as a function of the leading jet pT and the sum of
the two leading jet pTs is described well by ALPGEN,
SHERPA and a NLO pQCD calculation, albeit with a significant discrepancy in the lowest pTbin for the latter
comparison. Future comparisons with NLO pQCD calcu-lations will be useful for constraining parameters, such as parton distribution functions or the value of the strong coupling constant, αS. Systematic uncertainties from the
measurement are presently comparable to the theoretical uncertainties, but should be reduced with larger data sam-ples and higher energy collisions.
We thank CERN for the very successful operation of the LHC, as well as the support staff from our institutions without whom ATLAS could not be operated efficiently.
We acknowledge the support of ANPCyT, Argentina; Yer-PhI, Armenia; ARC, Australia; BMWF, Austria; ANAS, Azer-baijan; SSTC, Belarus; CNPq and FAPESP, Brazil; NSERC, NRC and CFI, Canada; CERN; CONICYT, Chile; CAS, MOST and NSFC, China; COLCIENCIAS, Colombia; MSMT CR, MPO CR and VSC CR, Czech Republic; DNRF, DNSRC and Lundbeck Foundation, Denmark; ARTEMIS, European Union; IN2P3-CNRS, CEA-DSM/IRFU, France; GNAS, Georgia; BMBF, DFG, HGF, MPG and AvH Foundation, Germany; GSRT, Greece; ISF, MINERVA, GIF, DIP and Benoziyo Center, Is-rael; INFN, Italy; MEXT and JSPS, Japan; CNRST, Morocco; FOM and NWO, Netherlands; RCN, Norway; MNiSW, Poland; GRICES and FCT, Portugal; MERYS (MECTS), Romania; MES of Russia and ROSATOM, Russian Federation; JINR; MSTD, Serbia; MSSR, Slovakia; ARRS and MVZT, Slovenia; DST/NRF, South Africa; MICINN, Spain; SRC and Wallen-berg Foundation, Sweden; SER, SNSF and Cantons of Bern and Geneva, Switzerland; NSC, Taiwan; TAEK, Turkey; STFC, the Royal Society and Leverhulme Trust, United Kingdom; DOE and NSF, United States of America.
The crucial computing support from all WLCG partners is acknowledged gratefully, in particular from CERN and the ATLAS Tier-1 facilities at TRIUMF (Canada), NDGF (Den-mark, Norway, Sweden), CC-IN2P3 (France), KIT/GridKA (Germany), INFN-CNAF (Italy), NL-T1 (Netherlands), PIC (Spain), ASGC (Taiwan), RAL (UK) and BNL (USA) and in the Tier-2 facilities worldwide.
References
1. CDF Collaboration, F. Abe et al., Properties of high mass multi - jet events at the Fermilab p¯p collider , Phys. Rev. Lett. 75 (1995) 608.
2. CDF Collaboration, F. Abe et al., Further properties of high mass multi jet events at the Fermilab proton -anti-proton collider , Phys. Rev. D54 (1996) 4221, arXiv:hep-ex/9605004 [hep-ex].
3. D0 Collaboration, B. Abbott et al., Ratios of multijet cross sections in p¯p collisions at√s = 1.8 TeV , Phys. Rev. Lett. 86 (2001) 1955,
arXiv:hep-ex/0009012 [hep-ex].
4. D0 Collaboration, V. M. Abazov et al., Multiple jet production at low transverse energies in p¯p collisions at √
s = 1.8 TeV , Phys. Rev. D67 (2003) 052001, arXiv:hep-ex/0207046 [hep-ex].
5. CMS Collaboration, Measurement of the ratio of the 3-jet to 2-jet cross sections in pp collisions at√s = 7 TeV , arXiv:1106.0647.
6. The ATLAS Collaboration, The ATLAS Experiment at the CERN Large Hadron Collider ,
JINST 3 (2008) S08003.
7. G. Aad et al., ATLAS pixel detector electronics and sensors, JINST 3 (2008) P07007.
8. R. Achenbach et al., The ATLAS Level-1 Calorimeter Trigger , JINST 3 (March, 2008) P03001.
9. M. Cacciari, G. P. Salam, and G. Soyez, The anti-kt jet clustering algorithm, JHEP 04 (2008) 063.
10. M. Cacciari, G. P. Salam, G. Soyez, http://fastjet.fr/. 11. S. Frixione and G. Ridolfi, Jet photoproduction at HERA,
Nucl. Phys. B507 (1997) 315.
12. The ATLAS Collaboration, Measurement of underlying event characteristics using charged particles in pp collisions at√s = 900 GeV and 7 TeV with the ATLAS detector , Phys. Rev. D83 (2011) 112001.
13. M. L. Mangano et al., ALPGEN, a generator for hard multiparton processes in hadronic collisions, JHEP 07 (2003) 001.
14. J. Pumplin et al., New generation of parton distributions with uncertainties from global QCD analysis, JHEP 07 (2002) 012.
15. T. Sjostrand, S. Mrenna, and P. Z. Skands, A Brief Introduction to PYTHIA 8.1 , Comput. Phys. Commun. 178(2008) 852.
16. T. Sjostrand et al., High-energy physics event generation with PYTHIA 6.1 , Comput. Phys. Commun. 135 (2001) 238.
17. G. Corcella et al., HERWIG 6.5: an event generator for Hadron Emission Reactions With Interfering Gluons (including supersymmetric processes), JHEP 01 (2001) 010.
18. G. Corcella et al., HERWIG 6.5 release note, arXiv:hep-ph/0210213.
19. J. M. Butterworth and J. R. Forshaw, Photoproduction of multi - jet events at HERA: A Monte Carlo simulation, J. Phys. G19 (1993) 1657.
20. J. M. Butterworth, J. R. Forshaw, and M. H. Seymour, Multiparton interactions in photoproduction at HERA, Z. Phys. C72 (1996) 637.
21. The ATLAS Collaboration, ATLAS Monte Carlo Tunes for MC09 , ATLAS Note
ATLAS-PHYS-PUB-2010-002 (2010) . 22. The ATLAS Collaboration, First tuning of
HERWIG/JIMMY to ATLAS data, ATLAS Note ATLAS-PHYS-PUB-2010-014 (2010) .
23. T. Gleisberg et al., Event generation with SHERPA 1.1 , JHEP 02 (2009) 007.
24. A. Sherstnev and R. S. Thorne, Different PDF approximations useful for LO Monte Carlo generators, arXiv:0807.2132 [hep-ph].
25. A. D. Martin et al., Parton distributions for the LHC , Eur. Phys. J. C63 (2009) 189.
26. The ATLAS Collaboration, The ATLAS Simulation Infrastructure, Eur. Phys. J. C70 (2010) 823, arXiv:1005.4568.
27. S. Agostinelli et al., Geant simulation, Nucl. Instr. and Meth. A 506 (2003) 250.
28. Z. Nagy, Next-to-Leading order calculation of three jet observables in hadron hadron collisions, Phys. Rev. D68 (2003) 094002.
29. P. M. Nadolsky et al., Implications of CTEQ global analysis for collider observables,
Phys. Rev. D78 (2008) 013004, arXiv:0802.0007 [hep-ph].
30. M. Bahr et al., Herwig++ Physics and Manual , Eur. Phys. J. C58 (2008) 639,
arXiv:0803.0883 [hep-ph].
31. The ATLAS Collaboration, Measurement of inclusive jet and dijet cross sections in proton-proton collisions at 7 TeV centre-of-mass energy with the ATLAS detector , Eur. Phys. J. C71 (2011) 1512.
32. The ATLAS Collaboration, Characterization of Interaction-Point Beam Parameters Using the pp Event-Vertex Distribution Reconstructed in the ATLAS Detector at the LHC , ATLAS Note
ATLAS-CONF-2010-027 (2010) .
33. The ATLAS Collaboration, Performance of primary vertex reconstruction in proton-proton collisions at √
s=7 TeV , ATLAS Note ATLAS-CONF-2010-069 (2010) .
34. The ATLAS Collaboration, Measurement of the W → l ν and Z/γ → l l production cross sections in proton-proton collisions at√s = 7 TeV with the ATLAS detector , JHEP 12 (2010) 60.
35. The ATLAS Collaboration, Final jet energy scale and its systematic uncertainty for jets produced in proton-proton collisions at√s=7 TeV and measured with the ATLAS detector for the 2010 dataset, ATLAS Note
ATLAS-CONF-2011-032 (2011) .
36. The ATLAS Collaboration, Measurements of multi-jet production cross-sections in proton-proton collisions at 7 TeV center-of-mass energy with the ATLAS detector , ATLAS Note ATLAS-CONF-2011-043 (2011) . 37. The ATLAS Collaboration, Jet energy resolution and
reconstruction efficiencies from in-situ techniques with the ATLAS Detector Using Proton-Proton Collisions at a Center of Mass Energy √s=7 TeV , ATLAS Note ATLAS-CONF-2010-054 (2010) .
38. The ATLAS Collaboration, Measurement of Dijet Azimuthal Decorrelations in pp Collisions at sqrt(s)=7 TeV , Phys. Rev. Lett. 106 (2011) 172002.
39. The ATLAS Collaboration, Updated Luminosity
Determination in pp Collisions at √s = 7 TeV using the ATLAS Detector , ATLAS Note
ATLAS-CONF-2011-011 (2011) .
40. The ATLAS Collaboration, Light-quark and Gluon Jets in ATLAS: Calorimeter Response, Jet Energy Scale Systematics, and Sample Characterization, ATLAS Note ATLAS-CONF-2011-053 (2011) .
41. The ATLAS Collaboration, Close-by Jet Effects on Jet Energy Scale Calibration in pp Collisions at √s = 7T eV with the ATLAS Detector , ATLAS Note
ATLAS-CONF-2011-062 (2011) .
42. The ATLAS Collaboration, In-situ jet energy scale and jet shape corrections for multiple interactions in the first ATLAS data at the LHC , ATLAS Note
ATLAS-CONF-2011-030 (2011) .
43. The ATLAS Collaboration, Properties of jets measured from tracks in proton-proton collisions at center-of-mass energy √s = 7 TeV with the ATLAS detector ,
arXiv:1107.3311 [hep-ex]. (submitted to Phys. Rev. D).